
|
|||||
|
 | |
| |
| |
| |
| |
| |
|
Gene: ANKRD40 |
Gene summary for ANKRD40 |
| Gene information | Species | Human | Gene symbol | ANKRD40 | Gene ID | 91369 |
| Gene name | ankyrin repeat domain 40 | |
| Gene Alias | ANKRD40 | |
| Cytomap | 17q21.33 | |
| Gene Type | protein-coding | GO ID | GO:0008150 | UniProtAcc | A8IK34 |
Top |
Malignant transformation analysis |
| Identification of the aberrant gene expression in precancerous and cancerous lesions by comparing the gene expression of stem-like cells in diseased tissues with normal stem cells |
| Entrez ID | Symbol | Replicates | Species | Organ | Tissue | Adj P-value | Log2FC | Malignancy |
| 91369 | ANKRD40 | LZE4T | Human | Esophagus | ESCC | 3.65e-02 | 1.75e-02 | 0.0811 |
| 91369 | ANKRD40 | LZE24T | Human | Esophagus | ESCC | 8.53e-03 | 1.60e-01 | 0.0596 |
| 91369 | ANKRD40 | P2T-E | Human | Esophagus | ESCC | 3.35e-10 | 1.06e-01 | 0.1177 |
| 91369 | ANKRD40 | P4T-E | Human | Esophagus | ESCC | 4.37e-13 | 1.68e-01 | 0.1323 |
| 91369 | ANKRD40 | P5T-E | Human | Esophagus | ESCC | 2.87e-11 | 1.92e-01 | 0.1327 |
| 91369 | ANKRD40 | P8T-E | Human | Esophagus | ESCC | 4.60e-11 | 9.94e-02 | 0.0889 |
| 91369 | ANKRD40 | P9T-E | Human | Esophagus | ESCC | 6.27e-05 | 9.62e-02 | 0.1131 |
| 91369 | ANKRD40 | P10T-E | Human | Esophagus | ESCC | 1.91e-07 | 5.88e-02 | 0.116 |
| 91369 | ANKRD40 | P11T-E | Human | Esophagus | ESCC | 2.82e-05 | 1.44e-01 | 0.1426 |
| 91369 | ANKRD40 | P12T-E | Human | Esophagus | ESCC | 2.74e-12 | 1.61e-01 | 0.1122 |
| 91369 | ANKRD40 | P15T-E | Human | Esophagus | ESCC | 2.17e-08 | 9.92e-02 | 0.1149 |
| 91369 | ANKRD40 | P16T-E | Human | Esophagus | ESCC | 1.95e-05 | 9.04e-02 | 0.1153 |
| 91369 | ANKRD40 | P17T-E | Human | Esophagus | ESCC | 8.87e-04 | 1.30e-01 | 0.1278 |
| 91369 | ANKRD40 | P20T-E | Human | Esophagus | ESCC | 1.47e-04 | 2.82e-02 | 0.1124 |
| 91369 | ANKRD40 | P21T-E | Human | Esophagus | ESCC | 3.35e-11 | 1.31e-01 | 0.1617 |
| 91369 | ANKRD40 | P22T-E | Human | Esophagus | ESCC | 2.47e-13 | 1.56e-01 | 0.1236 |
| 91369 | ANKRD40 | P23T-E | Human | Esophagus | ESCC | 8.28e-06 | 1.00e-01 | 0.108 |
| 91369 | ANKRD40 | P26T-E | Human | Esophagus | ESCC | 3.01e-08 | 1.25e-01 | 0.1276 |
| 91369 | ANKRD40 | P27T-E | Human | Esophagus | ESCC | 5.96e-12 | 1.47e-01 | 0.1055 |
| 91369 | ANKRD40 | P28T-E | Human | Esophagus | ESCC | 7.33e-10 | 2.21e-01 | 0.1149 |
| Page: 1 2 3 4 |
| Tissue | Expression Dynamics | Abbreviation |
| Esophagus |  | ESCC: Esophageal squamous cell carcinoma |
| HGIN: High-grade intraepithelial neoplasias | ||
| LGIN: Low-grade intraepithelial neoplasias | ||
| Oral Cavity | 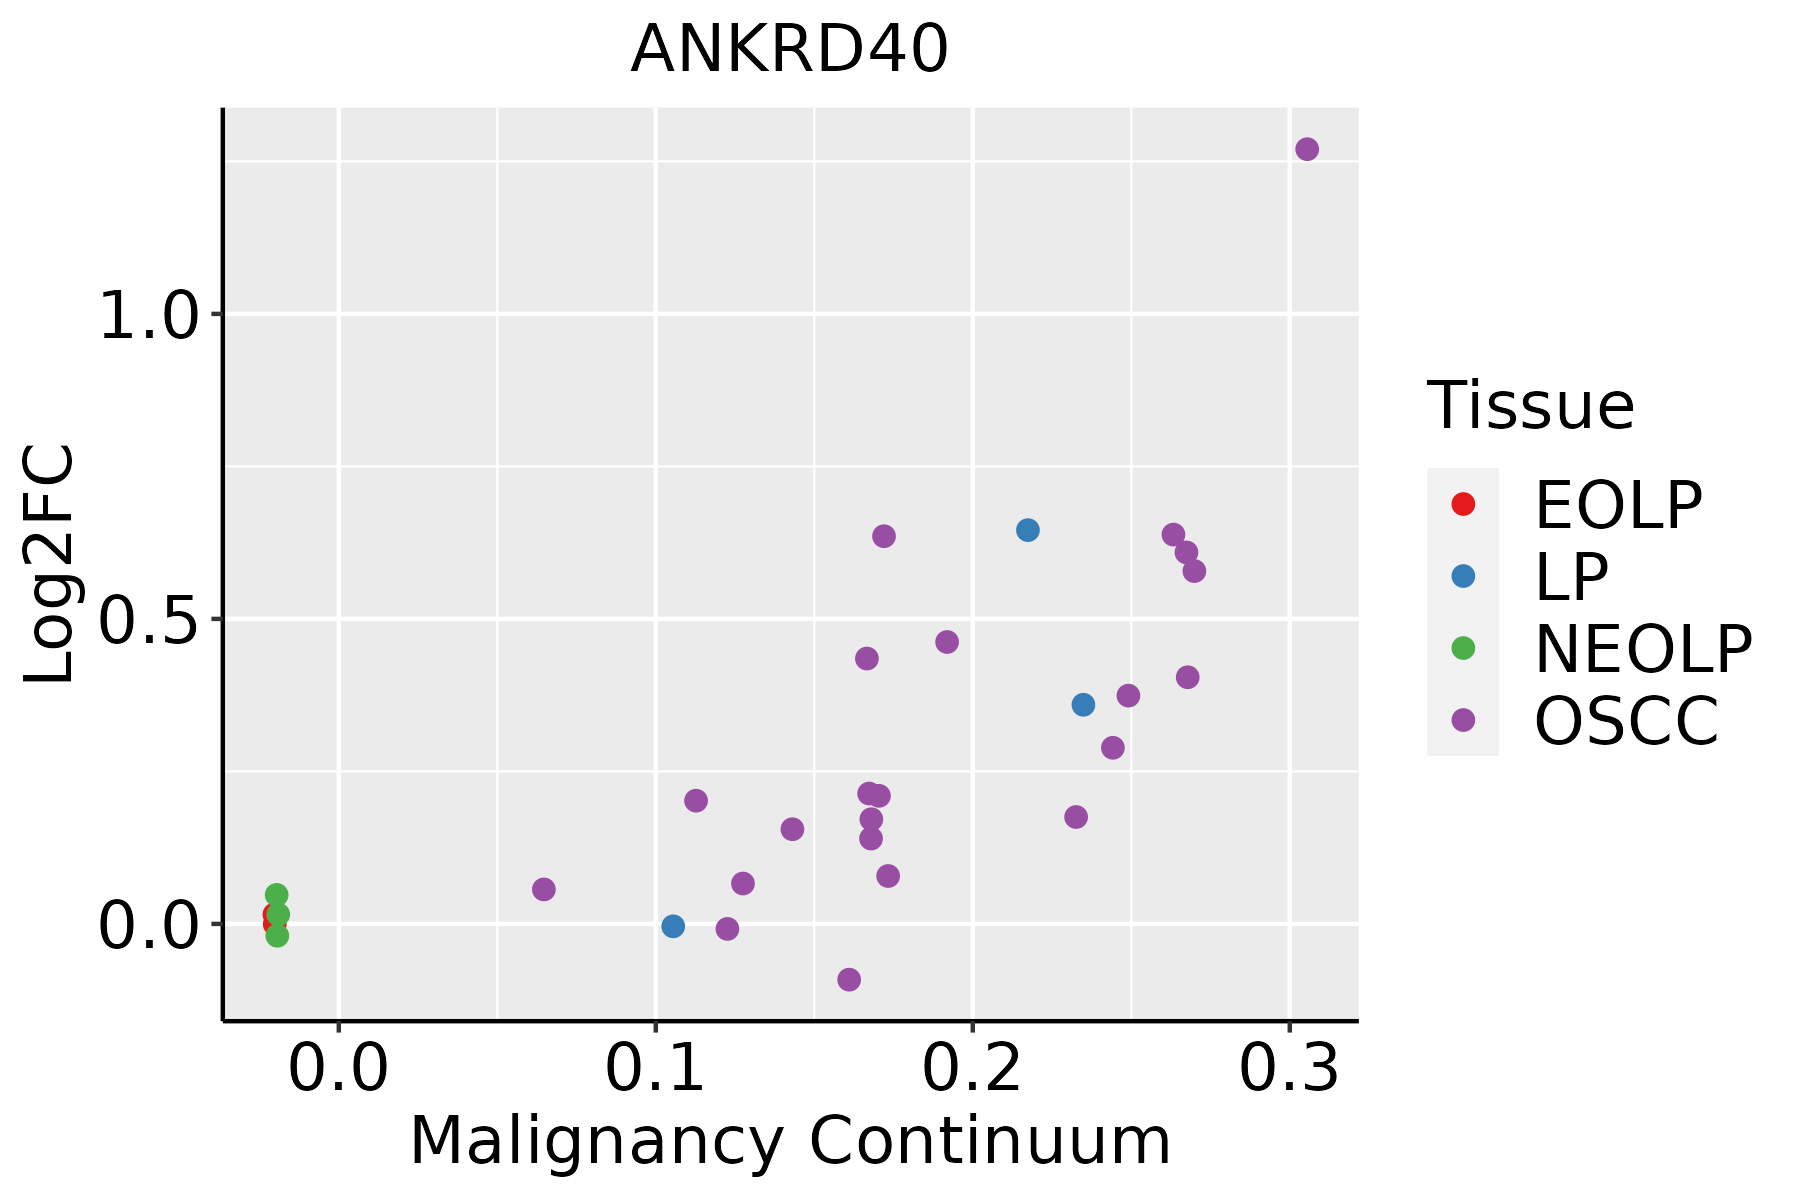 | EOLP: Erosive Oral lichen planus |
| LP: leukoplakia | ||
| NEOLP: Non-erosive oral lichen planus | ||
| OSCC: Oral squamous cell carcinoma |
| ∗log2FC in expression of this searched gene in stem-like cells from each diseased tissue sample relative to stem-like cells in normal samples in each tissue plotted against the malignancy continuum. Samples are colored based on if they are from different disease stage. |
Top |
Malignant transformation related pathway analysis |
| Find out the enriched GO biological processes and KEGG pathways involved in transition from healthy to precancer to cancer |
| Tissue | Disease Stage | Enriched GO biological Processes |
| Colorectum | AD |  |
| Colorectum | SER |  |
| Colorectum | MSS |  |
| Colorectum | MSI-H |  |
| Colorectum | FAP |  |
| ∗Top 15 enriched GO BP terms are showed in the bar plot of each disease state in each tissue. Each row represents a significant GO biological process which is colored according to the -log10(p.adjust). |
| Page: 1 2 3 4 5 6 7 8 9 |
| GO ID | Tissue | Disease Stage | Description | Gene Ratio | Bg Ratio | pvalue | p.adjust | Count |
| Page: 1 |
| Pathway ID | Tissue | Disease Stage | Description | Gene Ratio | Bg Ratio | pvalue | p.adjust | qvalue | Count |
| Page: 1 |
Top |
Cell-cell communication analysis |
| Identification of potential cell-cell interactions between two cell types and their ligand-receptor pairs for different disease states |
| Ligand | Receptor | LRpair | Pathway | Tissue | Disease Stage |
| Page: 1 |
Top |
Single-cell gene regulatory network inference analysis |
| Find out the significant the regulons (TFs) and the target genes of each regulon across cell types for different disease states |
| TF | Cell Type | Tissue | Disease Stage | Target Gene | RSS | Regulon Activity |
| ∗The dot plots of a searched regulon are shown for all cell subpopulations in each disease state of each tissue based on the regulon specific score inferred using pySCENIC and by calculating the average expression. |
| Page: 1 |
Top |
Somatic mutation of malignant transformation related genes |
| Annotation of somatic variants for genes involved in malignant transformation |
| Hugo Symbol | Variant Class | Variant Classification | dbSNP RS | HGVSc | HGVSp | HGVSp Short | SWISSPROT | BIOTYPE | SIFT | PolyPhen | Tumor Sample Barcode | Tissue | Histology | Sex | Age | Stage | Therapy Types | Drugs | Outcome |
| ANKRD40 | SNV | Missense_Mutation | rs747882315 | c.563N>A | p.Gly188Asp | p.G188D | Q6AI12 | protein_coding | deleterious(0.03) | benign(0.015) | TCGA-A2-A0EO-01 | Breast | breast invasive carcinoma | Female | <65 | I/II | Hormone Therapy | tamoxiphen | SD |
| ANKRD40 | SNV | Missense_Mutation | novel | c.698N>G | p.Pro233Arg | p.P233R | Q6AI12 | protein_coding | tolerated(0.23) | benign(0.027) | TCGA-A7-A3IZ-01 | Breast | breast invasive carcinoma | Female | <65 | I/II | Chemotherapy | cytoxan | SD |
| ANKRD40 | SNV | Missense_Mutation | novel | c.665C>T | p.Ser222Phe | p.S222F | Q6AI12 | protein_coding | tolerated(0.08) | benign(0.204) | TCGA-D8-A27G-01 | Breast | breast invasive carcinoma | Female | >=65 | I/II | Unknown | Unknown | SD |
| ANKRD40 | SNV | Missense_Mutation | novel | c.961N>T | p.Asp321Tyr | p.D321Y | Q6AI12 | protein_coding | deleterious(0) | probably_damaging(0.959) | TCGA-EW-A6SC-01 | Breast | breast invasive carcinoma | Female | <65 | I/II | Hormone Therapy | aromatase | SD |
| ANKRD40 | insertion | Nonsense_Mutation | novel | c.560_561insGGTTCAAGTGATTCTTCTGCCTCAGCCTCCCAAGTAGC | p.Asn187LysfsTer13 | p.N187Kfs*13 | Q6AI12 | protein_coding | TCGA-A2-A0EO-01 | Breast | breast invasive carcinoma | Female | <65 | I/II | Hormone Therapy | tamoxiphen | SD | ||
| ANKRD40 | SNV | Missense_Mutation | novel | c.386T>C | p.Phe129Ser | p.F129S | Q6AI12 | protein_coding | deleterious(0) | possibly_damaging(0.831) | TCGA-VS-A94W-01 | Cervix | cervical & endocervical cancer | Female | <65 | I/II | Chemotherapy | cisplatin | CR |
| ANKRD40 | SNV | Missense_Mutation | novel | c.379N>A | p.Pro127Thr | p.P127T | Q6AI12 | protein_coding | deleterious(0) | probably_damaging(0.96) | TCGA-A6-A565-01 | Colorectum | colon adenocarcinoma | Female | <65 | III/IV | Unspecific | 5FU | PD |
| ANKRD40 | SNV | Missense_Mutation | c.238C>T | p.Pro80Ser | p.P80S | Q6AI12 | protein_coding | tolerated(0.22) | possibly_damaging(0.541) | TCGA-AA-3821-01 | Colorectum | colon adenocarcinoma | Female | >=65 | I/II | Unknown | Unknown | SD | |
| ANKRD40 | insertion | Frame_Shift_Ins | novel | c.467_468insC | p.Ala157CysfsTer33 | p.A157Cfs*33 | Q6AI12 | protein_coding | TCGA-AY-6197-01 | Colorectum | colon adenocarcinoma | Male | <65 | I/II | Unknown | Unknown | SD | ||
| ANKRD40 | SNV | Missense_Mutation | c.873N>T | p.Glu291Asp | p.E291D | Q6AI12 | protein_coding | tolerated(0.85) | benign(0.056) | TCGA-AP-A059-01 | Endometrium | uterine corpus endometrioid carcinoma | Female | >=65 | I/II | Unknown | Unknown | SD |
| Page: 1 2 3 |
Top |
Related drugs of malignant transformation related genes |
| Identification of chemicals and drugs interact with genes involved in malignant transfromation |
| (DGIdb 4.0) |
| Entrez ID | Symbol | Category | Interaction Types | Drug Claim Name | Drug Name | PMIDs |
| Page: 1 |

Copyright 2023-Present -The University of Texas Health Science Center at Houston |