
|
|||||
|
 | |
| |
| |
| |
| |
| |
|
Gene: ANKRD39 |
Gene summary for ANKRD39 |
| Gene information | Species | Human | Gene symbol | ANKRD39 | Gene ID | 51239 |
| Gene name | ankyrin repeat domain 39 | |
| Gene Alias | ANKRD39 | |
| Cytomap | 2q11.2 | |
| Gene Type | protein-coding | GO ID | GO:0000209 | UniProtAcc | Q53RE8 |
Top |
Malignant transformation analysis |
| Identification of the aberrant gene expression in precancerous and cancerous lesions by comparing the gene expression of stem-like cells in diseased tissues with normal stem cells |
| Entrez ID | Symbol | Replicates | Species | Organ | Tissue | Adj P-value | Log2FC | Malignancy |
| 51239 | ANKRD39 | LZE4T | Human | Esophagus | ESCC | 1.14e-12 | 3.95e-01 | 0.0811 |
| 51239 | ANKRD39 | LZE7T | Human | Esophagus | ESCC | 1.77e-11 | 4.77e-01 | 0.0667 |
| 51239 | ANKRD39 | LZE8T | Human | Esophagus | ESCC | 1.84e-07 | 1.83e-01 | 0.067 |
| 51239 | ANKRD39 | LZE20T | Human | Esophagus | ESCC | 2.74e-02 | 7.90e-02 | 0.0662 |
| 51239 | ANKRD39 | LZE22T | Human | Esophagus | ESCC | 9.54e-05 | 2.79e-01 | 0.068 |
| 51239 | ANKRD39 | LZE24T | Human | Esophagus | ESCC | 2.39e-10 | 3.07e-01 | 0.0596 |
| 51239 | ANKRD39 | LZE21T | Human | Esophagus | ESCC | 9.62e-07 | 4.00e-01 | 0.0655 |
| 51239 | ANKRD39 | LZE6T | Human | Esophagus | ESCC | 3.78e-04 | 1.43e-01 | 0.0845 |
| 51239 | ANKRD39 | P1T-E | Human | Esophagus | ESCC | 1.94e-07 | 3.86e-01 | 0.0875 |
| 51239 | ANKRD39 | P2T-E | Human | Esophagus | ESCC | 5.12e-32 | 6.07e-01 | 0.1177 |
| 51239 | ANKRD39 | P4T-E | Human | Esophagus | ESCC | 2.77e-41 | 8.08e-01 | 0.1323 |
| 51239 | ANKRD39 | P5T-E | Human | Esophagus | ESCC | 5.86e-29 | 5.74e-01 | 0.1327 |
| 51239 | ANKRD39 | P8T-E | Human | Esophagus | ESCC | 1.59e-14 | 2.74e-01 | 0.0889 |
| 51239 | ANKRD39 | P9T-E | Human | Esophagus | ESCC | 2.41e-17 | 2.37e-01 | 0.1131 |
| 51239 | ANKRD39 | P10T-E | Human | Esophagus | ESCC | 2.51e-33 | 5.27e-01 | 0.116 |
| 51239 | ANKRD39 | P11T-E | Human | Esophagus | ESCC | 1.03e-15 | 6.01e-01 | 0.1426 |
| 51239 | ANKRD39 | P12T-E | Human | Esophagus | ESCC | 1.03e-51 | 9.54e-01 | 0.1122 |
| 51239 | ANKRD39 | P15T-E | Human | Esophagus | ESCC | 3.18e-38 | 7.65e-01 | 0.1149 |
| 51239 | ANKRD39 | P16T-E | Human | Esophagus | ESCC | 7.10e-28 | 4.70e-01 | 0.1153 |
| 51239 | ANKRD39 | P17T-E | Human | Esophagus | ESCC | 4.06e-03 | 1.78e-01 | 0.1278 |
| Page: 1 2 3 4 5 |
| Tissue | Expression Dynamics | Abbreviation |
| Esophagus | 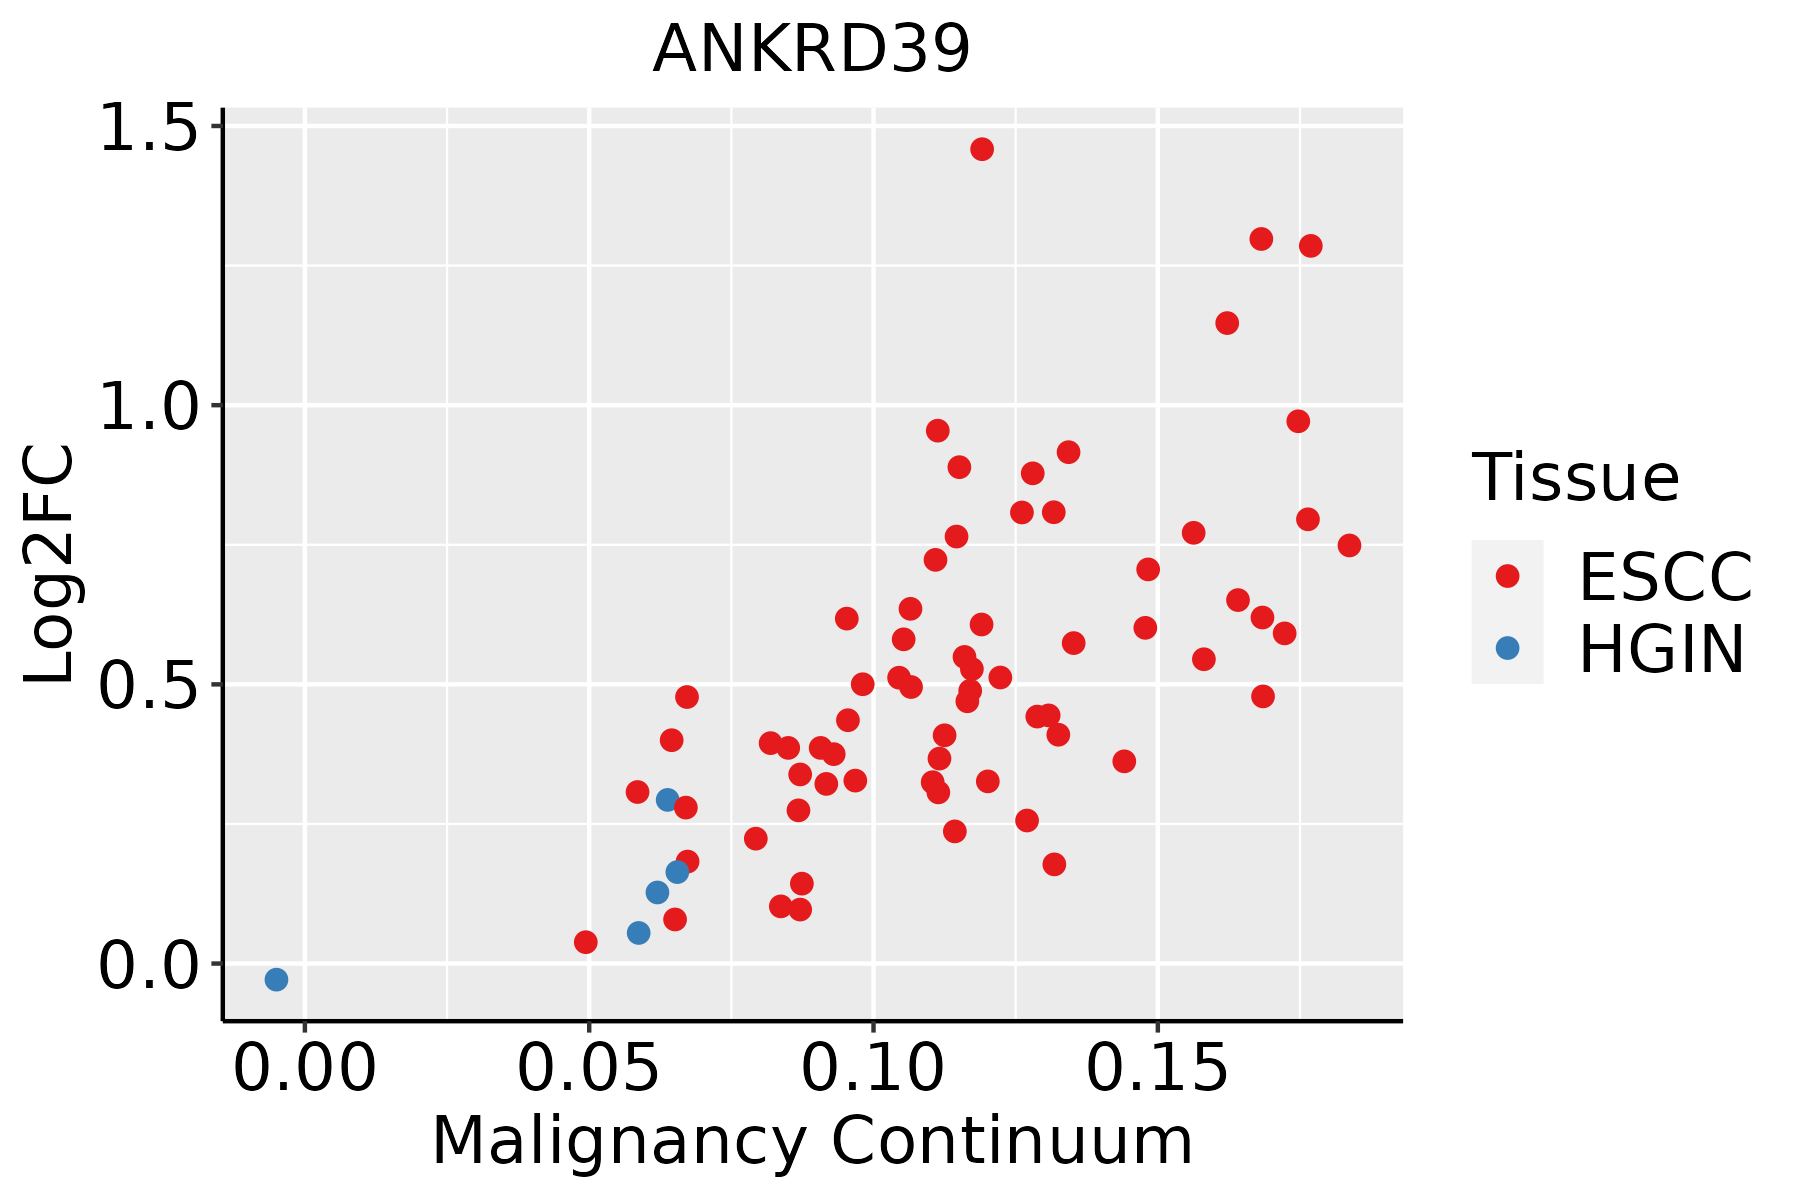 | ESCC: Esophageal squamous cell carcinoma |
| HGIN: High-grade intraepithelial neoplasias | ||
| LGIN: Low-grade intraepithelial neoplasias | ||
| Liver |  | HCC: Hepatocellular carcinoma |
| NAFLD: Non-alcoholic fatty liver disease | ||
| Oral Cavity |  | EOLP: Erosive Oral lichen planus |
| LP: leukoplakia | ||
| NEOLP: Non-erosive oral lichen planus | ||
| OSCC: Oral squamous cell carcinoma |
| ∗log2FC in expression of this searched gene in stem-like cells from each diseased tissue sample relative to stem-like cells in normal samples in each tissue plotted against the malignancy continuum. Samples are colored based on if they are from different disease stage. |
Top |
Malignant transformation related pathway analysis |
| Find out the enriched GO biological processes and KEGG pathways involved in transition from healthy to precancer to cancer |
| Tissue | Disease Stage | Enriched GO biological Processes |
| Colorectum | AD |  |
| Colorectum | SER |  |
| Colorectum | MSS |  |
| Colorectum | MSI-H |  |
| Colorectum | FAP |  |
| ∗Top 15 enriched GO BP terms are showed in the bar plot of each disease state in each tissue. Each row represents a significant GO biological process which is colored according to the -log10(p.adjust). |
| Page: 1 2 3 4 5 6 7 8 9 |
| GO ID | Tissue | Disease Stage | Description | Gene Ratio | Bg Ratio | pvalue | p.adjust | Count |
| GO:000020917 | Esophagus | ESCC | protein polyubiquitination | 170/8552 | 236/18723 | 1.40e-16 | 1.09e-14 | 170 |
| GO:000020911 | Liver | Cirrhotic | protein polyubiquitination | 89/4634 | 236/18723 | 6.09e-06 | 9.80e-05 | 89 |
| GO:000020921 | Liver | HCC | protein polyubiquitination | 151/7958 | 236/18723 | 1.90e-11 | 7.59e-10 | 151 |
| GO:000020910 | Oral cavity | OSCC | protein polyubiquitination | 150/7305 | 236/18723 | 1.59e-14 | 9.27e-13 | 150 |
| GO:000020915 | Oral cavity | LP | protein polyubiquitination | 82/4623 | 236/18723 | 3.23e-04 | 3.26e-03 | 82 |
| Page: 1 |
| Pathway ID | Tissue | Disease Stage | Description | Gene Ratio | Bg Ratio | pvalue | p.adjust | qvalue | Count |
| Page: 1 |
Top |
Cell-cell communication analysis |
| Identification of potential cell-cell interactions between two cell types and their ligand-receptor pairs for different disease states |
| Ligand | Receptor | LRpair | Pathway | Tissue | Disease Stage |
| Page: 1 |
Top |
Single-cell gene regulatory network inference analysis |
| Find out the significant the regulons (TFs) and the target genes of each regulon across cell types for different disease states |
| TF | Cell Type | Tissue | Disease Stage | Target Gene | RSS | Regulon Activity |
| ∗The dot plots of a searched regulon are shown for all cell subpopulations in each disease state of each tissue based on the regulon specific score inferred using pySCENIC and by calculating the average expression. |
| Page: 1 |
Top |
Somatic mutation of malignant transformation related genes |
| Annotation of somatic variants for genes involved in malignant transformation |
| Hugo Symbol | Variant Class | Variant Classification | dbSNP RS | HGVSc | HGVSp | HGVSp Short | SWISSPROT | BIOTYPE | SIFT | PolyPhen | Tumor Sample Barcode | Tissue | Histology | Sex | Age | Stage | Therapy Types | Drugs | Outcome |
| ANKRD39 | SNV | Missense_Mutation | novel | c.452A>T | p.Gln151Leu | p.Q151L | Q53RE8 | protein_coding | deleterious(0.02) | benign(0.09) | TCGA-PE-A5DC-01 | Breast | breast invasive carcinoma | Female | >=65 | III/IV | Unknown | Unknown | SD |
| ANKRD39 | SNV | Missense_Mutation | rs145738875 | c.427N>A | p.Gly143Arg | p.G143R | Q53RE8 | protein_coding | tolerated(0.37) | benign(0) | TCGA-AJ-A23O-01 | Endometrium | uterine corpus endometrioid carcinoma | Female | >=65 | I/II | Unknown | Unknown | SD |
| ANKRD39 | SNV | Missense_Mutation | rs754661153 | c.110N>T | p.Ser37Leu | p.S37L | Q53RE8 | protein_coding | deleterious(0.01) | benign(0.195) | TCGA-AJ-A3EK-01 | Endometrium | uterine corpus endometrioid carcinoma | Female | <65 | I/II | Chemotherapy | carboplatin | CR |
| ANKRD39 | SNV | Missense_Mutation | novel | c.232G>A | p.Ala78Thr | p.A78T | Q53RE8 | protein_coding | tolerated(0.49) | benign(0.061) | TCGA-AX-A2HD-01 | Endometrium | uterine corpus endometrioid carcinoma | Female | >=65 | III/IV | Unknown | Unknown | SD |
| ANKRD39 | SNV | Missense_Mutation | novel | c.361T>C | p.Ser121Pro | p.S121P | Q53RE8 | protein_coding | deleterious(0) | benign(0.27) | TCGA-B5-A1MR-01 | Endometrium | uterine corpus endometrioid carcinoma | Female | >=65 | III/IV | Unknown | Unknown | SD |
| ANKRD39 | SNV | Missense_Mutation | novel | c.10N>T | p.Pro4Ser | p.P4S | Q53RE8 | protein_coding | tolerated_low_confidence(0.13) | probably_damaging(0.994) | TCGA-EC-A1QX-01 | Endometrium | uterine corpus endometrioid carcinoma | Female | >=65 | I/II | Chemotherapy | cyclophosphamide | PD |
| ANKRD39 | SNV | Missense_Mutation | rs773816799 | c.197C>T | p.Thr66Ile | p.T66I | Q53RE8 | protein_coding | deleterious(0) | possibly_damaging(0.883) | TCGA-62-A472-01 | Lung | lung adenocarcinoma | Male | >=65 | I/II | Unknown | Unknown | PD |
| ANKRD39 | SNV | Missense_Mutation | novel | c.437N>A | p.Cys146Tyr | p.C146Y | Q53RE8 | protein_coding | deleterious(0) | probably_damaging(0.983) | TCGA-BB-4217-01 | Oral cavity | head & neck squamous cell carcinoma | Male | >=65 | I/II | Unknown | Unknown | SD |
| ANKRD39 | SNV | Missense_Mutation | rs771218314 | c.478N>T | p.Arg160Trp | p.R160W | Q53RE8 | protein_coding | deleterious(0.01) | probably_damaging(0.954) | TCGA-BR-4257-01 | Stomach | stomach adenocarcinoma | Female | >=65 | I/II | Unknown | Unknown | SD |
| Page: 1 |
Top |
Related drugs of malignant transformation related genes |
| Identification of chemicals and drugs interact with genes involved in malignant transfromation |
| (DGIdb 4.0) |
| Entrez ID | Symbol | Category | Interaction Types | Drug Claim Name | Drug Name | PMIDs |
| Page: 1 |

Copyright 2023-Present -The University of Texas Health Science Center at Houston |