
|
|||||
|
 | |
| |
| |
| |
| |
| |
|
Gene: ANKRD37 |
Gene summary for ANKRD37 |
| Gene information | Species | Human | Gene symbol | ANKRD37 | Gene ID | 353322 |
| Gene name | ankyrin repeat domain 37 | |
| Gene Alias | Lrp2bp | |
| Cytomap | 4q35.1 | |
| Gene Type | protein-coding | GO ID | GO:0005575 | UniProtAcc | Q7Z713 |
Top |
Malignant transformation analysis |
| Identification of the aberrant gene expression in precancerous and cancerous lesions by comparing the gene expression of stem-like cells in diseased tissues with normal stem cells |
| Entrez ID | Symbol | Replicates | Species | Organ | Tissue | Adj P-value | Log2FC | Malignancy |
| 353322 | ANKRD37 | GSM4909311 | Human | Breast | IDC | 3.23e-07 | -1.99e-01 | 0.1534 |
| 353322 | ANKRD37 | GSM4909319 | Human | Breast | IDC | 2.93e-06 | -1.40e-01 | 0.1563 |
| 353322 | ANKRD37 | ctrl6 | Human | Breast | Precancer | 2.38e-15 | 7.45e-01 | -0.0061 |
| 353322 | ANKRD37 | brca7 | Human | Breast | Precancer | 1.51e-05 | 7.89e-01 | -0.009 |
| 353322 | ANKRD37 | brca10 | Human | Breast | Precancer | 4.53e-16 | 5.78e-01 | -0.0029 |
| 353322 | ANKRD37 | NCCBC3 | Human | Breast | DCIS | 1.52e-05 | -2.03e-01 | 0.1198 |
| 353322 | ANKRD37 | P1 | Human | Breast | IDC | 8.68e-03 | -9.38e-02 | 0.1527 |
| 353322 | ANKRD37 | DCIS2 | Human | Breast | DCIS | 4.99e-20 | 1.94e-02 | 0.0085 |
| 353322 | ANKRD37 | CA_HPV_1 | Human | Cervix | CC | 8.67e-04 | -1.58e-01 | 0.0264 |
| 353322 | ANKRD37 | Tumor | Human | Cervix | CC | 6.07e-05 | -2.17e-01 | 0.1241 |
| 353322 | ANKRD37 | sample1 | Human | Cervix | CC | 3.20e-07 | 5.81e-01 | 0.0959 |
| 353322 | ANKRD37 | T1 | Human | Cervix | CC | 5.07e-19 | 6.84e-01 | 0.0918 |
| 353322 | ANKRD37 | AEH-subject1 | Human | Endometrium | AEH | 2.72e-22 | 7.40e-01 | -0.3059 |
| 353322 | ANKRD37 | AEH-subject2 | Human | Endometrium | AEH | 3.49e-13 | 6.16e-01 | -0.2525 |
| 353322 | ANKRD37 | AEH-subject3 | Human | Endometrium | AEH | 2.47e-09 | 4.45e-01 | -0.2576 |
| 353322 | ANKRD37 | EEC-subject2 | Human | Endometrium | EEC | 1.19e-04 | 3.26e-01 | -0.2607 |
| 353322 | ANKRD37 | LZE4T | Human | Esophagus | ESCC | 2.78e-12 | 8.45e-01 | 0.0811 |
| 353322 | ANKRD37 | LZE7T | Human | Esophagus | ESCC | 9.11e-14 | 1.32e+00 | 0.0667 |
| 353322 | ANKRD37 | LZE8T | Human | Esophagus | ESCC | 1.53e-13 | 9.56e-01 | 0.067 |
| 353322 | ANKRD37 | LZE20T | Human | Esophagus | ESCC | 1.89e-14 | 1.22e+00 | 0.0662 |
| Page: 1 2 3 4 5 6 |
| Tissue | Expression Dynamics | Abbreviation |
| Breast | 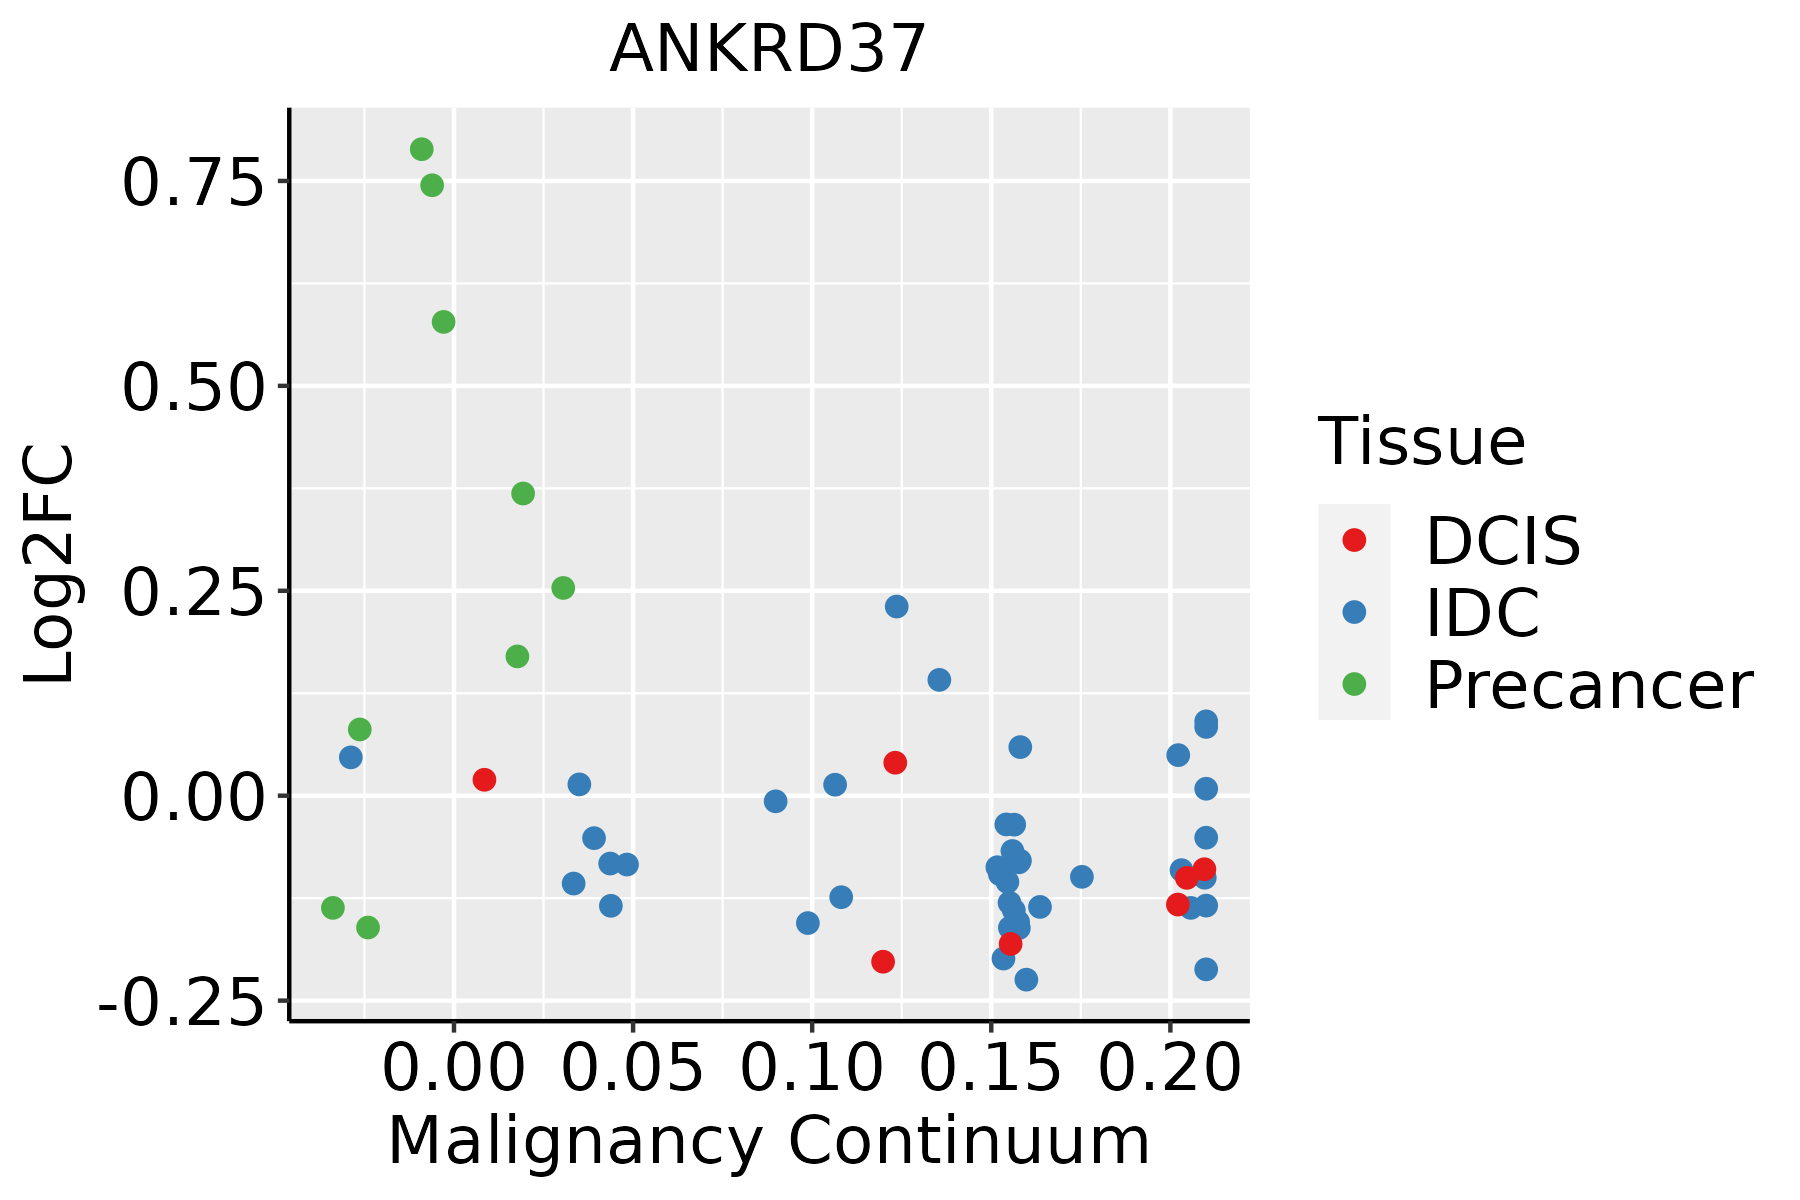 | IDC: Invasive ductal carcinoma |
| DCIS: Ductal carcinoma in situ | ||
| Precancer(BRCA1-mut): Precancerous lesion from BRCA1 mutation carriers | ||
| Cervix |  | CC: Cervix cancer |
| HSIL_HPV: HPV-infected high-grade squamous intraepithelial lesions | ||
| N_HPV: HPV-infected normal cervix | ||
| Endometrium | 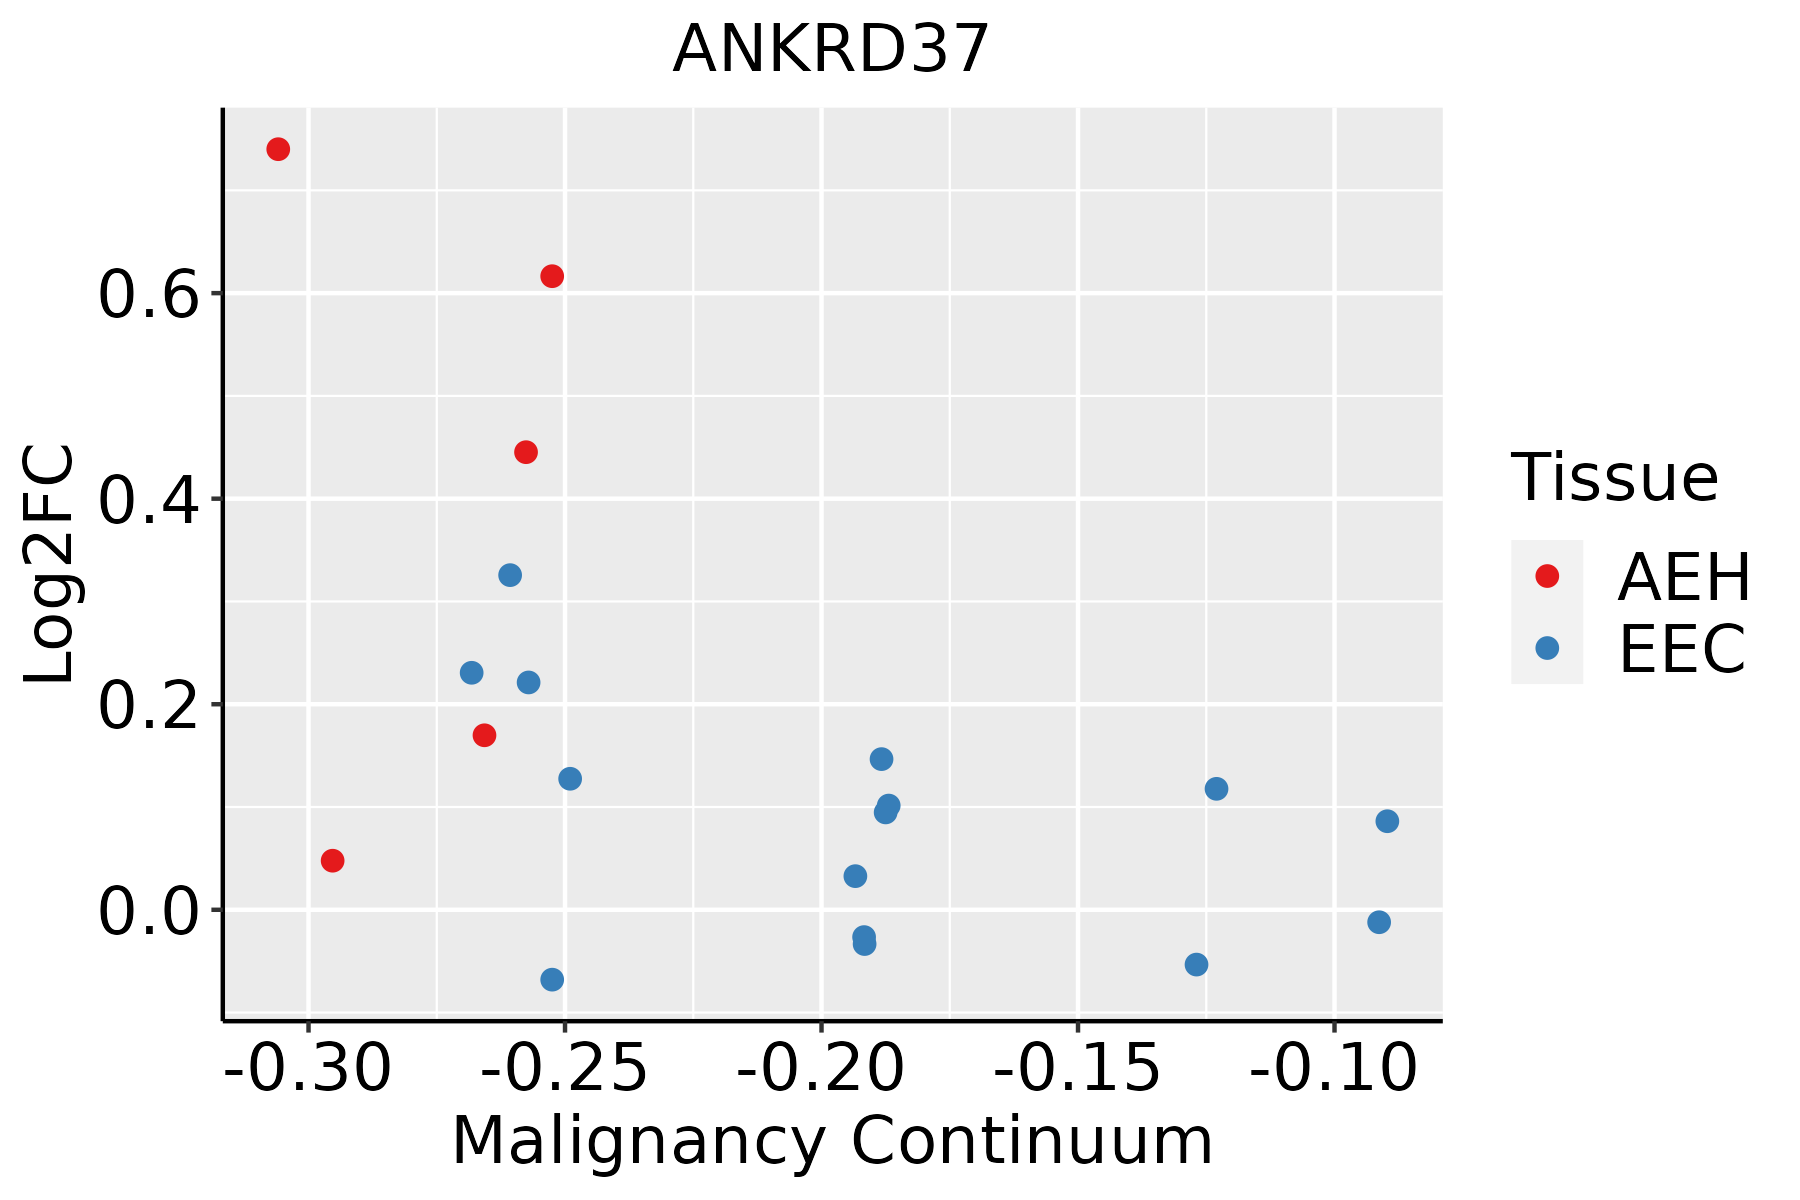 | AEH: Atypical endometrial hyperplasia |
| EEC: Endometrioid Cancer | ||
| Esophagus | 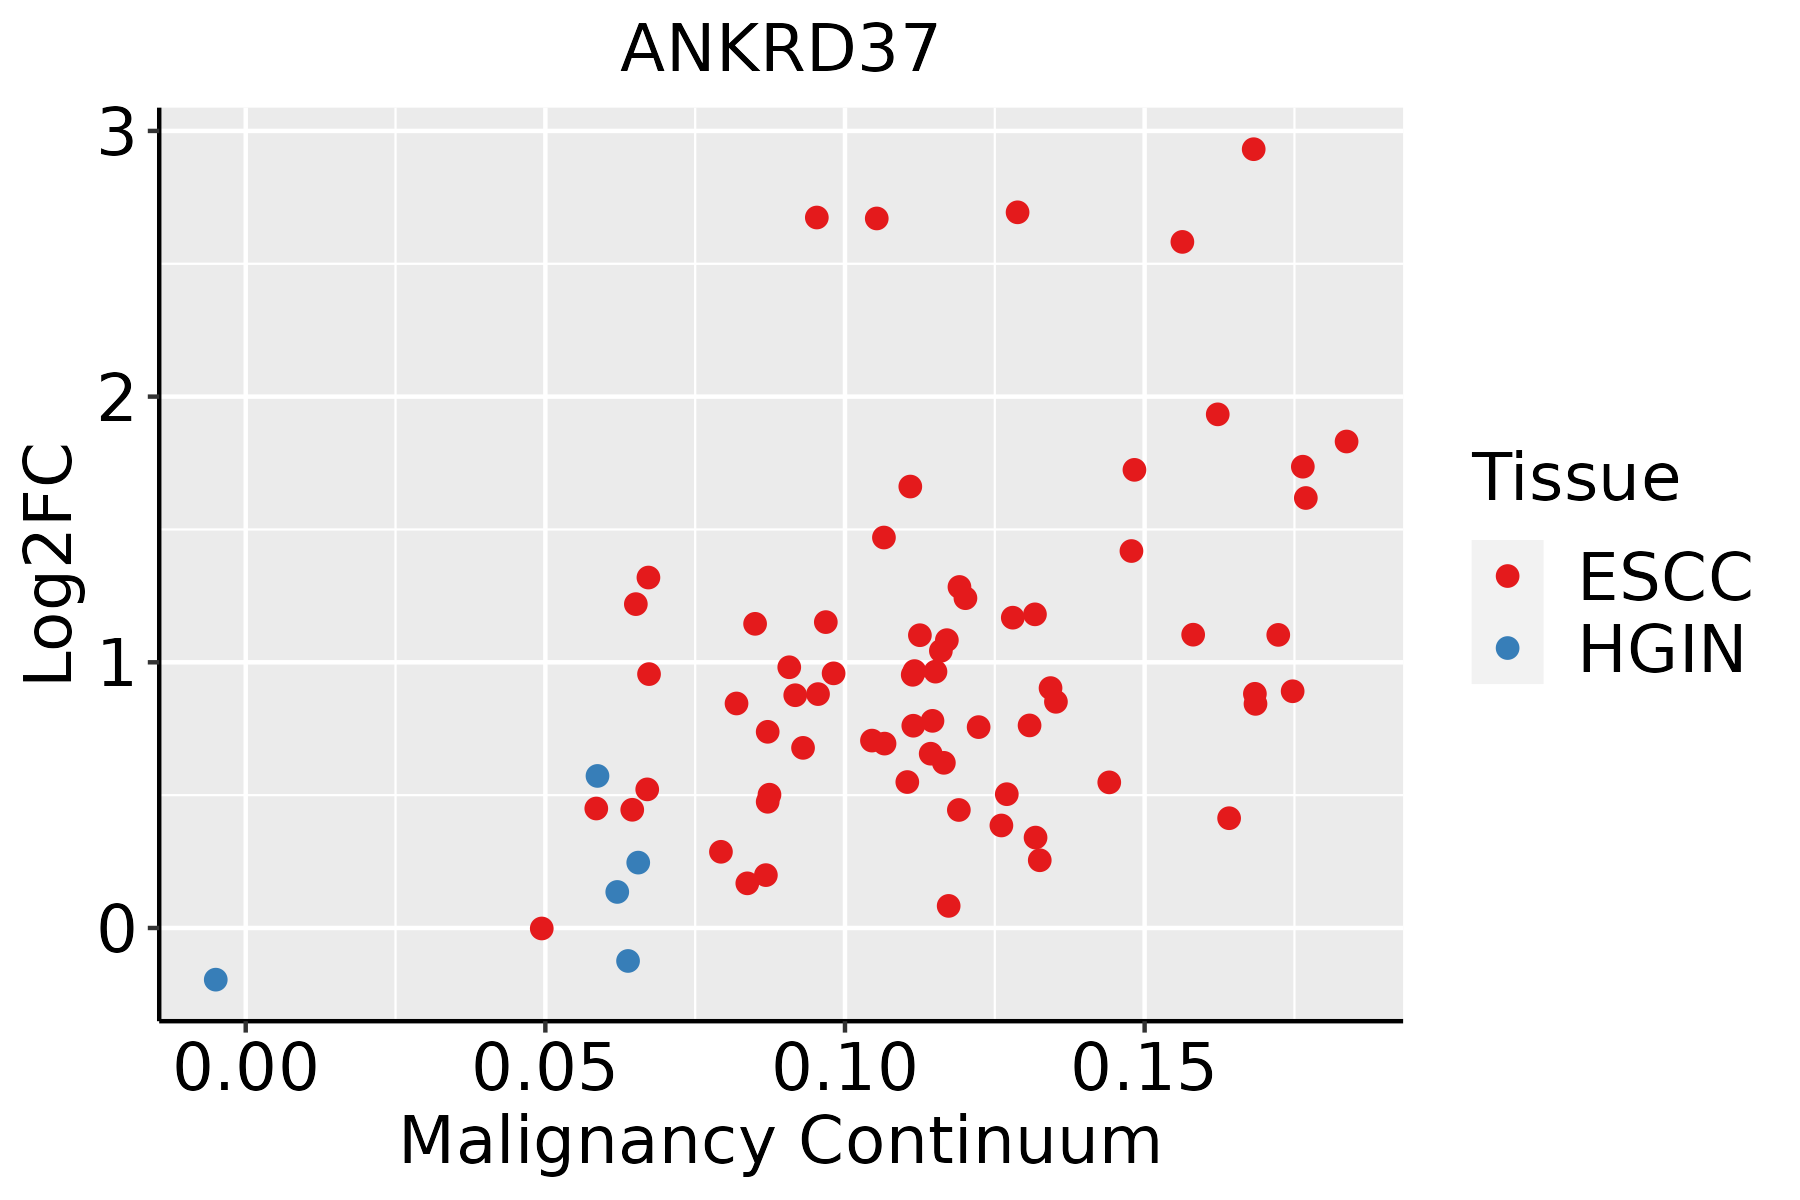 | ESCC: Esophageal squamous cell carcinoma |
| HGIN: High-grade intraepithelial neoplasias | ||
| LGIN: Low-grade intraepithelial neoplasias | ||
| Liver | 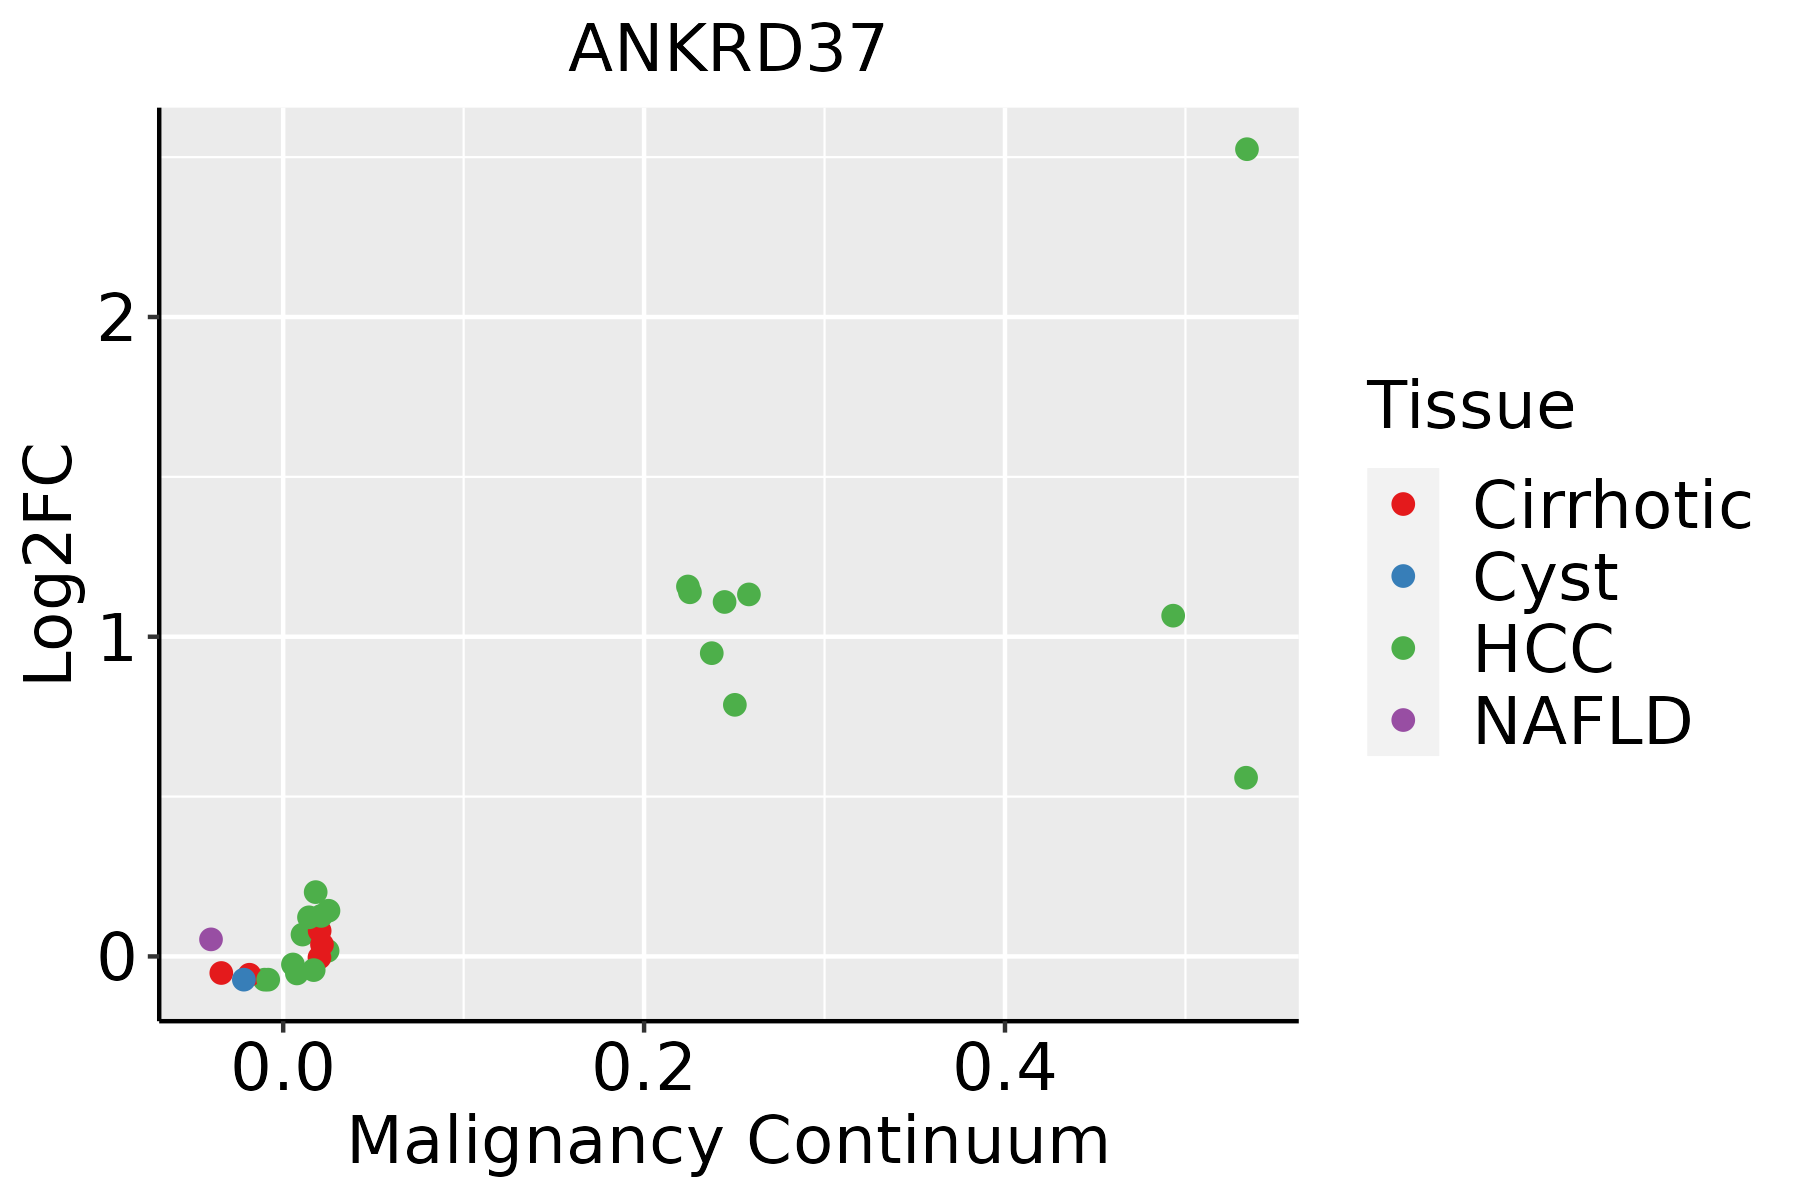 | HCC: Hepatocellular carcinoma |
| NAFLD: Non-alcoholic fatty liver disease | ||
| Lung | 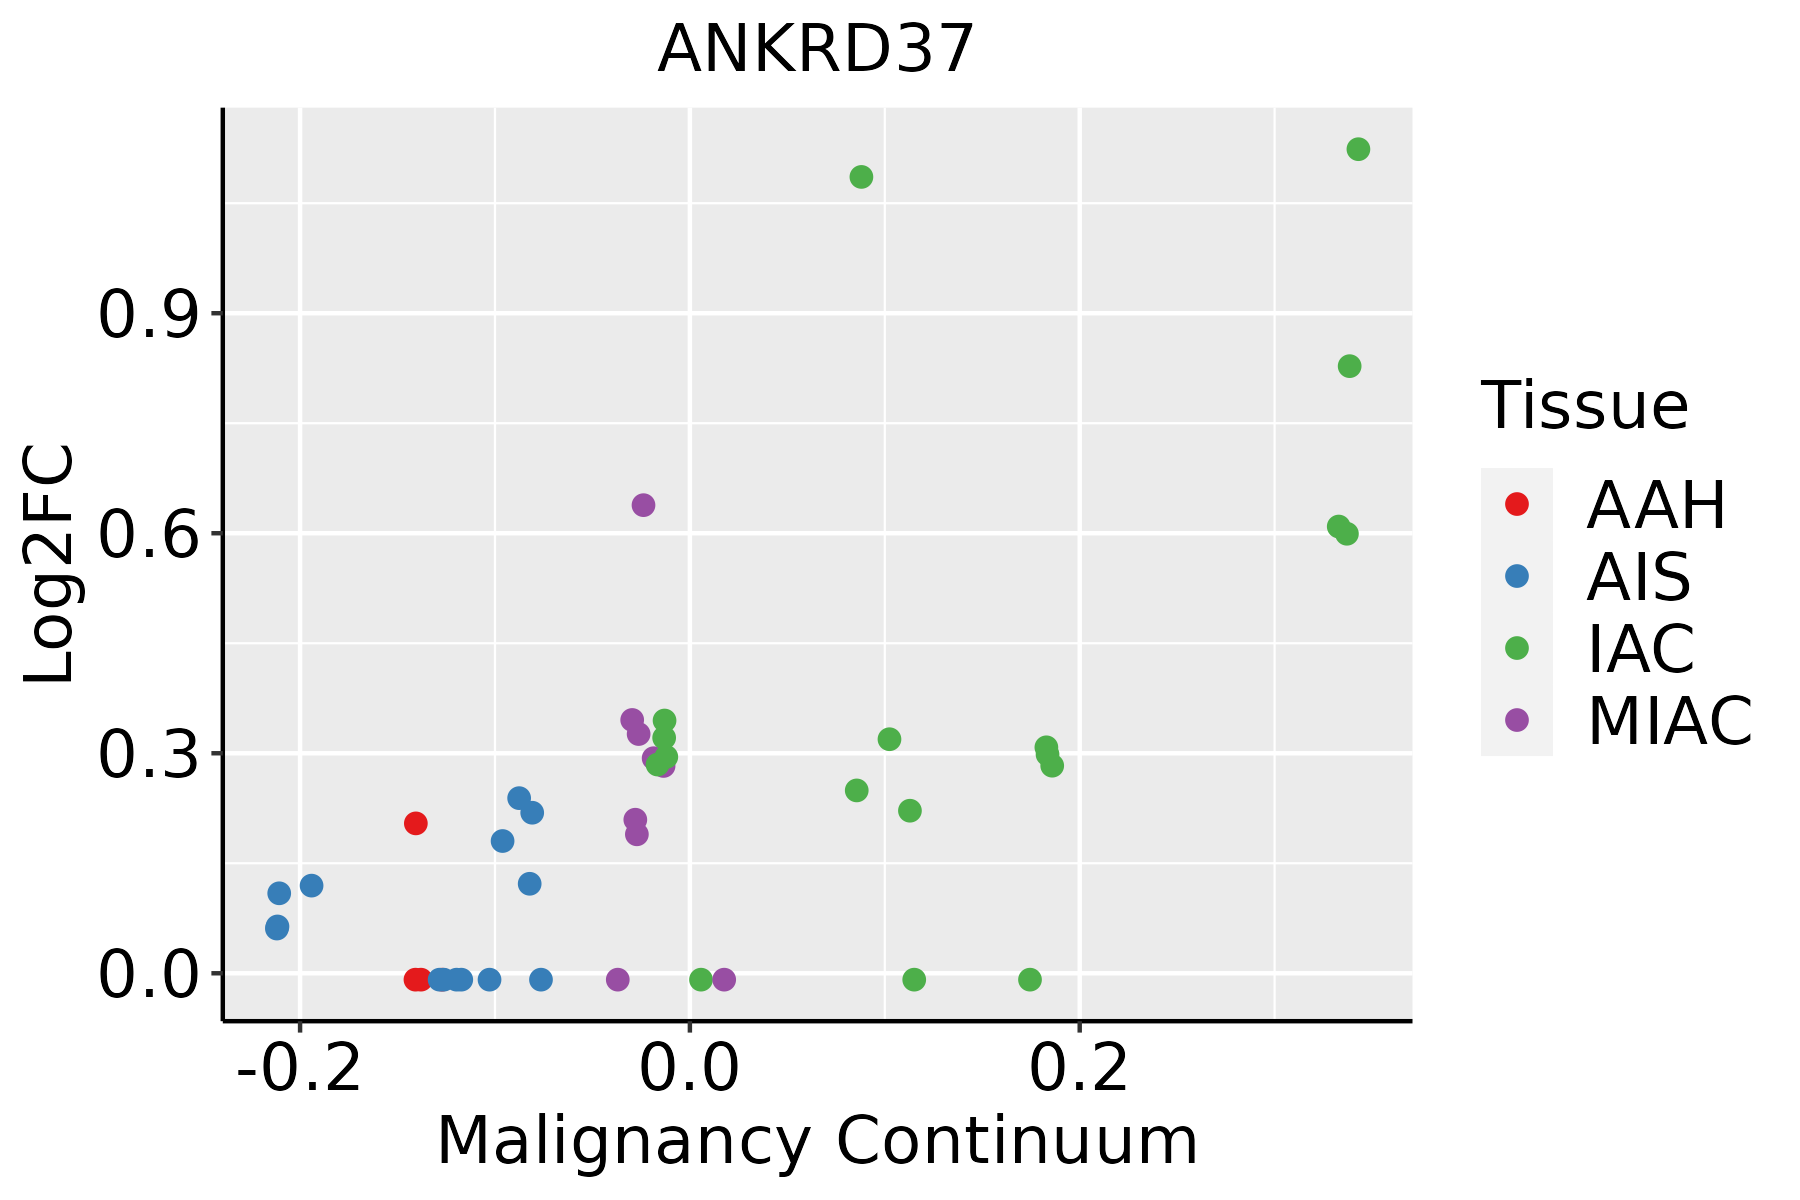 | AAH: Atypical adenomatous hyperplasia |
| AIS: Adenocarcinoma in situ | ||
| IAC: Invasive lung adenocarcinoma | ||
| MIA: Minimally invasive adenocarcinoma | ||
| Oral Cavity | 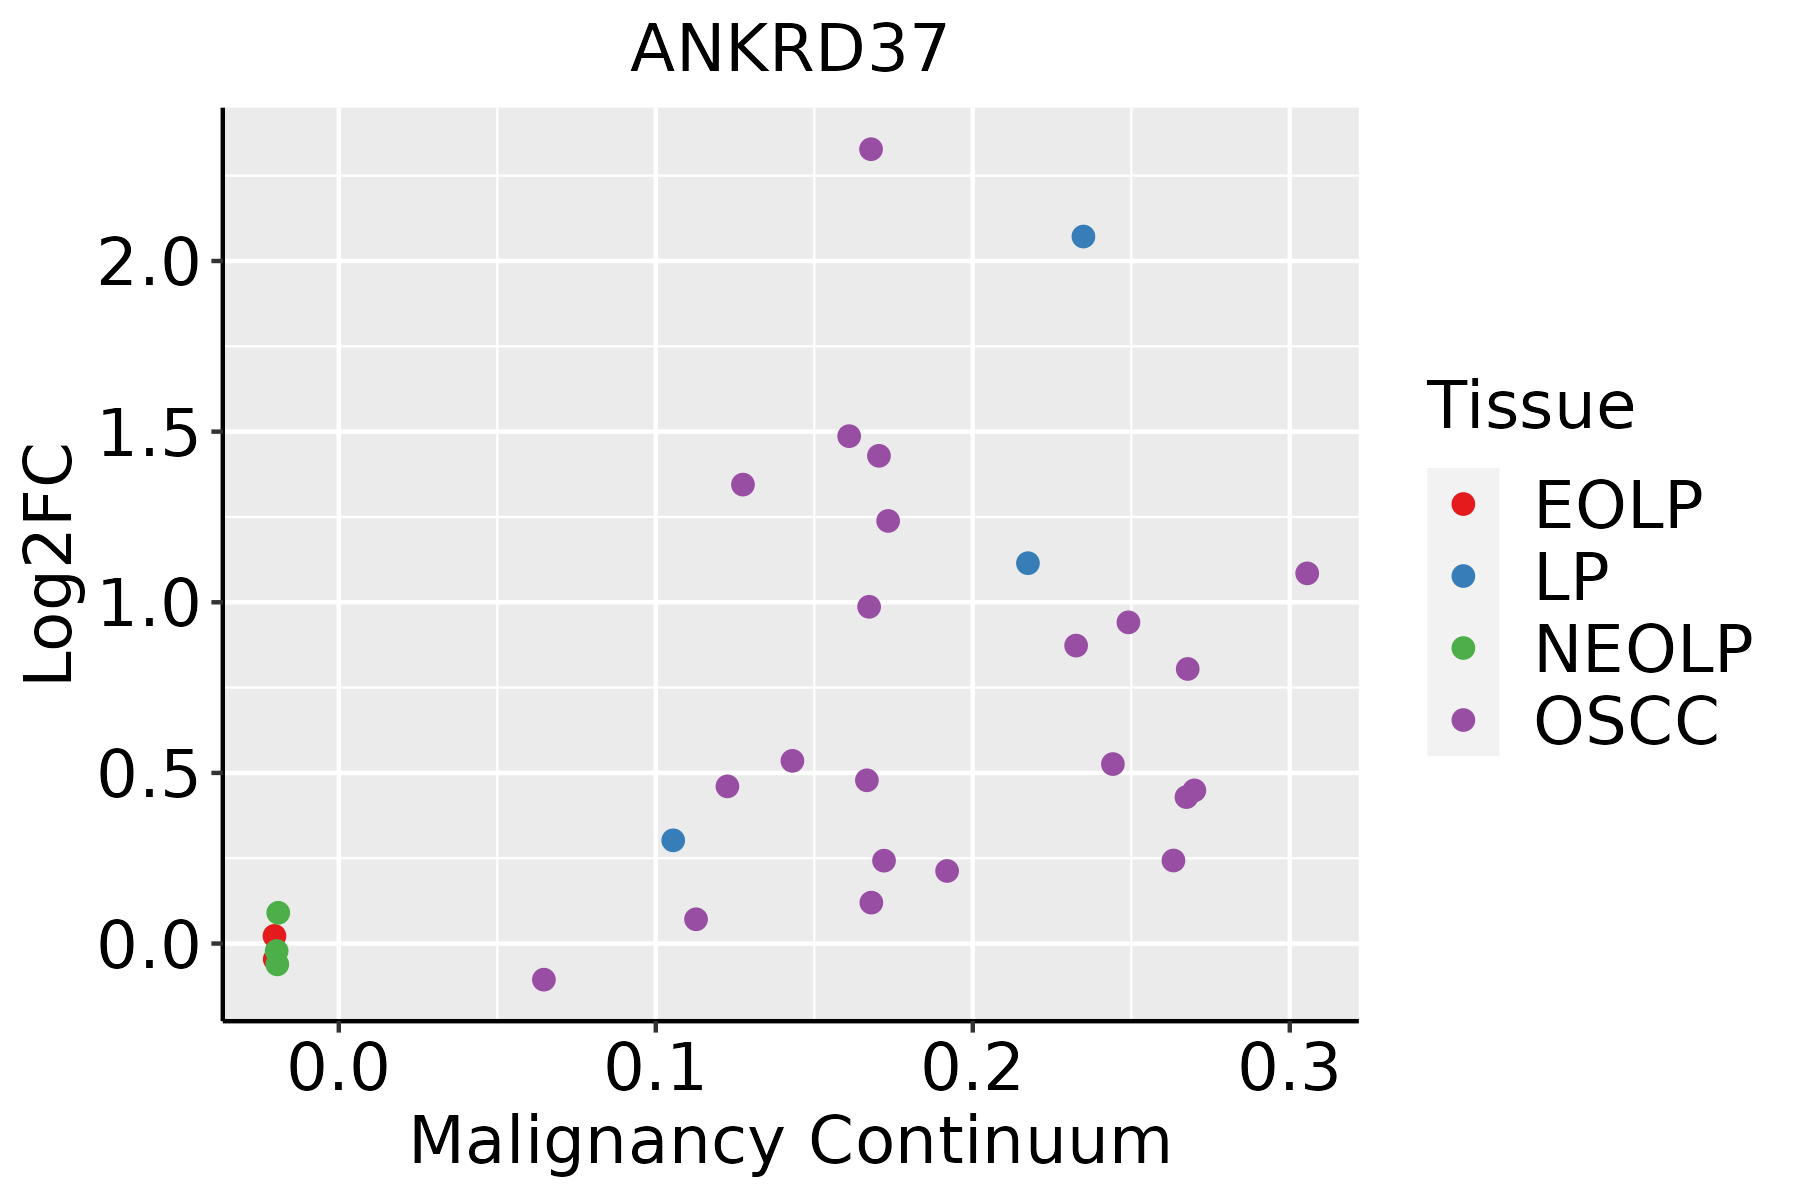 | EOLP: Erosive Oral lichen planus |
| LP: leukoplakia | ||
| NEOLP: Non-erosive oral lichen planus | ||
| OSCC: Oral squamous cell carcinoma | ||
| Prostate | 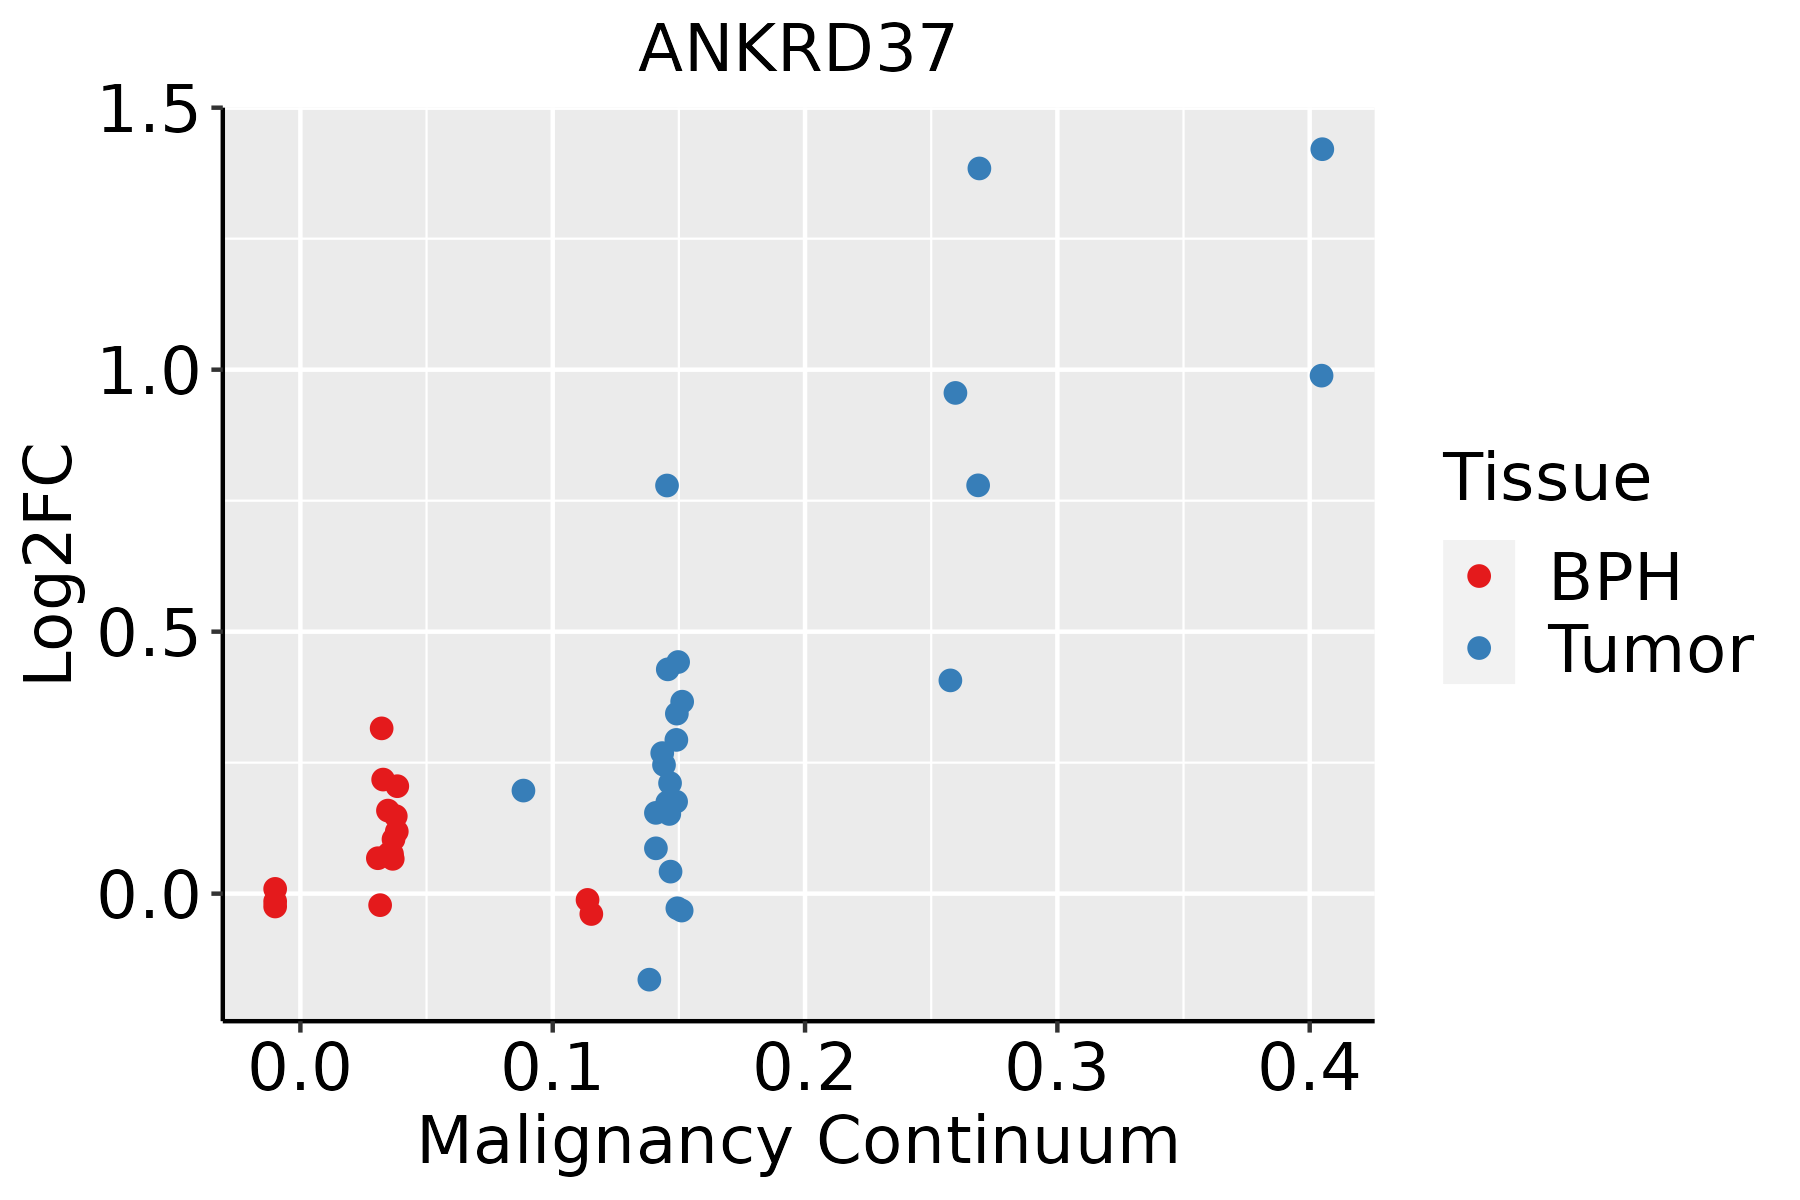 | BPH: Benign Prostatic Hyperplasia |
| Skin | 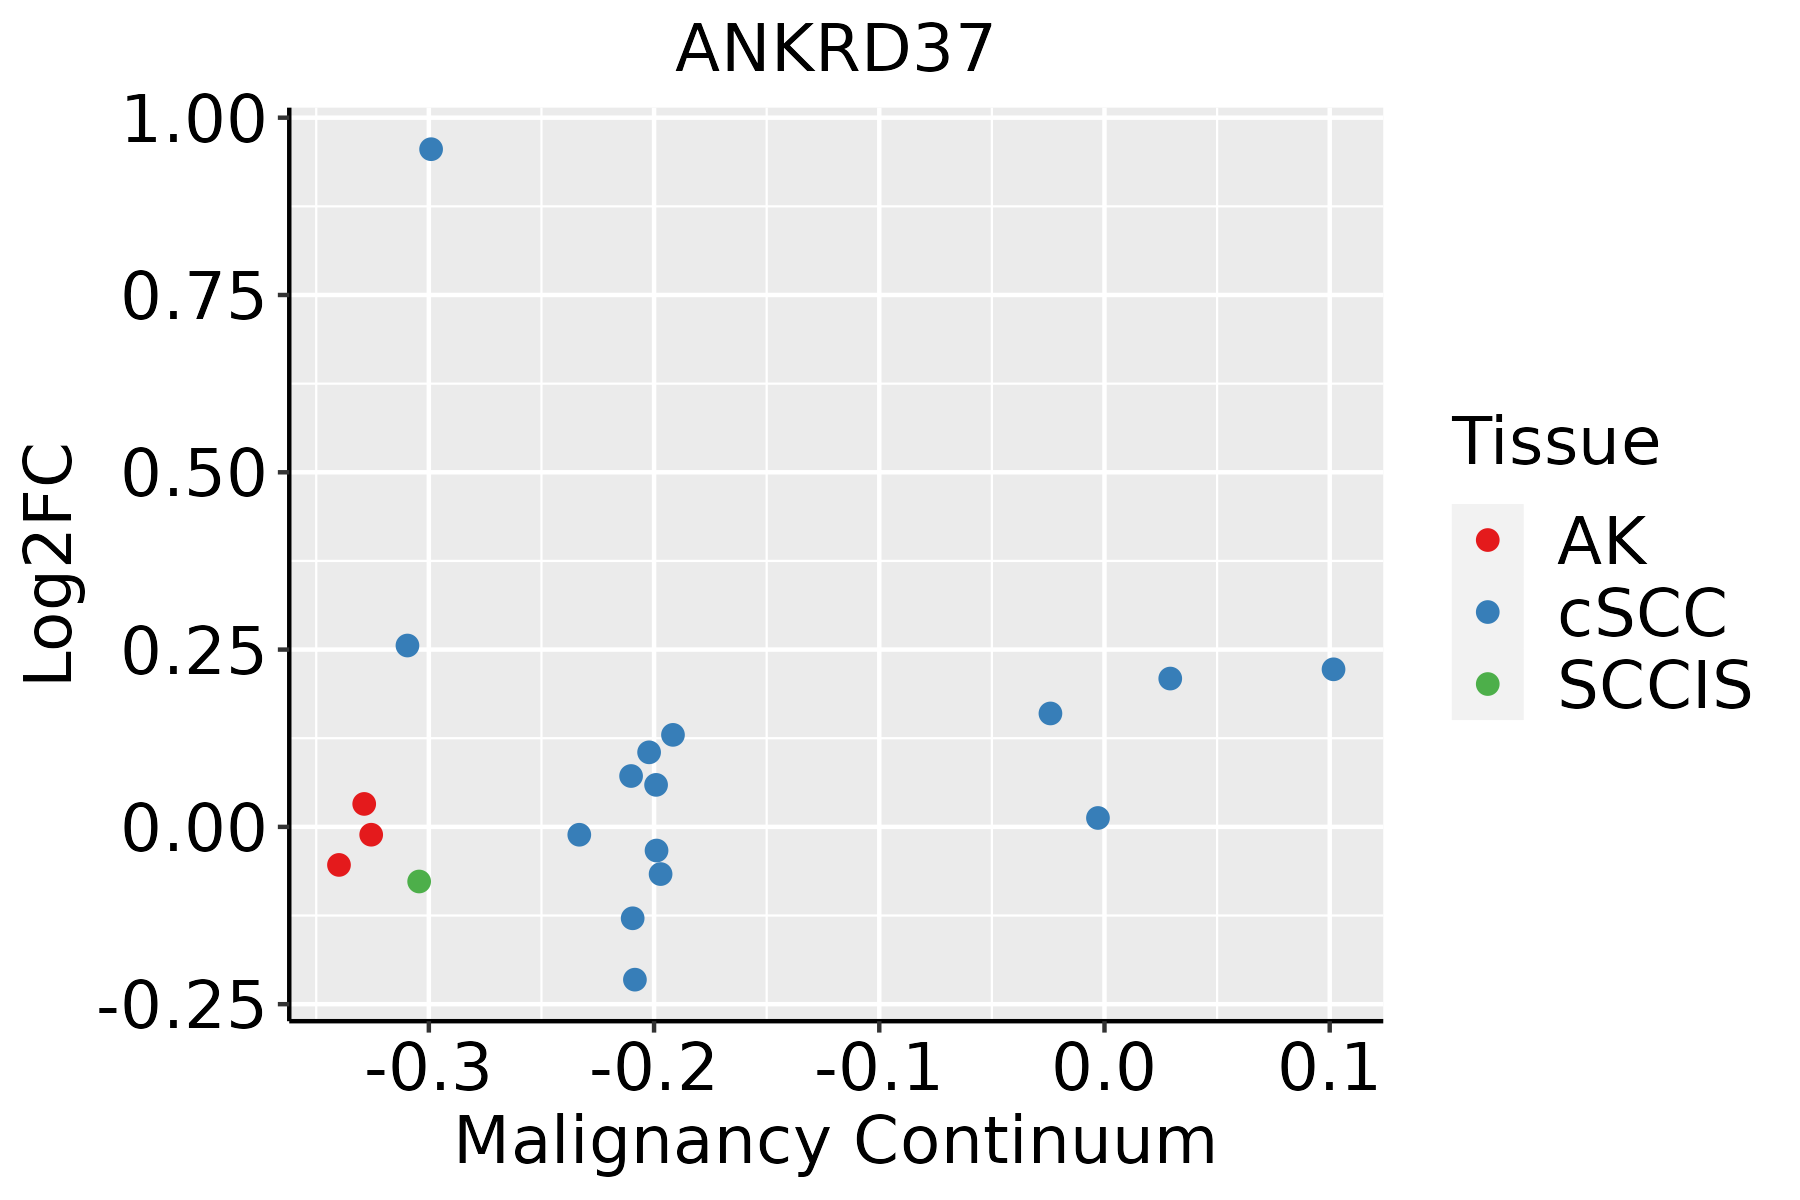 | AK: Actinic keratosis |
| cSCC: Cutaneous squamous cell carcinoma | ||
| SCCIS:squamous cell carcinoma in situ |
| ∗log2FC in expression of this searched gene in stem-like cells from each diseased tissue sample relative to stem-like cells in normal samples in each tissue plotted against the malignancy continuum. Samples are colored based on if they are from different disease stage. |
Top |
Malignant transformation related pathway analysis |
| Find out the enriched GO biological processes and KEGG pathways involved in transition from healthy to precancer to cancer |
| Tissue | Disease Stage | Enriched GO biological Processes |
| Colorectum | AD |  |
| Colorectum | SER |  |
| Colorectum | MSS |  |
| Colorectum | MSI-H |  |
| Colorectum | FAP |  |
| ∗Top 15 enriched GO BP terms are showed in the bar plot of each disease state in each tissue. Each row represents a significant GO biological process which is colored according to the -log10(p.adjust). |
| Page: 1 2 3 4 5 6 7 8 9 |
| GO ID | Tissue | Disease Stage | Description | Gene Ratio | Bg Ratio | pvalue | p.adjust | Count |
| Page: 1 |
| Pathway ID | Tissue | Disease Stage | Description | Gene Ratio | Bg Ratio | pvalue | p.adjust | qvalue | Count |
| Page: 1 |
Top |
Cell-cell communication analysis |
| Identification of potential cell-cell interactions between two cell types and their ligand-receptor pairs for different disease states |
| Ligand | Receptor | LRpair | Pathway | Tissue | Disease Stage |
| Page: 1 |
Top |
Single-cell gene regulatory network inference analysis |
| Find out the significant the regulons (TFs) and the target genes of each regulon across cell types for different disease states |
| TF | Cell Type | Tissue | Disease Stage | Target Gene | RSS | Regulon Activity |
| ∗The dot plots of a searched regulon are shown for all cell subpopulations in each disease state of each tissue based on the regulon specific score inferred using pySCENIC and by calculating the average expression. |
| Page: 1 |
Top |
Somatic mutation of malignant transformation related genes |
| Annotation of somatic variants for genes involved in malignant transformation |
| Hugo Symbol | Variant Class | Variant Classification | dbSNP RS | HGVSc | HGVSp | HGVSp Short | SWISSPROT | BIOTYPE | SIFT | PolyPhen | Tumor Sample Barcode | Tissue | Histology | Sex | Age | Stage | Therapy Types | Drugs | Outcome |
| ANKRD37 | SNV | Missense_Mutation | c.25N>A | p.Glu9Lys | p.E9K | Q7Z713 | protein_coding | tolerated(0.08) | possibly_damaging(0.812) | TCGA-D8-A1XB-01 | Breast | breast invasive carcinoma | Female | <65 | I/II | Unknown | Unknown | SD | |
| ANKRD37 | deletion | Frame_Shift_Del | novel | c.216delN | p.Val74LeufsTer7 | p.V74Lfs*7 | Q7Z713 | protein_coding | TCGA-EW-A2FV-01 | Breast | breast invasive carcinoma | Female | <65 | III/IV | Chemotherapy | docetaxel | SD | ||
| ANKRD37 | SNV | Missense_Mutation | c.304N>A | p.Asp102Asn | p.D102N | Q7Z713 | protein_coding | deleterious(0.02) | probably_damaging(0.994) | TCGA-BI-A20A-01 | Cervix | cervical & endocervical cancer | Female | <65 | I/II | Unknown | Unknown | SD | |
| ANKRD37 | SNV | Missense_Mutation | rs761152223 | c.301G>A | p.Glu101Lys | p.E101K | Q7Z713 | protein_coding | deleterious(0.05) | probably_damaging(0.999) | TCGA-HM-A4S6-01 | Cervix | cervical & endocervical cancer | Female | <65 | III/IV | Chemotherapy | cisplatin | CR |
| ANKRD37 | SNV | Missense_Mutation | c.182A>G | p.Asp61Gly | p.D61G | Q7Z713 | protein_coding | deleterious(0) | possibly_damaging(0.695) | TCGA-CK-6746-01 | Colorectum | colon adenocarcinoma | Female | >=65 | I/II | Unknown | Unknown | SD | |
| ANKRD37 | SNV | Missense_Mutation | rs772390105 | c.364A>G | p.Met122Val | p.M122V | Q7Z713 | protein_coding | tolerated(0.31) | benign(0.006) | TCGA-AX-A2HD-01 | Endometrium | uterine corpus endometrioid carcinoma | Female | >=65 | III/IV | Unknown | Unknown | SD |
| ANKRD37 | SNV | Missense_Mutation | c.238C>A | p.Leu80Ile | p.L80I | Q7Z713 | protein_coding | tolerated(0.58) | probably_damaging(0.945) | TCGA-B5-A11E-01 | Endometrium | uterine corpus endometrioid carcinoma | Female | <65 | I/II | Unknown | Unknown | SD | |
| ANKRD37 | SNV | Missense_Mutation | c.467N>T | p.Arg156Met | p.R156M | Q7Z713 | protein_coding | deleterious(0) | probably_damaging(0.936) | TCGA-BS-A0UV-01 | Endometrium | uterine corpus endometrioid carcinoma | Female | <65 | III/IV | Unknown | Unknown | SD | |
| ANKRD37 | SNV | Missense_Mutation | novel | c.346C>A | p.Leu116Ile | p.L116I | Q7Z713 | protein_coding | deleterious(0.03) | probably_damaging(0.998) | TCGA-E6-A1LX-01 | Endometrium | uterine corpus endometrioid carcinoma | Female | <65 | I/II | Unknown | Unknown | SD |
| ANKRD37 | SNV | Missense_Mutation | novel | c.346C>T | p.Leu116Phe | p.L116F | Q7Z713 | protein_coding | deleterious(0) | probably_damaging(0.999) | TCGA-EO-A22U-01 | Endometrium | uterine corpus endometrioid carcinoma | Female | >=65 | I/II | Unknown | Unknown | SD |
| Page: 1 2 |
Top |
Related drugs of malignant transformation related genes |
| Identification of chemicals and drugs interact with genes involved in malignant transfromation |
| (DGIdb 4.0) |
| Entrez ID | Symbol | Category | Interaction Types | Drug Claim Name | Drug Name | PMIDs |
| Page: 1 |

Copyright 2023-Present -The University of Texas Health Science Center at Houston |