
|
|||||
|
 | |
| |
| |
| |
| |
| |
|
Gene: ANKRD36C |
Gene summary for ANKRD36C |
| Gene information | Species | Human | Gene symbol | ANKRD36C | Gene ID | 400986 |
| Gene name | ankyrin repeat domain 36C | |
| Gene Alias | ANKRD36C | |
| Cytomap | 2q11.1 | |
| Gene Type | protein-coding | GO ID | GO:0003674 | UniProtAcc | NA |
Top |
Malignant transformation analysis |
| Identification of the aberrant gene expression in precancerous and cancerous lesions by comparing the gene expression of stem-like cells in diseased tissues with normal stem cells |
| Entrez ID | Symbol | Replicates | Species | Organ | Tissue | Adj P-value | Log2FC | Malignancy |
| 400986 | ANKRD36C | GSM4909280 | Human | Breast | Precancer | 7.09e-03 | 1.69e-01 | 0.0305 |
| 400986 | ANKRD36C | GSM4909281 | Human | Breast | IDC | 1.94e-21 | -5.08e-01 | 0.21 |
| 400986 | ANKRD36C | GSM4909282 | Human | Breast | IDC | 7.92e-15 | -4.99e-01 | -0.0288 |
| 400986 | ANKRD36C | GSM4909286 | Human | Breast | IDC | 6.92e-08 | -3.72e-01 | 0.1081 |
| 400986 | ANKRD36C | GSM4909287 | Human | Breast | IDC | 2.15e-03 | -3.36e-01 | 0.2057 |
| 400986 | ANKRD36C | GSM4909288 | Human | Breast | IDC | 1.61e-03 | -5.01e-01 | 0.0988 |
| 400986 | ANKRD36C | GSM4909291 | Human | Breast | IDC | 3.90e-08 | -4.91e-01 | 0.1753 |
| 400986 | ANKRD36C | GSM4909293 | Human | Breast | IDC | 2.54e-15 | -4.25e-01 | 0.1581 |
| 400986 | ANKRD36C | GSM4909294 | Human | Breast | IDC | 7.44e-23 | -5.16e-01 | 0.2022 |
| 400986 | ANKRD36C | GSM4909296 | Human | Breast | IDC | 4.76e-24 | -4.89e-01 | 0.1524 |
| 400986 | ANKRD36C | GSM4909297 | Human | Breast | IDC | 1.03e-21 | -5.15e-01 | 0.1517 |
| 400986 | ANKRD36C | GSM4909298 | Human | Breast | IDC | 1.22e-07 | -3.46e-01 | 0.1551 |
| 400986 | ANKRD36C | GSM4909301 | Human | Breast | IDC | 5.54e-17 | -4.76e-01 | 0.1577 |
| 400986 | ANKRD36C | GSM4909302 | Human | Breast | IDC | 4.05e-13 | -4.33e-01 | 0.1545 |
| 400986 | ANKRD36C | GSM4909303 | Human | Breast | IDC | 5.63e-03 | -4.87e-01 | 0.0438 |
| 400986 | ANKRD36C | GSM4909304 | Human | Breast | IDC | 2.26e-25 | -5.35e-01 | 0.1636 |
| 400986 | ANKRD36C | GSM4909306 | Human | Breast | IDC | 3.48e-13 | -4.70e-01 | 0.1564 |
| 400986 | ANKRD36C | GSM4909307 | Human | Breast | IDC | 2.21e-16 | -4.72e-01 | 0.1569 |
| 400986 | ANKRD36C | GSM4909308 | Human | Breast | IDC | 7.32e-13 | -4.93e-01 | 0.158 |
| 400986 | ANKRD36C | GSM4909309 | Human | Breast | IDC | 8.68e-05 | -3.58e-01 | 0.0483 |
| Page: 1 2 3 4 5 6 7 8 9 10 |
| Tissue | Expression Dynamics | Abbreviation |
| Breast |  | IDC: Invasive ductal carcinoma |
| DCIS: Ductal carcinoma in situ | ||
| Precancer(BRCA1-mut): Precancerous lesion from BRCA1 mutation carriers | ||
| Colorectum (GSE201348) |  | FAP: Familial adenomatous polyposis |
| CRC: Colorectal cancer | ||
| Colorectum (HTA11) | 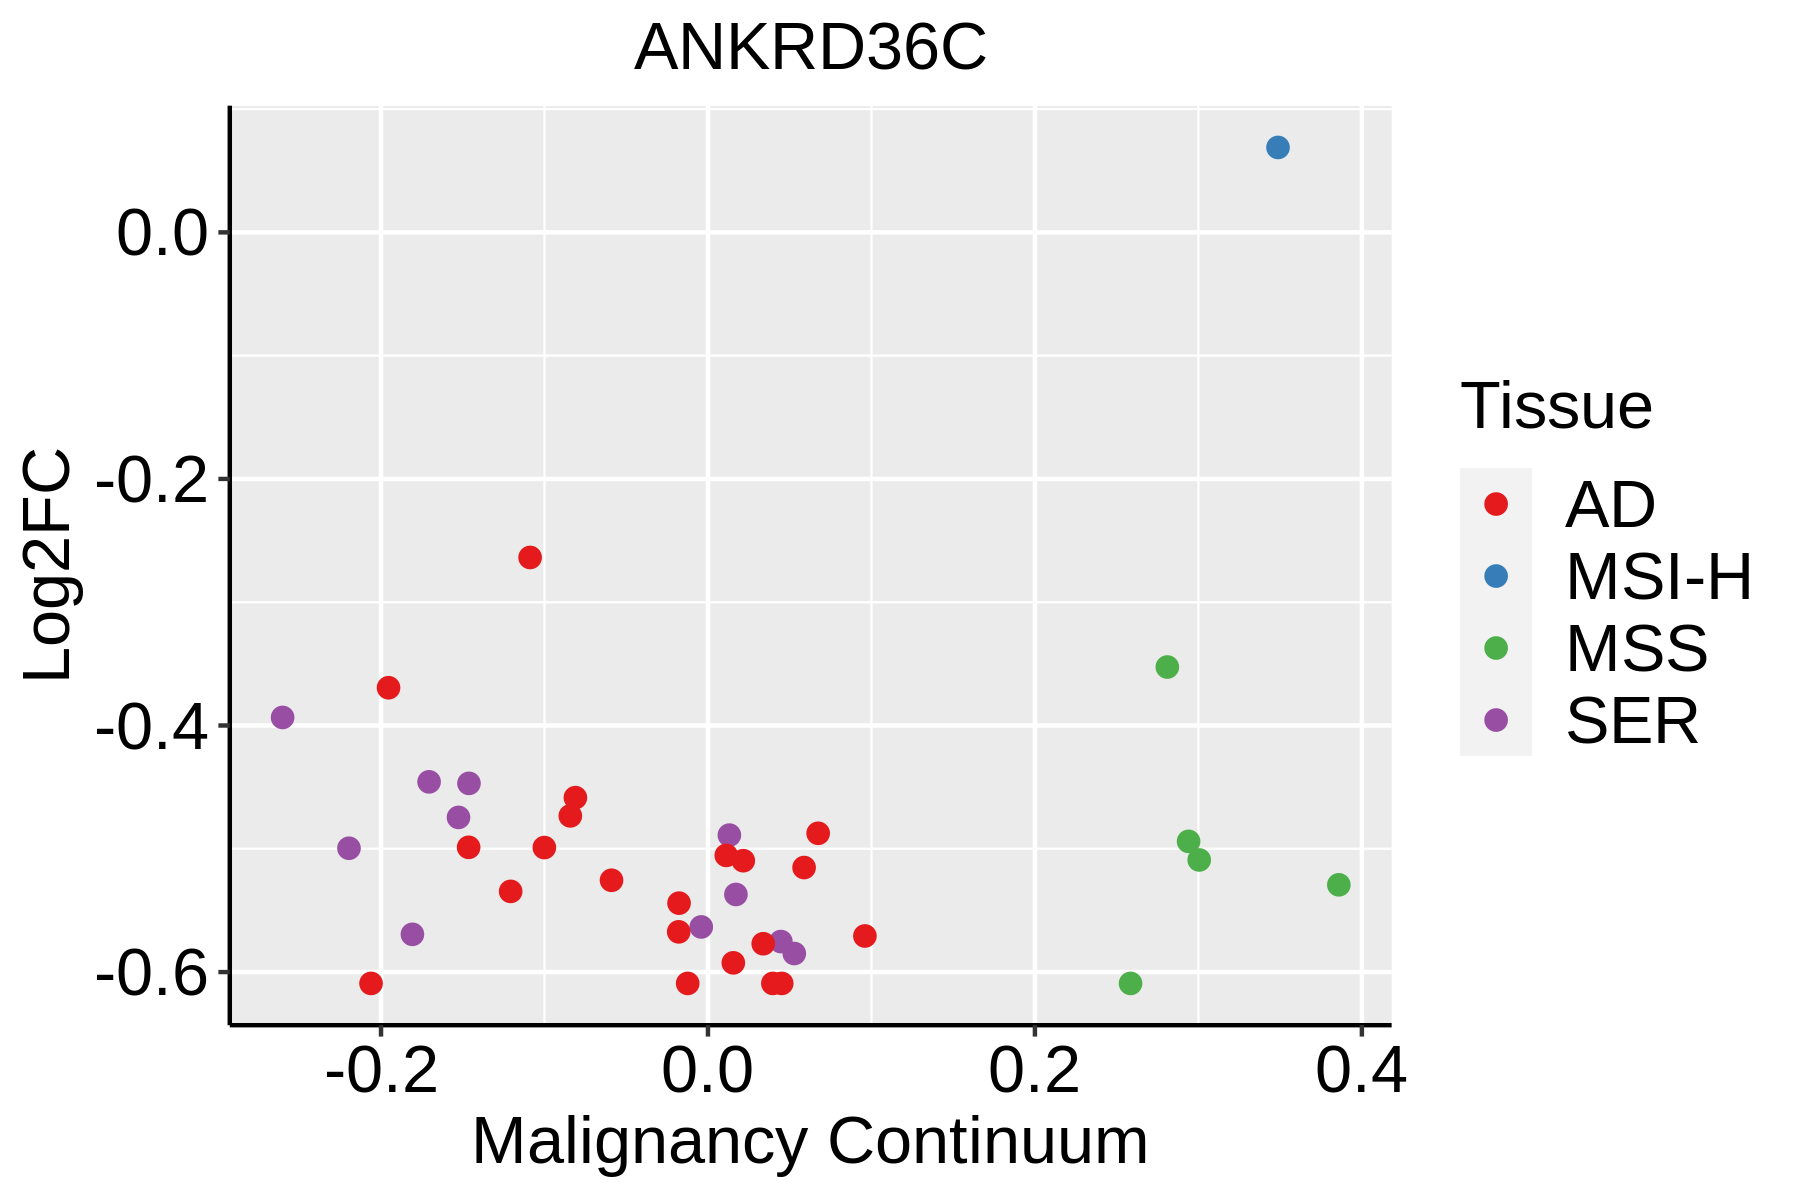 | AD: Adenomas |
| SER: Sessile serrated lesions | ||
| MSI-H: Microsatellite-high colorectal cancer | ||
| MSS: Microsatellite stable colorectal cancer | ||
| Esophagus | 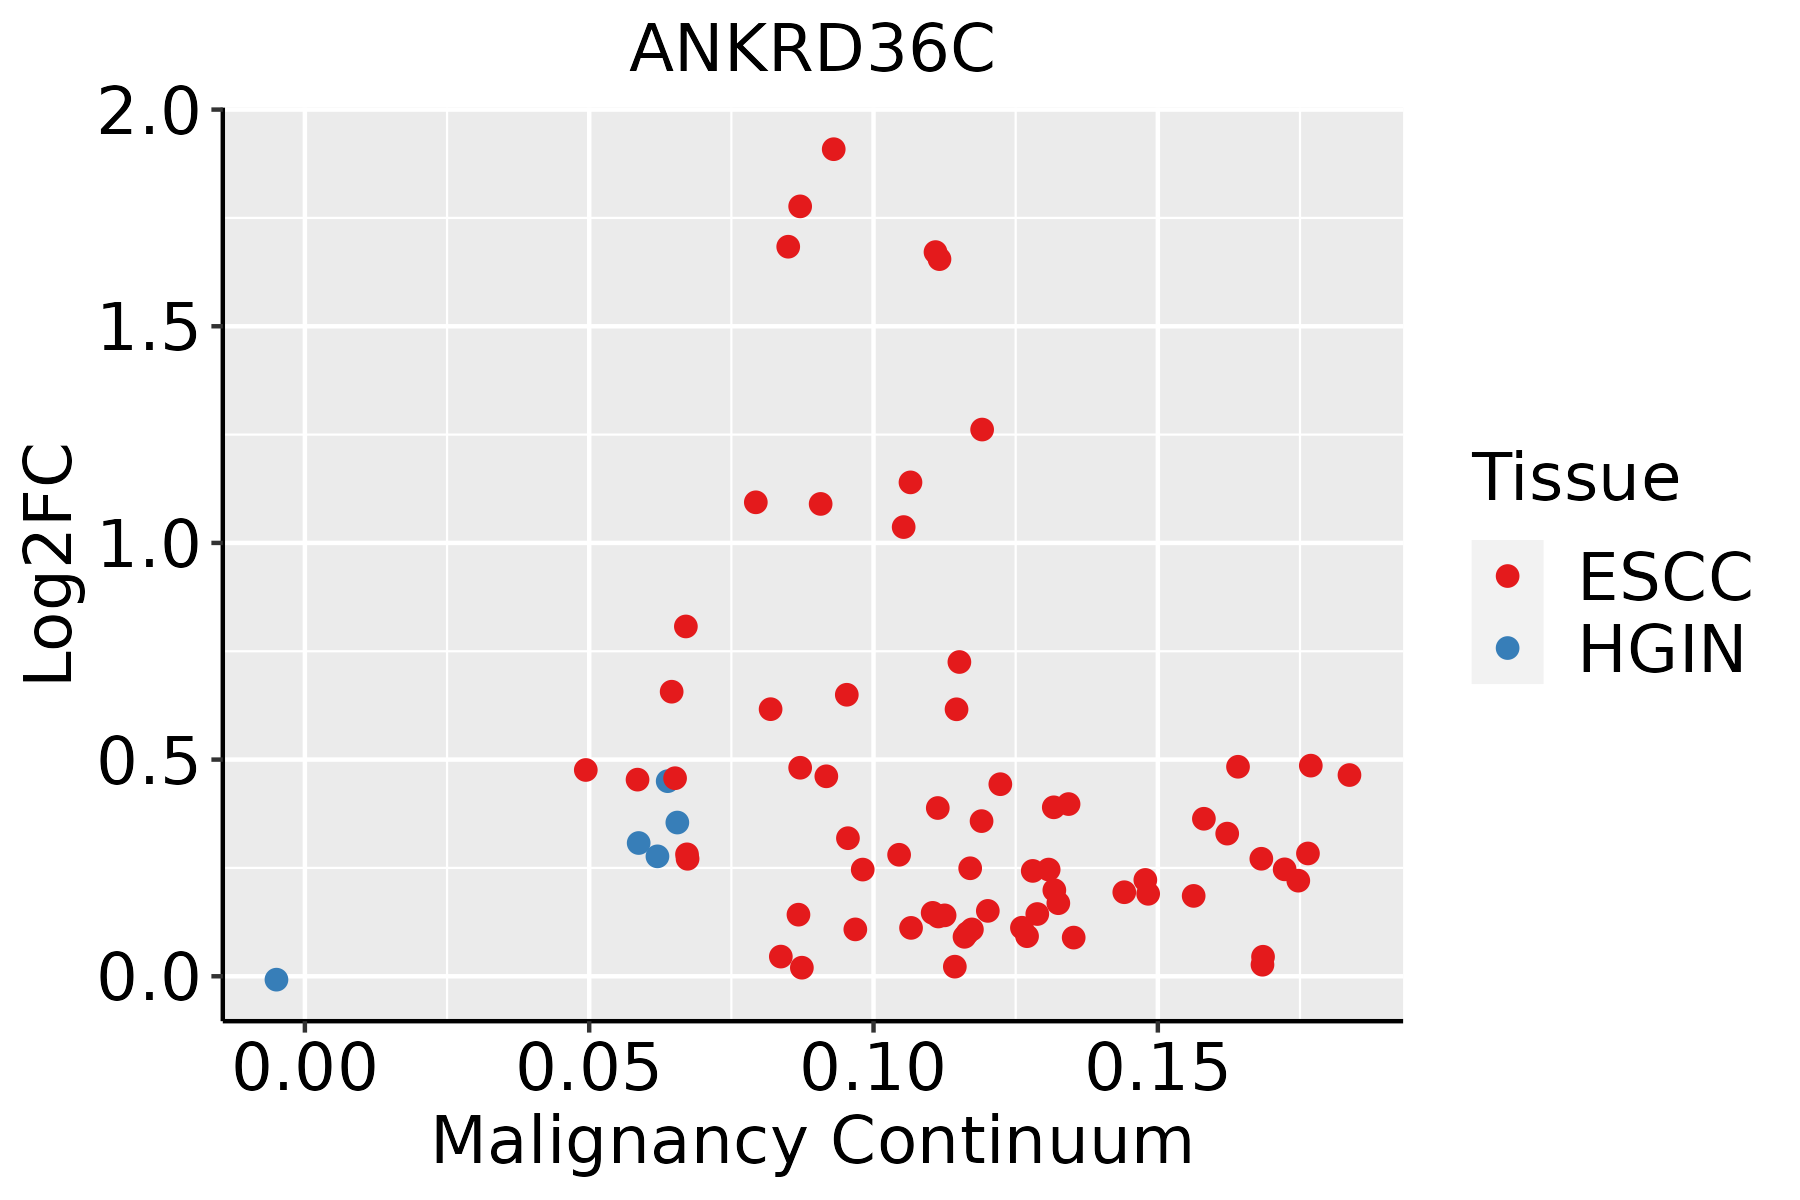 | ESCC: Esophageal squamous cell carcinoma |
| HGIN: High-grade intraepithelial neoplasias | ||
| LGIN: Low-grade intraepithelial neoplasias | ||
| GC |  | CAG: Chronic atrophic gastritis |
| CAG with IM: Chronic atrophic gastritis with intestinal metaplasia | ||
| CSG: Chronic superficial gastritis | ||
| GC: Gastric cancer | ||
| SIM: Severe intestinal metaplasia | ||
| WIM: Wild intestinal metaplasia | ||
| Liver | 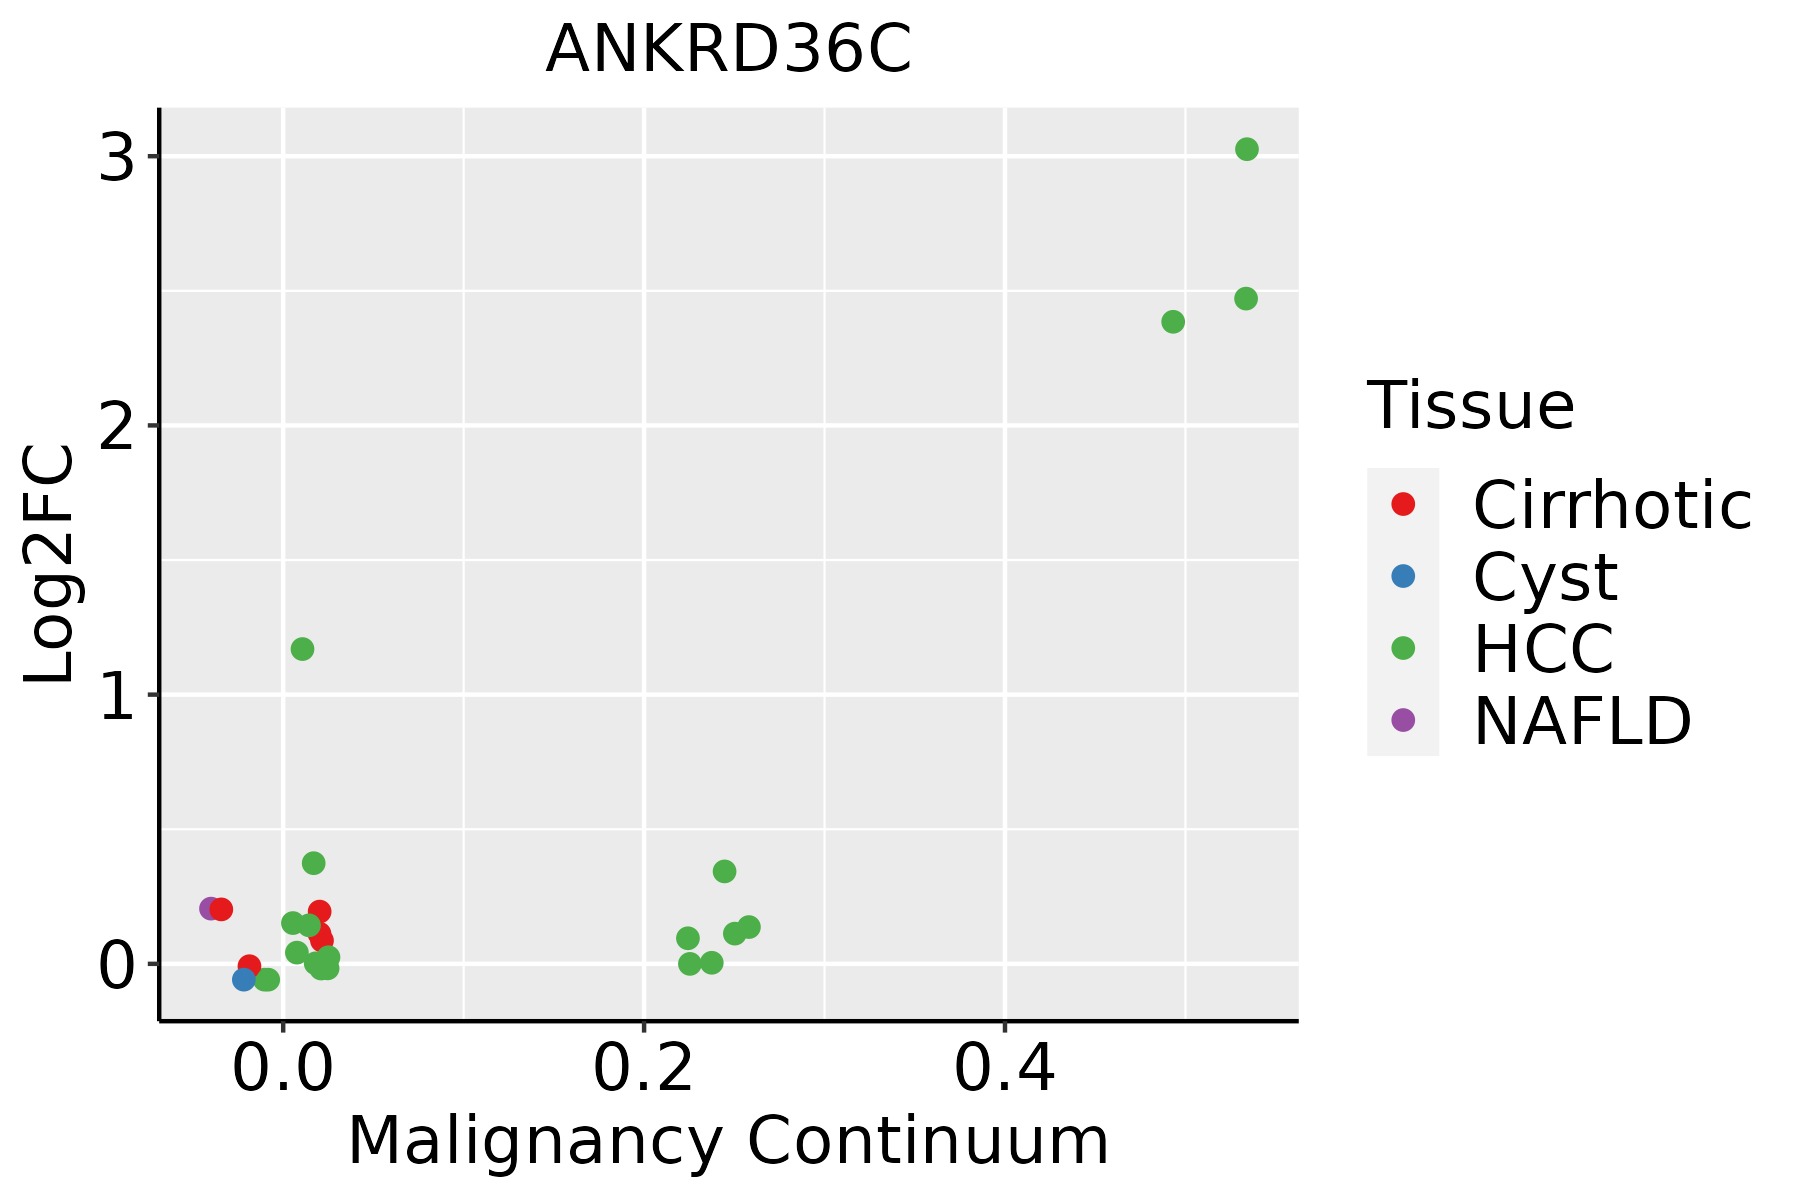 | HCC: Hepatocellular carcinoma |
| NAFLD: Non-alcoholic fatty liver disease | ||
| Lung | 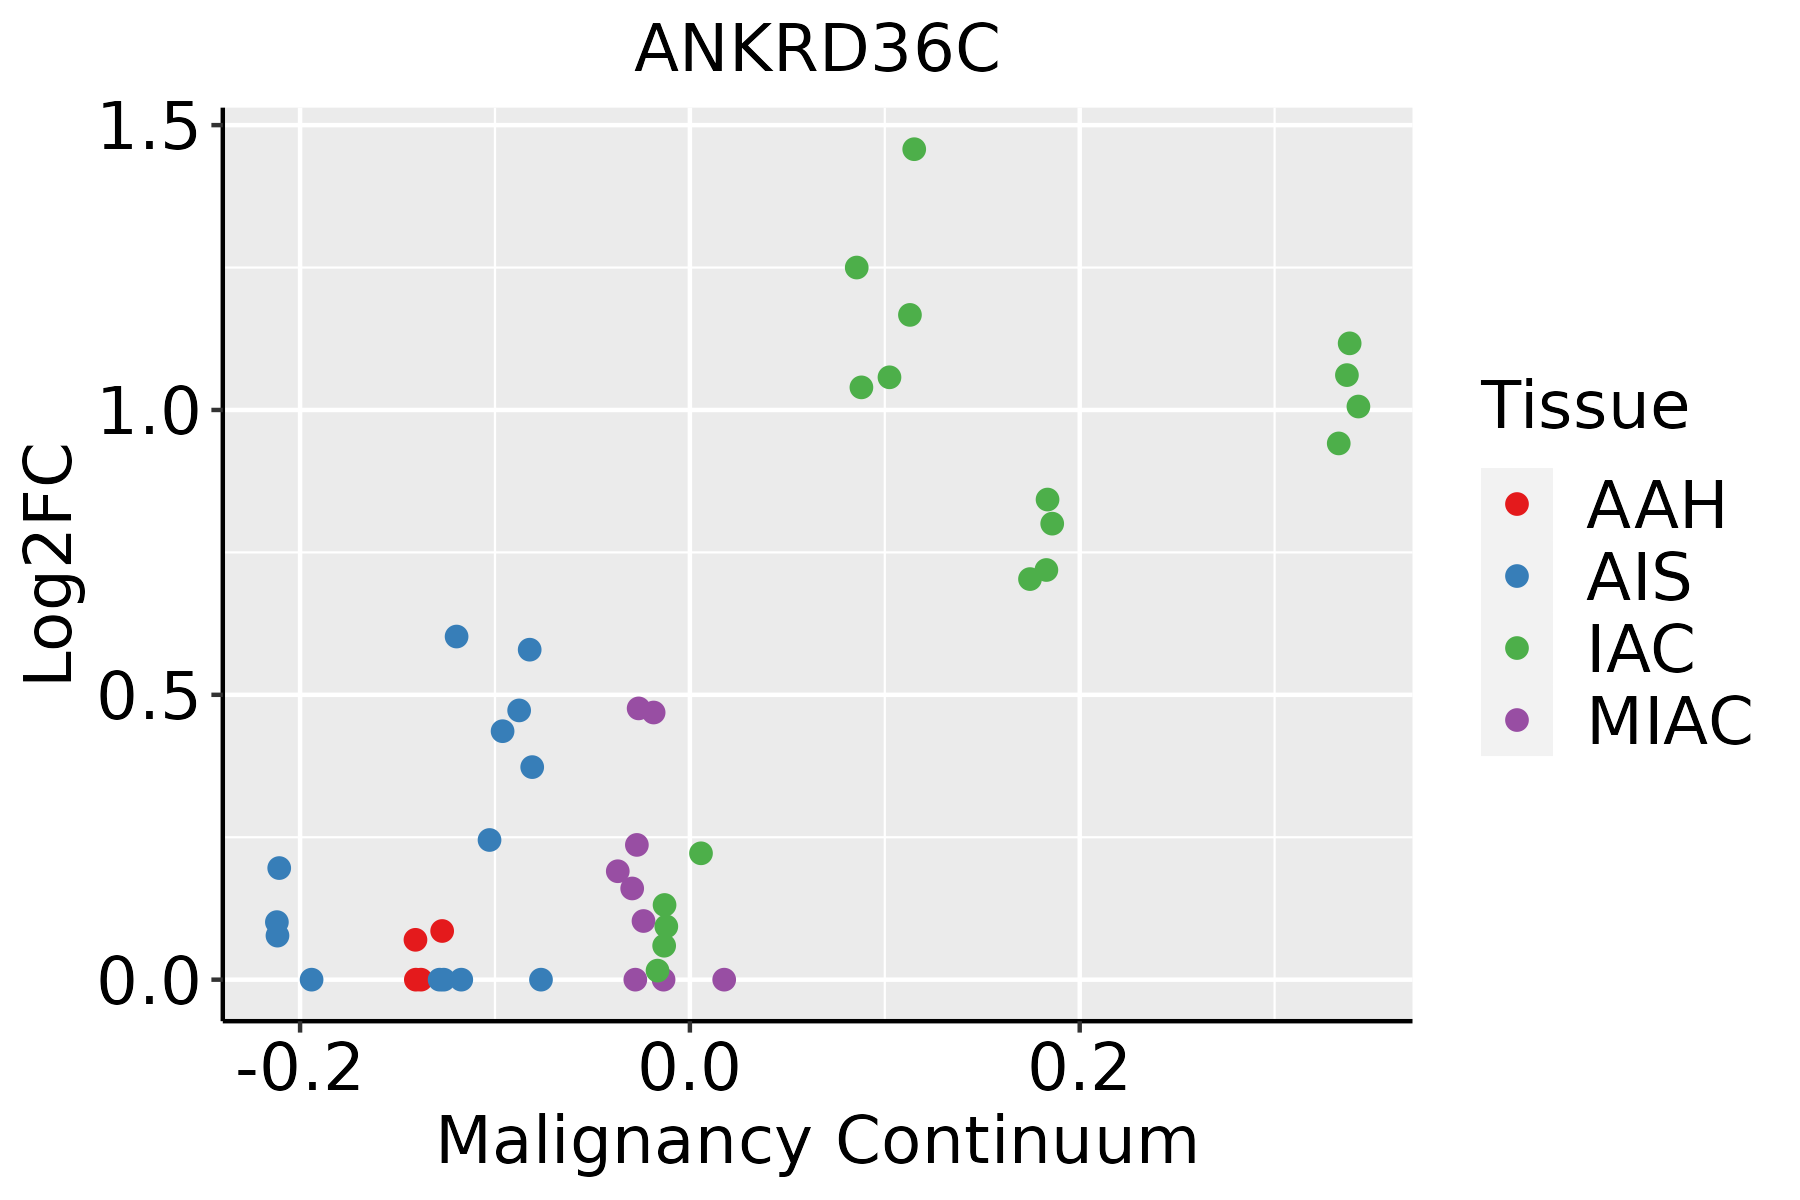 | AAH: Atypical adenomatous hyperplasia |
| AIS: Adenocarcinoma in situ | ||
| IAC: Invasive lung adenocarcinoma | ||
| MIA: Minimally invasive adenocarcinoma | ||
| Oral Cavity | 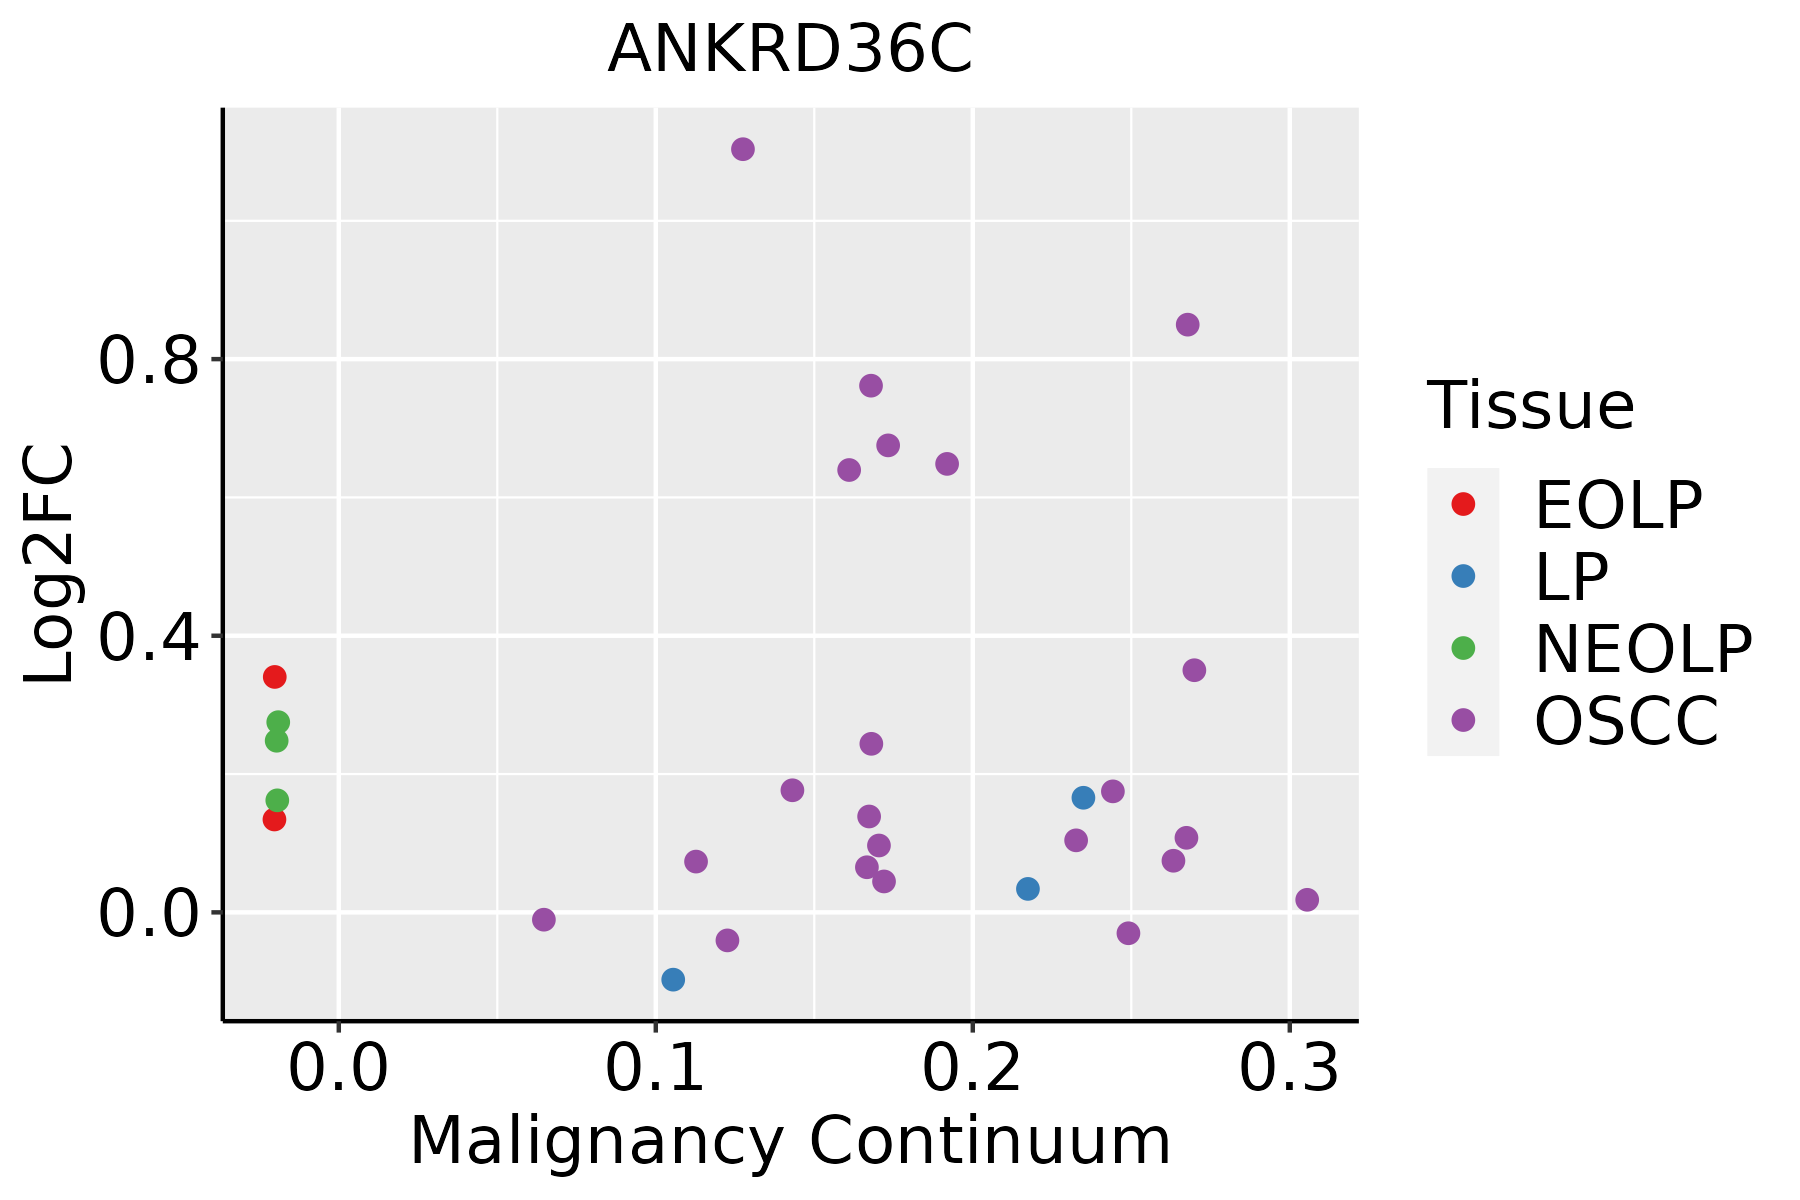 | EOLP: Erosive Oral lichen planus |
| LP: leukoplakia | ||
| NEOLP: Non-erosive oral lichen planus | ||
| OSCC: Oral squamous cell carcinoma | ||
| Prostate |  | BPH: Benign Prostatic Hyperplasia |
| Thyroid |  | ATC: Anaplastic thyroid cancer |
| HT: Hashimoto's thyroiditis | ||
| PTC: Papillary thyroid cancer |
| ∗log2FC in expression of this searched gene in stem-like cells from each diseased tissue sample relative to stem-like cells in normal samples in each tissue plotted against the malignancy continuum. Samples are colored based on if they are from different disease stage. |
Top |
Malignant transformation related pathway analysis |
| Find out the enriched GO biological processes and KEGG pathways involved in transition from healthy to precancer to cancer |
| Tissue | Disease Stage | Enriched GO biological Processes |
| Colorectum | AD |  |
| Colorectum | SER |  |
| Colorectum | MSS |  |
| Colorectum | MSI-H |  |
| Colorectum | FAP |  |
| ∗Top 15 enriched GO BP terms are showed in the bar plot of each disease state in each tissue. Each row represents a significant GO biological process which is colored according to the -log10(p.adjust). |
| Page: 1 2 3 4 5 6 7 8 9 |
| GO ID | Tissue | Disease Stage | Description | Gene Ratio | Bg Ratio | pvalue | p.adjust | Count |
| Page: 1 |
| Pathway ID | Tissue | Disease Stage | Description | Gene Ratio | Bg Ratio | pvalue | p.adjust | qvalue | Count |
| Page: 1 |
Top |
Cell-cell communication analysis |
| Identification of potential cell-cell interactions between two cell types and their ligand-receptor pairs for different disease states |
| Ligand | Receptor | LRpair | Pathway | Tissue | Disease Stage |
| Page: 1 |
Top |
Single-cell gene regulatory network inference analysis |
| Find out the significant the regulons (TFs) and the target genes of each regulon across cell types for different disease states |
| TF | Cell Type | Tissue | Disease Stage | Target Gene | RSS | Regulon Activity |
| ∗The dot plots of a searched regulon are shown for all cell subpopulations in each disease state of each tissue based on the regulon specific score inferred using pySCENIC and by calculating the average expression. |
| Page: 1 |
Top |
Somatic mutation of malignant transformation related genes |
| Annotation of somatic variants for genes involved in malignant transformation |
| Hugo Symbol | Variant Class | Variant Classification | dbSNP RS | HGVSc | HGVSp | HGVSp Short | SWISSPROT | BIOTYPE | SIFT | PolyPhen | Tumor Sample Barcode | Tissue | Histology | Sex | Age | Stage | Therapy Types | Drugs | Outcome |
| ANKRD36C | SNV | Missense_Mutation | novel | c.4056G>C | p.Lys1352Asn | p.K1352N | Q5JPF3 | protein_coding | deleterious(0) | benign(0.291) | TCGA-5L-AAT1-01 | Breast | breast invasive carcinoma | Female | <65 | III/IV | Hormone Therapy | letrozol | SD |
| ANKRD36C | SNV | Missense_Mutation | c.3433N>A | p.Ala1145Thr | p.A1145T | Q5JPF3 | protein_coding | deleterious(0.03) | probably_damaging(0.983) | TCGA-A2-A0T0-01 | Breast | breast invasive carcinoma | Female | <65 | I/II | Chemotherapy | taxotere | SD | |
| ANKRD36C | SNV | Missense_Mutation | rs761278529 | c.1061N>T | p.Ser354Leu | p.S354L | Q5JPF3 | protein_coding | tolerated_low_confidence(0.44) | benign(0.316) | TCGA-A2-A3XX-01 | Breast | breast invasive carcinoma | Female | <65 | I/II | Chemotherapy | cyclophosphamide | CR |
| ANKRD36C | SNV | Missense_Mutation | c.4391N>C | p.Met1464Thr | p.M1464T | Q5JPF3 | protein_coding | tolerated(0.39) | benign(0.044) | TCGA-A8-A08F-01 | Breast | breast invasive carcinoma | Female | <65 | III/IV | Chemotherapy | 5-fluorouracil | CR | |
| ANKRD36C | SNV | Missense_Mutation | novel | c.123N>A | p.Phe41Leu | p.F41L | Q5JPF3 | protein_coding | tolerated(0.67) | benign(0) | TCGA-AN-A046-01 | Breast | breast invasive carcinoma | Female | >=65 | I/II | Unknown | Unknown | SD |
| ANKRD36C | SNV | Missense_Mutation | c.4501C>T | p.His1501Tyr | p.H1501Y | Q5JPF3 | protein_coding | tolerated(0.09) | benign(0.158) | TCGA-BH-A0B4-01 | Breast | breast invasive carcinoma | Male | >=65 | III/IV | Hormone Therapy | tamoxiphen | SD | |
| ANKRD36C | SNV | Missense_Mutation | novel | c.4945N>G | p.His1649Asp | p.H1649D | Q5JPF3 | protein_coding | tolerated(0.08) | benign(0.234) | TCGA-BH-A0B6-01 | Breast | breast invasive carcinoma | Female | <65 | I/II | Unknown | Unknown | SD |
| ANKRD36C | SNV | Missense_Mutation | novel | c.1375N>A | p.Pro459Thr | p.P459T | Q5JPF3 | protein_coding | tolerated_low_confidence(0.3) | benign(0.096) | TCGA-BH-A5J0-01 | Breast | breast invasive carcinoma | Female | <65 | I/II | Unknown | Unknown | SD |
| ANKRD36C | SNV | Missense_Mutation | c.3354G>C | p.Trp1118Cys | p.W1118C | Q5JPF3 | protein_coding | deleterious(0.02) | possibly_damaging(0.775) | TCGA-D8-A27G-01 | Breast | breast invasive carcinoma | Female | >=65 | I/II | Unknown | Unknown | SD | |
| ANKRD36C | SNV | Missense_Mutation | c.2381N>A | p.Thr794Lys | p.T794K | Q5JPF3 | protein_coding | deleterious_low_confidence(0.01) | possibly_damaging(0.518) | TCGA-D8-A27R-01 | Breast | breast invasive carcinoma | Female | <65 | III/IV | Chemotherapy | adriamycin+cyclophosphamide | SD |
| Page: 1 2 3 4 5 6 7 8 9 10 11 12 13 14 15 16 17 18 |
Top |
Related drugs of malignant transformation related genes |
| Identification of chemicals and drugs interact with genes involved in malignant transfromation |
| (DGIdb 4.0) |
| Entrez ID | Symbol | Category | Interaction Types | Drug Claim Name | Drug Name | PMIDs |
| Page: 1 |

Copyright 2023-Present -The University of Texas Health Science Center at Houston |