
|
|||||
|
 | |
| |
| |
| |
| |
| |
|
Gene: ANKRD36 |
Gene summary for ANKRD36 |
| Gene information | Species | Human | Gene symbol | ANKRD36 | Gene ID | 375248 |
| Gene name | ankyrin repeat domain 36 | |
| Gene Alias | UNQ2430 | |
| Cytomap | 2q11.2 | |
| Gene Type | protein-coding | GO ID | NA | UniProtAcc | NA |
Top |
Malignant transformation analysis |
| Identification of the aberrant gene expression in precancerous and cancerous lesions by comparing the gene expression of stem-like cells in diseased tissues with normal stem cells |
| Entrez ID | Symbol | Replicates | Species | Organ | Tissue | Adj P-value | Log2FC | Malignancy |
| 375248 | ANKRD36 | HTA11_3410_2000001011 | Human | Colorectum | AD | 5.66e-23 | -6.39e-01 | 0.0155 |
| 375248 | ANKRD36 | HTA11_2487_2000001011 | Human | Colorectum | SER | 1.56e-11 | -6.06e-01 | -0.1808 |
| 375248 | ANKRD36 | HTA11_347_2000001011 | Human | Colorectum | AD | 1.08e-02 | -2.94e-01 | -0.1954 |
| 375248 | ANKRD36 | HTA11_3361_2000001011 | Human | Colorectum | AD | 6.75e-08 | -5.83e-01 | -0.1207 |
| 375248 | ANKRD36 | HTA11_83_2000001011 | Human | Colorectum | SER | 2.99e-06 | -5.88e-01 | -0.1526 |
| 375248 | ANKRD36 | HTA11_696_2000001011 | Human | Colorectum | AD | 1.45e-13 | -5.55e-01 | -0.1464 |
| 375248 | ANKRD36 | HTA11_866_2000001011 | Human | Colorectum | AD | 1.53e-13 | -5.54e-01 | -0.1001 |
| 375248 | ANKRD36 | HTA11_1391_2000001011 | Human | Colorectum | AD | 1.16e-07 | -4.80e-01 | -0.059 |
| 375248 | ANKRD36 | HTA11_5212_2000001011 | Human | Colorectum | AD | 2.06e-03 | -6.18e-01 | -0.2061 |
| 375248 | ANKRD36 | HTA11_7862_2000001011 | Human | Colorectum | AD | 1.71e-03 | -5.72e-01 | -0.0179 |
| 375248 | ANKRD36 | HTA11_866_3004761011 | Human | Colorectum | AD | 1.86e-10 | -5.16e-01 | 0.096 |
| 375248 | ANKRD36 | HTA11_8622_2000001021 | Human | Colorectum | SER | 1.27e-04 | -6.46e-01 | 0.0528 |
| 375248 | ANKRD36 | HTA11_10711_2000001011 | Human | Colorectum | AD | 5.28e-08 | -5.59e-01 | 0.0338 |
| 375248 | ANKRD36 | HTA11_7696_3000711011 | Human | Colorectum | AD | 5.48e-11 | -4.98e-01 | 0.0674 |
| 375248 | ANKRD36 | HTA11_6818_2000001021 | Human | Colorectum | AD | 4.09e-02 | -4.40e-01 | 0.0588 |
| 375248 | ANKRD36 | HTA11_99999970781_79442 | Human | Colorectum | MSS | 2.62e-11 | -4.72e-01 | 0.294 |
| 375248 | ANKRD36 | HTA11_99999971662_82457 | Human | Colorectum | MSS | 1.72e-06 | -4.50e-01 | 0.3859 |
| 375248 | ANKRD36 | HTA11_99999973899_84307 | Human | Colorectum | MSS | 3.85e-04 | -5.38e-01 | 0.2585 |
| 375248 | ANKRD36 | HTA11_99999974143_84620 | Human | Colorectum | MSS | 5.08e-10 | -4.92e-01 | 0.3005 |
| 375248 | ANKRD36 | A002-C-010 | Human | Colorectum | FAP | 8.14e-04 | -1.98e-01 | 0.242 |
| Page: 1 2 3 4 5 6 7 |
| Tissue | Expression Dynamics | Abbreviation |
| Colorectum (GSE201348) |  | FAP: Familial adenomatous polyposis |
| CRC: Colorectal cancer | ||
| Colorectum (HTA11) |  | AD: Adenomas |
| SER: Sessile serrated lesions | ||
| MSI-H: Microsatellite-high colorectal cancer | ||
| MSS: Microsatellite stable colorectal cancer | ||
| Esophagus | 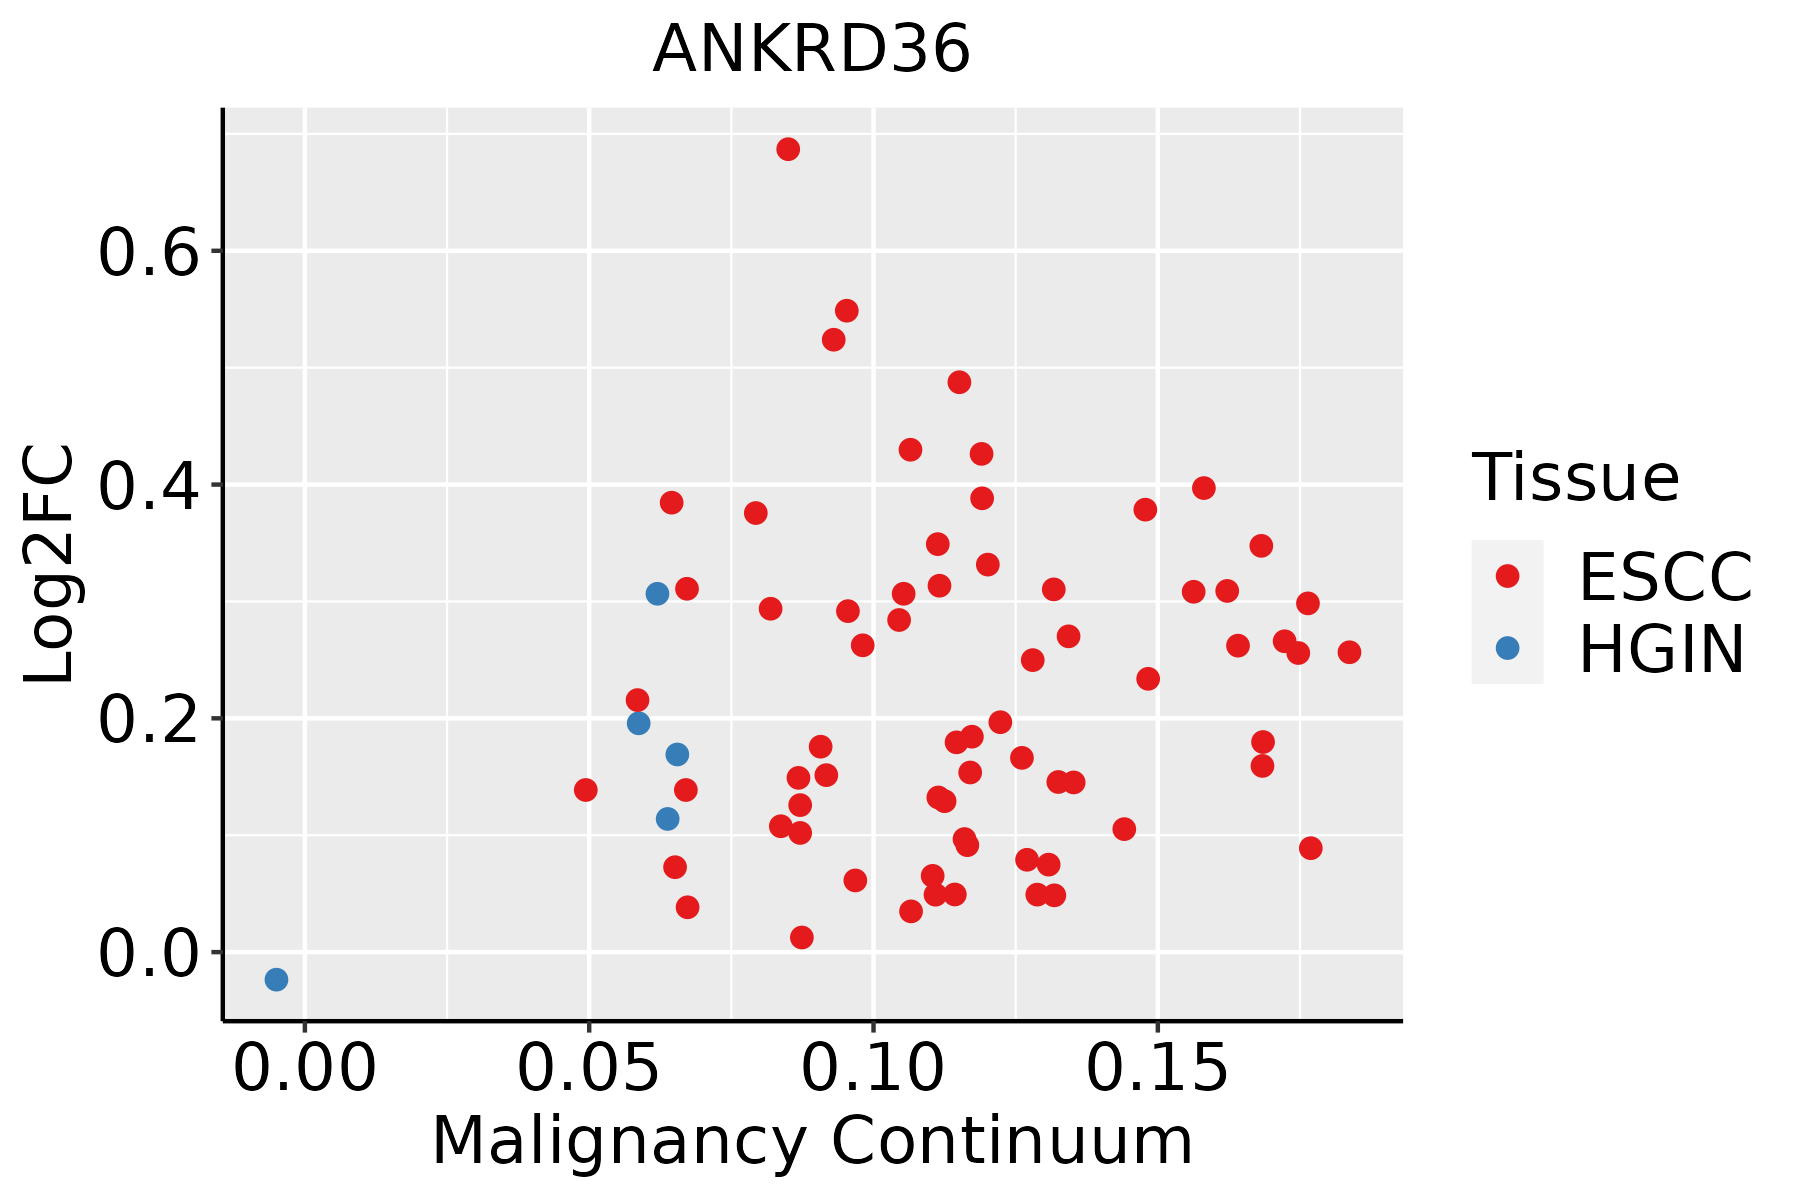 | ESCC: Esophageal squamous cell carcinoma |
| HGIN: High-grade intraepithelial neoplasias | ||
| LGIN: Low-grade intraepithelial neoplasias | ||
| Liver | 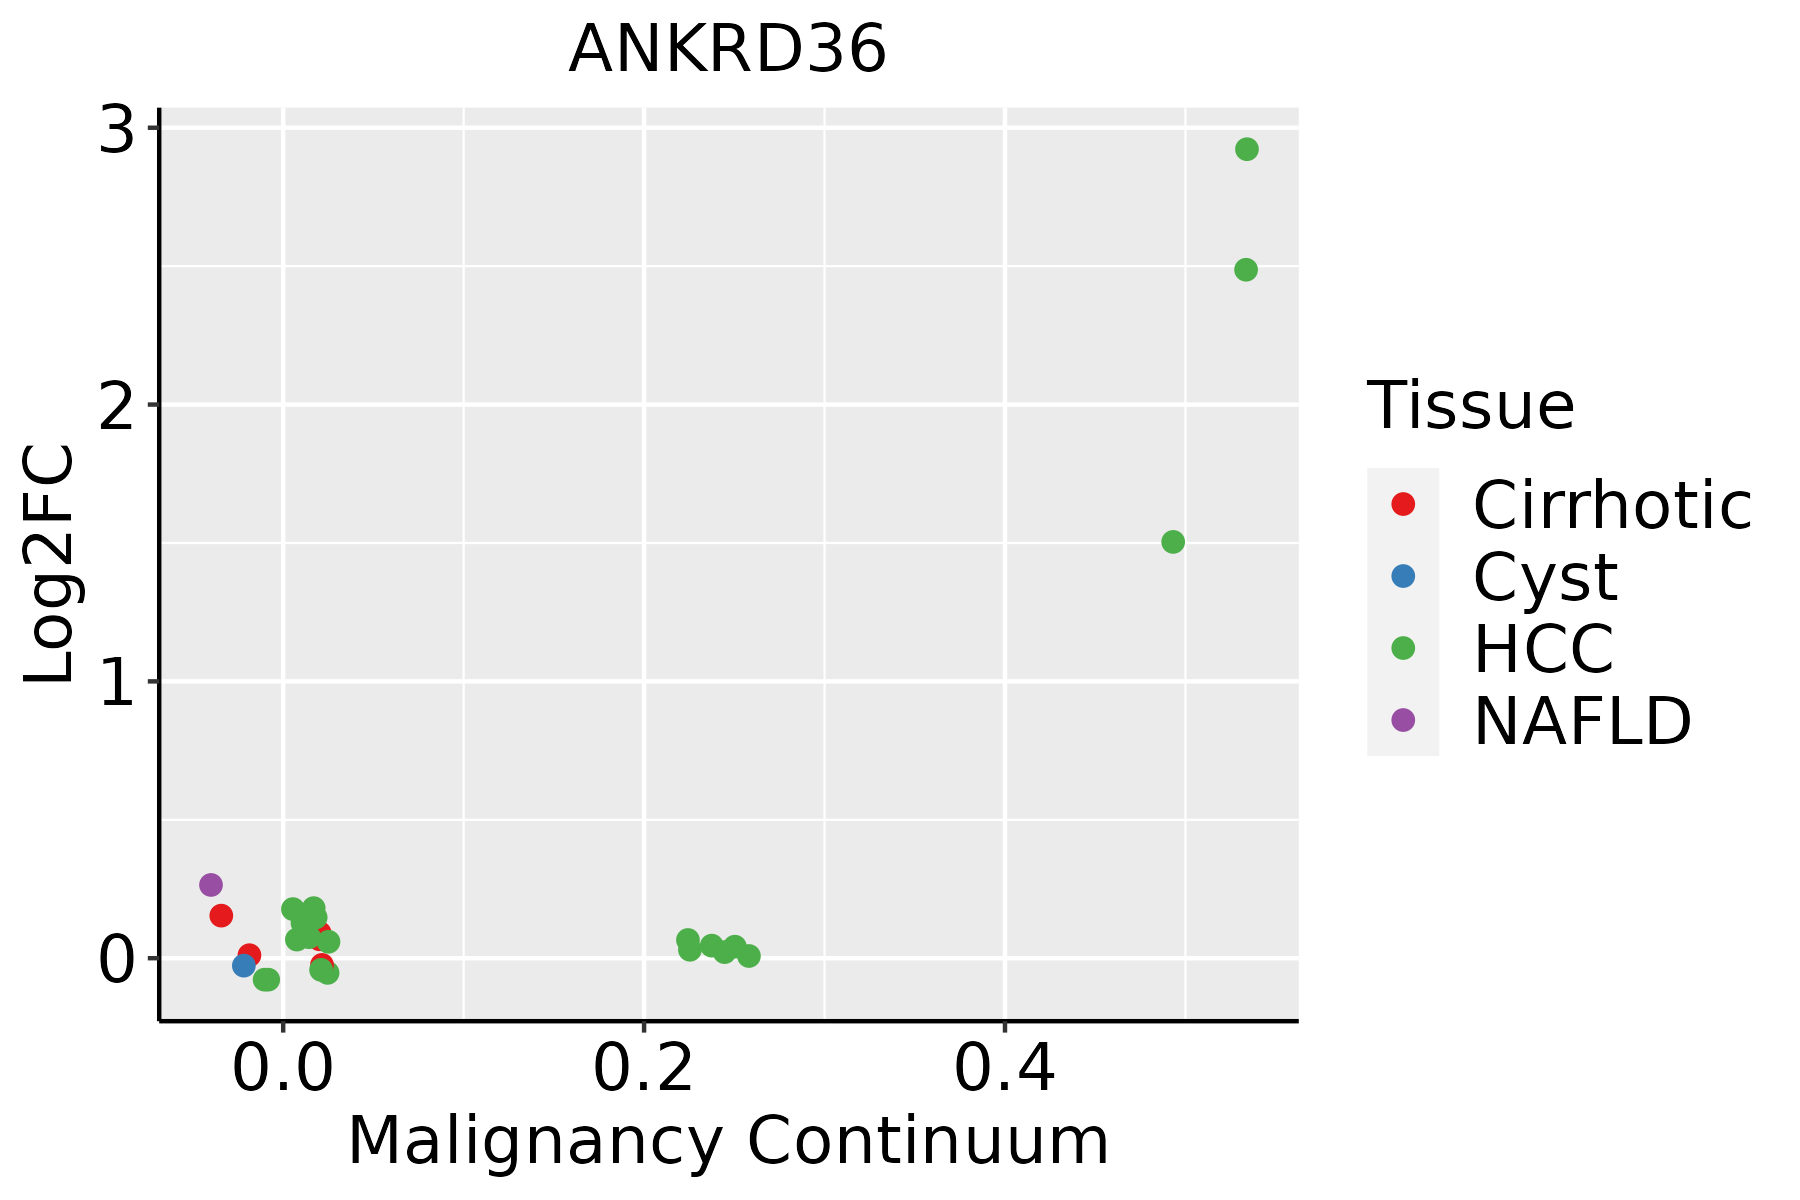 | HCC: Hepatocellular carcinoma |
| NAFLD: Non-alcoholic fatty liver disease | ||
| Skin | 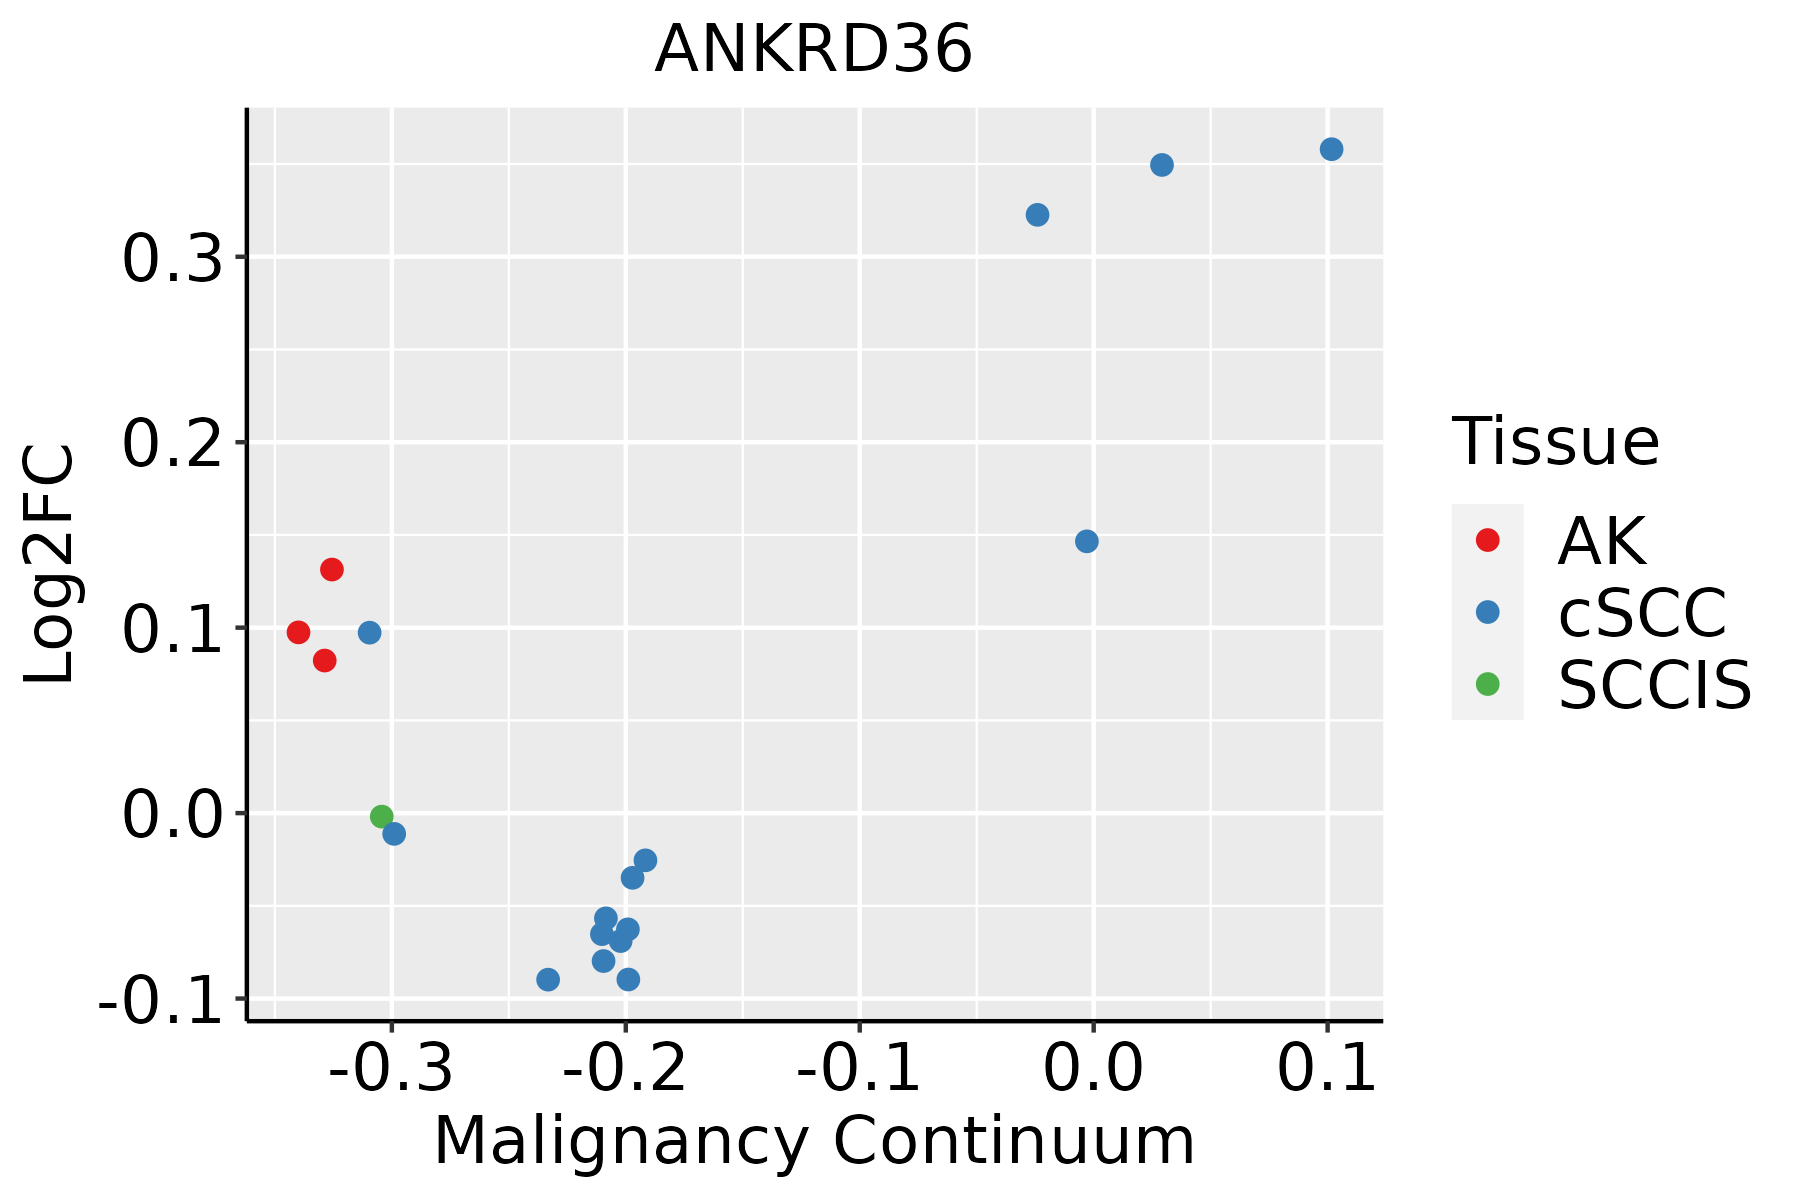 | AK: Actinic keratosis |
| cSCC: Cutaneous squamous cell carcinoma | ||
| SCCIS:squamous cell carcinoma in situ | ||
| Thyroid | 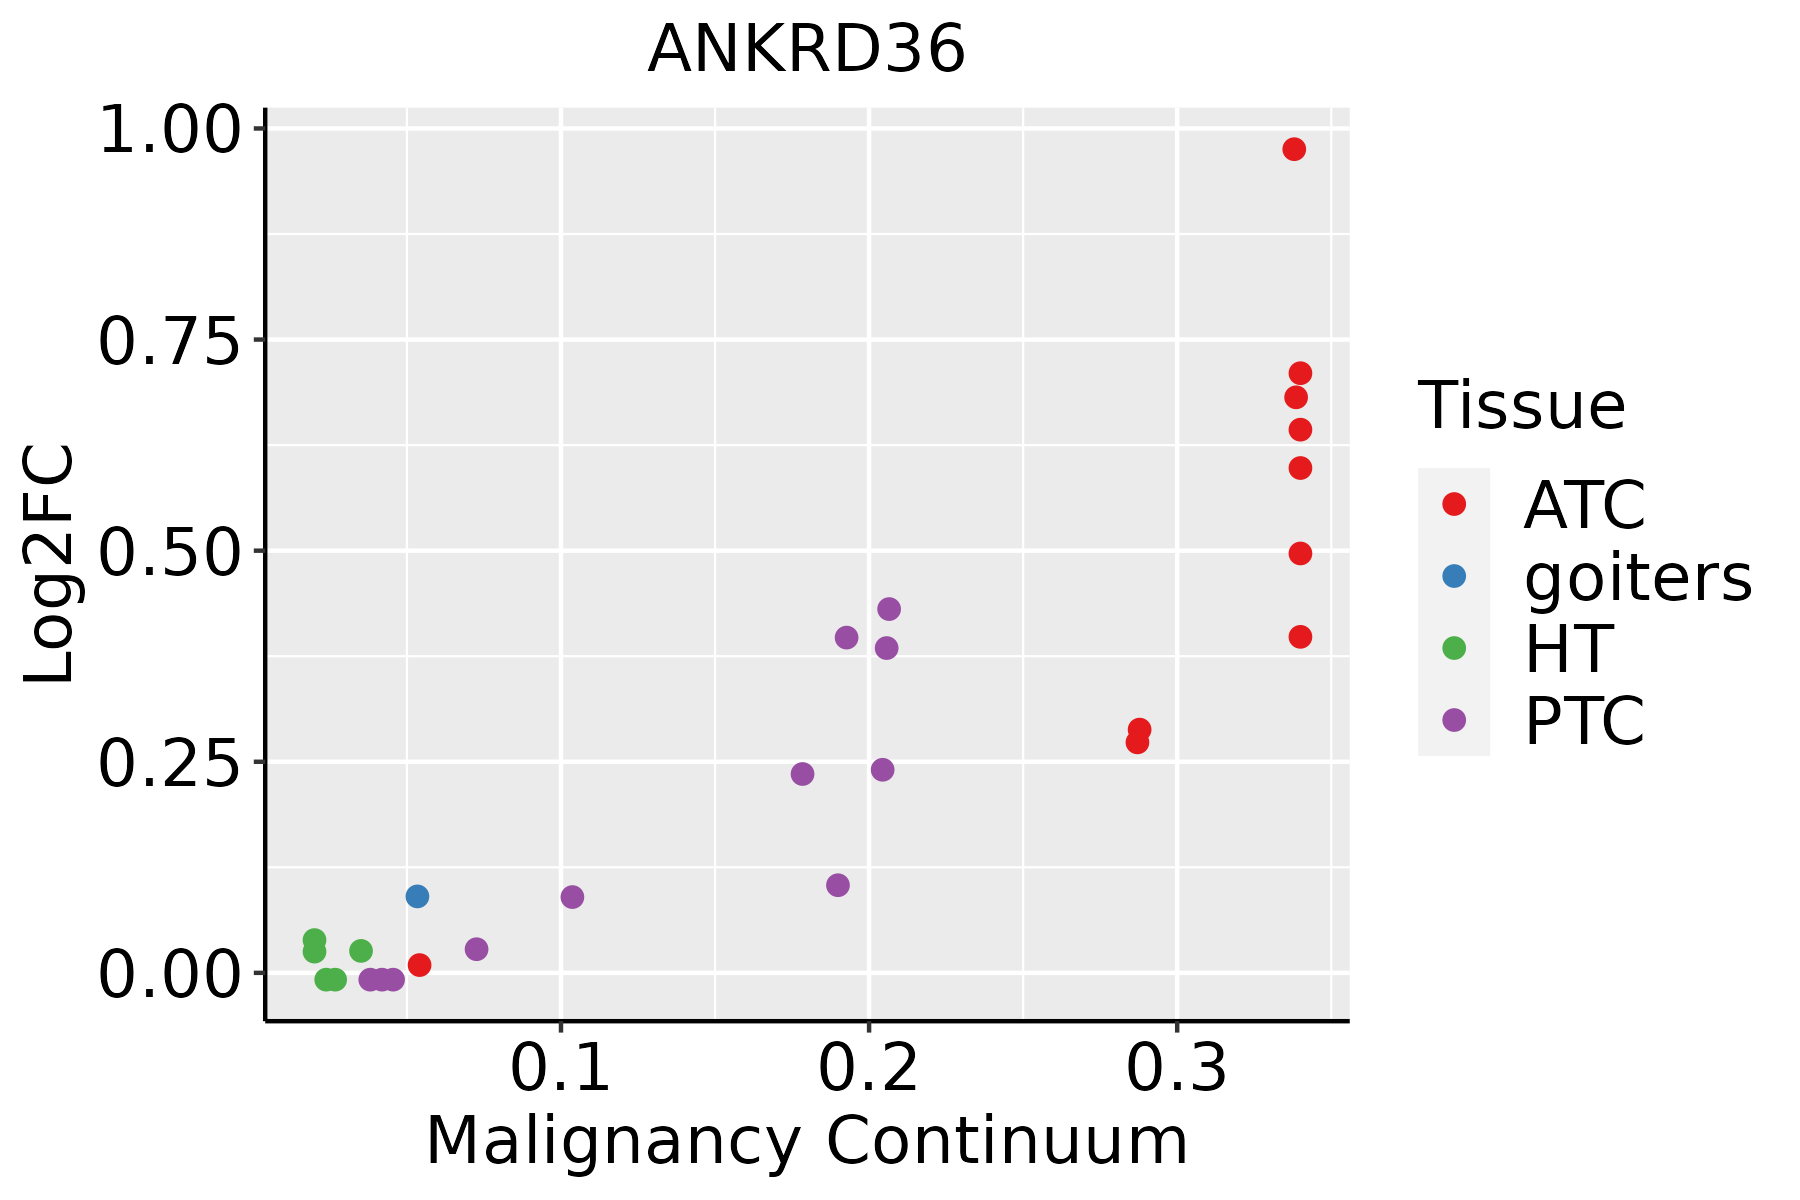 | ATC: Anaplastic thyroid cancer |
| HT: Hashimoto's thyroiditis | ||
| PTC: Papillary thyroid cancer |
| ∗log2FC in expression of this searched gene in stem-like cells from each diseased tissue sample relative to stem-like cells in normal samples in each tissue plotted against the malignancy continuum. Samples are colored based on if they are from different disease stage. |
Top |
Malignant transformation related pathway analysis |
| Find out the enriched GO biological processes and KEGG pathways involved in transition from healthy to precancer to cancer |
| Tissue | Disease Stage | Enriched GO biological Processes |
| Colorectum | AD |  |
| Colorectum | SER |  |
| Colorectum | MSS |  |
| Colorectum | MSI-H |  |
| Colorectum | FAP |  |
| ∗Top 15 enriched GO BP terms are showed in the bar plot of each disease state in each tissue. Each row represents a significant GO biological process which is colored according to the -log10(p.adjust). |
| Page: 1 2 3 4 5 6 7 8 9 |
| GO ID | Tissue | Disease Stage | Description | Gene Ratio | Bg Ratio | pvalue | p.adjust | Count |
| Page: 1 |
| Pathway ID | Tissue | Disease Stage | Description | Gene Ratio | Bg Ratio | pvalue | p.adjust | qvalue | Count |
| Page: 1 |
Top |
Cell-cell communication analysis |
| Identification of potential cell-cell interactions between two cell types and their ligand-receptor pairs for different disease states |
| Ligand | Receptor | LRpair | Pathway | Tissue | Disease Stage |
| Page: 1 |
Top |
Single-cell gene regulatory network inference analysis |
| Find out the significant the regulons (TFs) and the target genes of each regulon across cell types for different disease states |
| TF | Cell Type | Tissue | Disease Stage | Target Gene | RSS | Regulon Activity |
| ∗The dot plots of a searched regulon are shown for all cell subpopulations in each disease state of each tissue based on the regulon specific score inferred using pySCENIC and by calculating the average expression. |
| Page: 1 |
Top |
Somatic mutation of malignant transformation related genes |
| Annotation of somatic variants for genes involved in malignant transformation |
| Hugo Symbol | Variant Class | Variant Classification | dbSNP RS | HGVSc | HGVSp | HGVSp Short | SWISSPROT | BIOTYPE | SIFT | PolyPhen | Tumor Sample Barcode | Tissue | Histology | Sex | Age | Stage | Therapy Types | Drugs | Outcome |
| ANKRD36 | SNV | Missense_Mutation | novel | c.1705G>A | p.Glu569Lys | p.E569K | A6QL64 | protein_coding | deleterious_low_confidence(0) | benign(0.063) | TCGA-3C-AALI-01 | Breast | breast invasive carcinoma | Female | <65 | I/II | Unspecific | Poly E | Complete Response |
| ANKRD36 | SNV | Missense_Mutation | novel | c.149A>G | p.Tyr50Cys | p.Y50C | A6QL64 | protein_coding | tolerated(0.09) | possibly_damaging(0.736) | TCGA-A7-A0CJ-01 | Breast | breast invasive carcinoma | Female | <65 | I/II | Chemotherapy | cytoxan | SD |
| ANKRD36 | SNV | Missense_Mutation | rs770279386 | c.2765N>A | p.Arg922Gln | p.R922Q | A6QL64 | protein_coding | tolerated_low_confidence(1) | possibly_damaging(0.78) | TCGA-A8-A075-01 | Breast | breast invasive carcinoma | Female | <65 | I/II | Chemotherapy | epirubicin | CR |
| ANKRD36 | SNV | Missense_Mutation | rs549603991 | c.3236N>A | p.Gly1079Glu | p.G1079E | A6QL64 | protein_coding | tolerated_low_confidence(1) | benign(0.003) | TCGA-A8-A07Z-01 | Breast | breast invasive carcinoma | Female | >=65 | I/II | Unspecific | Exemestane | SD |
| ANKRD36 | SNV | Missense_Mutation | c.2672N>T | p.Pro891Leu | p.P891L | A6QL64 | protein_coding | deleterious_low_confidence(0) | probably_damaging(0.966) | TCGA-AC-A23C-01 | Breast | breast invasive carcinoma | Female | <65 | I/II | Chemotherapy | chemo | CR | |
| ANKRD36 | SNV | Missense_Mutation | novel | c.4840N>C | p.Glu1614Gln | p.E1614Q | A6QL64 | protein_coding | deleterious(0.02) | possibly_damaging(0.46) | TCGA-AC-A5XS-01 | Breast | breast invasive carcinoma | Female | >=65 | I/II | Hormone Therapy | femara | SD |
| ANKRD36 | SNV | Missense_Mutation | novel | c.565N>C | p.Asn189His | p.N189H | A6QL64 | protein_coding | deleterious(0) | benign(0.081) | TCGA-AN-A046-01 | Breast | breast invasive carcinoma | Female | >=65 | I/II | Unknown | Unknown | SD |
| ANKRD36 | SNV | Missense_Mutation | novel | c.4913N>A | p.Arg1638Gln | p.R1638Q | A6QL64 | protein_coding | deleterious(0) | benign(0) | TCGA-AN-A046-01 | Breast | breast invasive carcinoma | Female | >=65 | I/II | Unknown | Unknown | SD |
| ANKRD36 | SNV | Missense_Mutation | rs532945164 | c.3223N>T | p.Asn1075Tyr | p.N1075Y | A6QL64 | protein_coding | deleterious_low_confidence(0) | benign(0.137) | TCGA-AR-A2LN-01 | Breast | breast invasive carcinoma | Female | >=65 | I/II | Hormone Therapy | letrozole | SD |
| ANKRD36 | SNV | Missense_Mutation | novel | c.4202N>T | p.Thr1401Ile | p.T1401I | A6QL64 | protein_coding | tolerated(0.26) | benign(0.007) | TCGA-BH-A0AZ-01 | Breast | breast invasive carcinoma | Female | <65 | III/IV | Chemotherapy | doxorubicin | CR |
| Page: 1 2 3 4 5 6 7 8 9 10 11 12 13 14 15 16 17 |
Top |
Related drugs of malignant transformation related genes |
| Identification of chemicals and drugs interact with genes involved in malignant transfromation |
| (DGIdb 4.0) |
| Entrez ID | Symbol | Category | Interaction Types | Drug Claim Name | Drug Name | PMIDs |
| Page: 1 |

Copyright 2023-Present -The University of Texas Health Science Center at Houston |