
|
|||||
|
 | |
| |
| |
| |
| |
| |
|
Gene: ANKRD30A |
Gene summary for ANKRD30A |
| Gene information | Species | Human | Gene symbol | ANKRD30A | Gene ID | 91074 |
| Gene name | ankyrin repeat domain 30A | |
| Gene Alias | NY-BR-1 | |
| Cytomap | 10p11.21 | |
| Gene Type | protein-coding | GO ID | NA | UniProtAcc | Q9BXX3 |
Top |
Malignant transformation analysis |
| Identification of the aberrant gene expression in precancerous and cancerous lesions by comparing the gene expression of stem-like cells in diseased tissues with normal stem cells |
| Entrez ID | Symbol | Replicates | Species | Organ | Tissue | Adj P-value | Log2FC | Malignancy |
| 91074 | ANKRD30A | GSM4909281 | Human | Breast | IDC | 5.35e-20 | -5.37e-01 | 0.21 |
| 91074 | ANKRD30A | GSM4909282 | Human | Breast | IDC | 9.92e-21 | -5.37e-01 | -0.0288 |
| 91074 | ANKRD30A | GSM4909285 | Human | Breast | IDC | 1.31e-17 | -5.25e-01 | 0.21 |
| 91074 | ANKRD30A | GSM4909286 | Human | Breast | IDC | 2.86e-19 | -5.36e-01 | 0.1081 |
| 91074 | ANKRD30A | GSM4909287 | Human | Breast | IDC | 4.02e-18 | -5.37e-01 | 0.2057 |
| 91074 | ANKRD30A | GSM4909288 | Human | Breast | IDC | 8.02e-04 | -5.37e-01 | 0.0988 |
| 91074 | ANKRD30A | GSM4909293 | Human | Breast | IDC | 4.72e-37 | 5.30e-01 | 0.1581 |
| 91074 | ANKRD30A | GSM4909294 | Human | Breast | IDC | 9.04e-07 | 5.32e-01 | 0.2022 |
| 91074 | ANKRD30A | GSM4909295 | Human | Breast | IDC | 5.68e-08 | -5.37e-01 | 0.0898 |
| 91074 | ANKRD30A | GSM4909296 | Human | Breast | IDC | 2.31e-20 | -5.37e-01 | 0.1524 |
| 91074 | ANKRD30A | GSM4909297 | Human | Breast | IDC | 1.84e-09 | 5.94e-01 | 0.1517 |
| 91074 | ANKRD30A | GSM4909298 | Human | Breast | IDC | 1.86e-34 | 5.89e-01 | 0.1551 |
| 91074 | ANKRD30A | GSM4909301 | Human | Breast | IDC | 3.33e-27 | 6.90e-01 | 0.1577 |
| 91074 | ANKRD30A | GSM4909302 | Human | Breast | IDC | 7.88e-29 | 8.02e-01 | 0.1545 |
| 91074 | ANKRD30A | GSM4909303 | Human | Breast | IDC | 1.17e-02 | 5.70e-01 | 0.0438 |
| 91074 | ANKRD30A | GSM4909304 | Human | Breast | IDC | 6.58e-19 | -5.37e-01 | 0.1636 |
| 91074 | ANKRD30A | GSM4909306 | Human | Breast | IDC | 1.33e-27 | 7.62e-01 | 0.1564 |
| 91074 | ANKRD30A | GSM4909307 | Human | Breast | IDC | 4.88e-14 | 5.32e-01 | 0.1569 |
| 91074 | ANKRD30A | GSM4909308 | Human | Breast | IDC | 6.33e-55 | 8.56e-01 | 0.158 |
| 91074 | ANKRD30A | GSM4909309 | Human | Breast | IDC | 1.51e-10 | -5.12e-01 | 0.0483 |
| Page: 1 2 |
| Tissue | Expression Dynamics | Abbreviation |
| Breast | 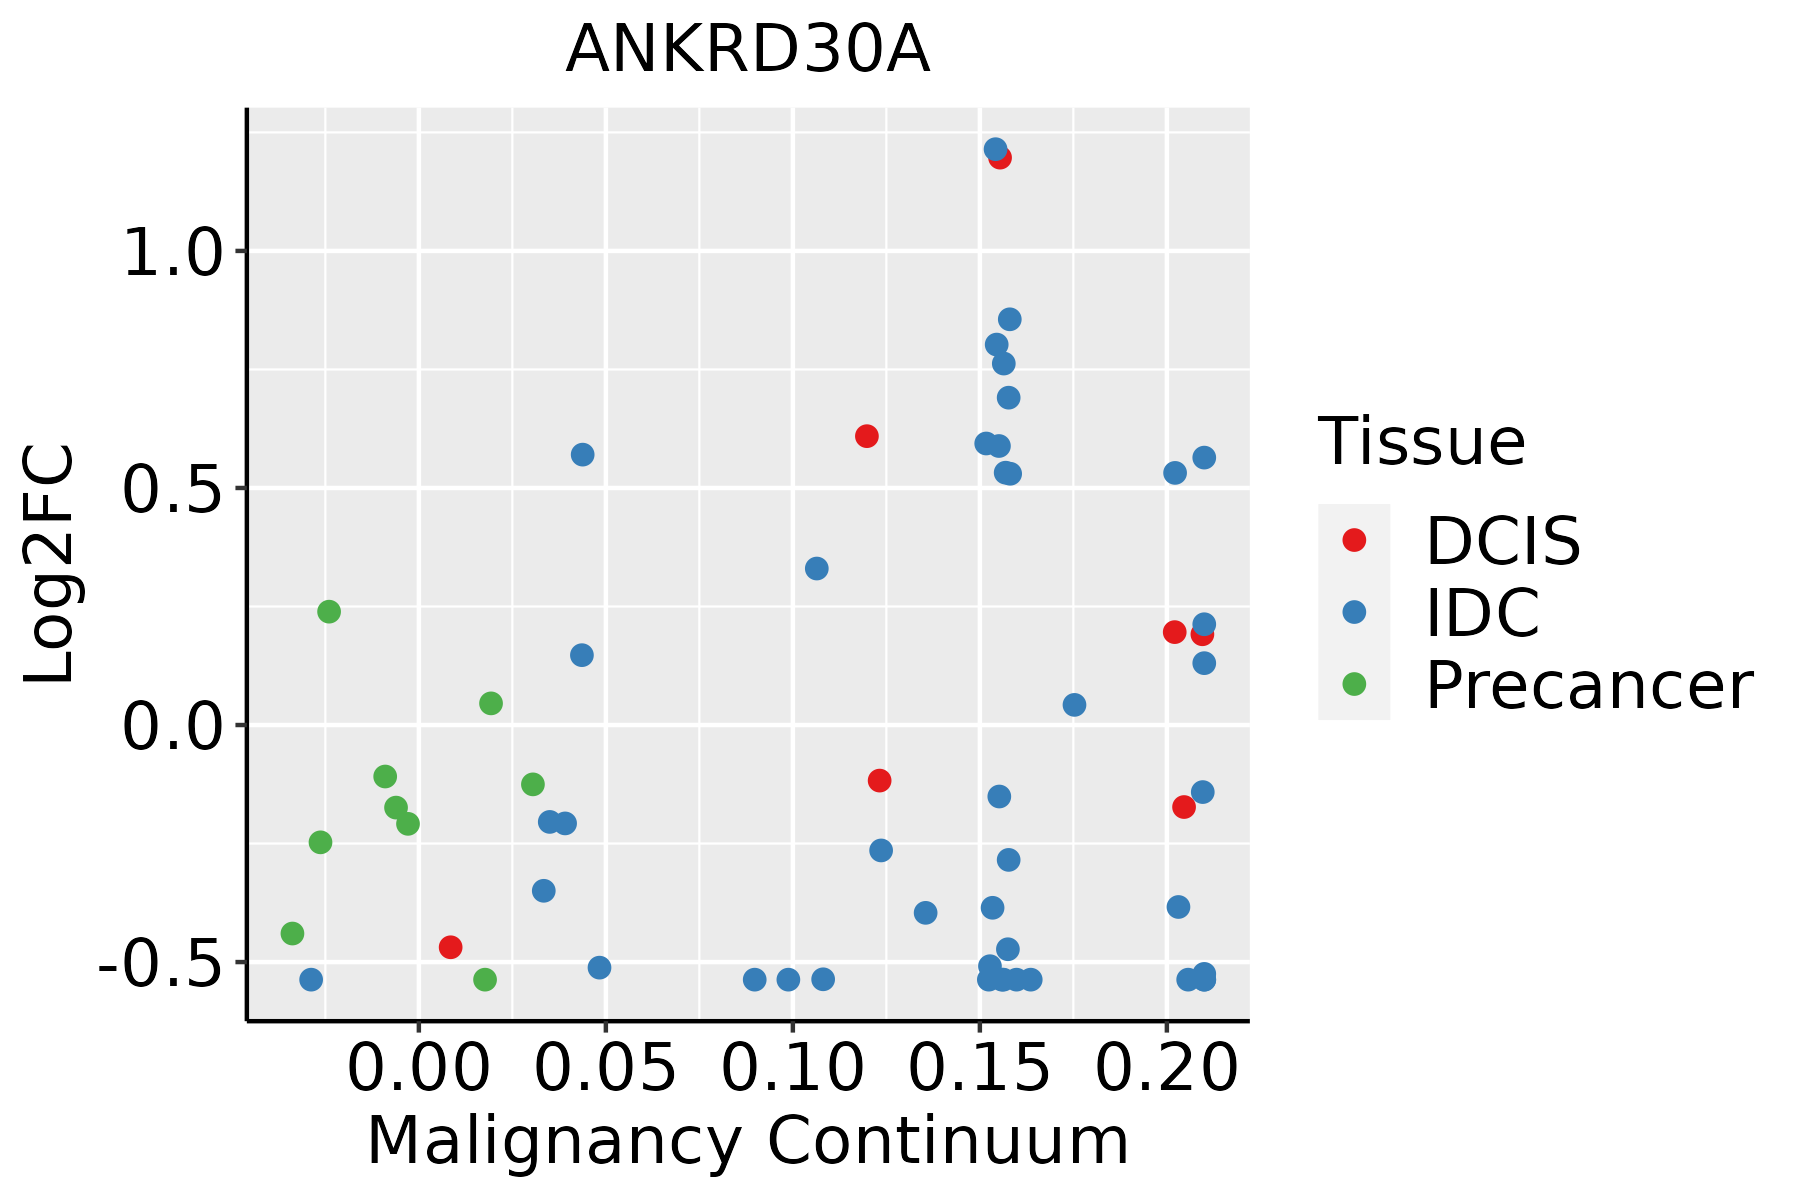 | IDC: Invasive ductal carcinoma |
| DCIS: Ductal carcinoma in situ | ||
| Precancer(BRCA1-mut): Precancerous lesion from BRCA1 mutation carriers |
| ∗log2FC in expression of this searched gene in stem-like cells from each diseased tissue sample relative to stem-like cells in normal samples in each tissue plotted against the malignancy continuum. Samples are colored based on if they are from different disease stage. |
Top |
Malignant transformation related pathway analysis |
| Find out the enriched GO biological processes and KEGG pathways involved in transition from healthy to precancer to cancer |
| Tissue | Disease Stage | Enriched GO biological Processes |
| Colorectum | AD |  |
| Colorectum | SER |  |
| Colorectum | MSS |  |
| Colorectum | MSI-H |  |
| Colorectum | FAP |  |
| ∗Top 15 enriched GO BP terms are showed in the bar plot of each disease state in each tissue. Each row represents a significant GO biological process which is colored according to the -log10(p.adjust). |
| Page: 1 2 3 4 5 6 7 8 9 |
| GO ID | Tissue | Disease Stage | Description | Gene Ratio | Bg Ratio | pvalue | p.adjust | Count |
| Page: 1 |
| Pathway ID | Tissue | Disease Stage | Description | Gene Ratio | Bg Ratio | pvalue | p.adjust | qvalue | Count |
| Page: 1 |
Top |
Cell-cell communication analysis |
| Identification of potential cell-cell interactions between two cell types and their ligand-receptor pairs for different disease states |
| Ligand | Receptor | LRpair | Pathway | Tissue | Disease Stage |
| Page: 1 |
Top |
Single-cell gene regulatory network inference analysis |
| Find out the significant the regulons (TFs) and the target genes of each regulon across cell types for different disease states |
| TF | Cell Type | Tissue | Disease Stage | Target Gene | RSS | Regulon Activity |
| ∗The dot plots of a searched regulon are shown for all cell subpopulations in each disease state of each tissue based on the regulon specific score inferred using pySCENIC and by calculating the average expression. |
| Page: 1 |
Top |
Somatic mutation of malignant transformation related genes |
| Annotation of somatic variants for genes involved in malignant transformation |
| Hugo Symbol | Variant Class | Variant Classification | dbSNP RS | HGVSc | HGVSp | HGVSp Short | SWISSPROT | BIOTYPE | SIFT | PolyPhen | Tumor Sample Barcode | Tissue | Histology | Sex | Age | Stage | Therapy Types | Drugs | Outcome |
| ANKRD30A | SNV | Missense_Mutation | novel | c.3298N>C | p.Ser1100Pro | p.S1100P | protein_coding | deleterious(0) | benign(0.125) | TCGA-A2-A3Y0-01 | Breast | breast invasive carcinoma | Female | <65 | I/II | Chemotherapy | adriamycin | CR | |
| ANKRD30A | SNV | Missense_Mutation | c.2694N>T | p.Lys898Asn | p.K898N | protein_coding | deleterious(0.02) | benign(0.03) | TCGA-AN-A0AT-01 | Breast | breast invasive carcinoma | Female | <65 | I/II | Unknown | Unknown | SD | ||
| ANKRD30A | SNV | Missense_Mutation | c.305N>A | p.Leu102Gln | p.L102Q | protein_coding | deleterious(0) | probably_damaging(0.995) | TCGA-AO-A124-01 | Breast | breast invasive carcinoma | Female | <65 | I/II | Chemotherapy | doxorubicin | SD | ||
| ANKRD30A | SNV | Missense_Mutation | c.1704N>C | p.Glu568Asp | p.E568D | protein_coding | deleterious(0.05) | benign(0.191) | TCGA-AR-A1AO-01 | Breast | breast invasive carcinoma | Female | <65 | I/II | Chemotherapy | doxorubicin | SD | ||
| ANKRD30A | SNV | Missense_Mutation | c.3715N>G | p.Met1239Val | p.M1239V | protein_coding | tolerated(0.06) | benign(0.009) | TCGA-BH-A18V-01 | Breast | breast invasive carcinoma | Female | <65 | I/II | Unknown | Unknown | SD | ||
| ANKRD30A | SNV | Missense_Mutation | c.223N>A | p.Asp75Asn | p.D75N | protein_coding | tolerated(0.07) | probably_damaging(0.989) | TCGA-EW-A1P4-01 | Breast | breast invasive carcinoma | Female | <65 | I/II | Chemotherapy | docetaxel | SD | ||
| ANKRD30A | SNV | Missense_Mutation | c.3265N>A | p.Glu1089Lys | p.E1089K | protein_coding | deleterious(0.01) | possibly_damaging(0.899) | TCGA-OL-A66L-01 | Breast | breast invasive carcinoma | Female | >=65 | I/II | Unknown | Unknown | SD | ||
| ANKRD30A | SNV | Missense_Mutation | novel | c.1055G>T | p.Trp352Leu | p.W352L | protein_coding | tolerated(0.83) | benign(0.307) | TCGA-PL-A8LV-01 | Breast | breast invasive carcinoma | Female | <65 | III/IV | Unknown | Unknown | SD | |
| ANKRD30A | SNV | Missense_Mutation | c.3505N>T | p.Ile1169Phe | p.I1169F | protein_coding | tolerated(0.05) | benign(0.006) | TCGA-C5-A1BF-01 | Cervix | cervical & endocervical cancer | Female | <65 | I/II | Chemotherapy | cisplatin | PD | ||
| ANKRD30A | SNV | Missense_Mutation | novel | c.1090N>C | p.Glu364Gln | p.E364Q | protein_coding | tolerated(0.24) | probably_damaging(0.932) | TCGA-C5-A1M7-01 | Cervix | cervical & endocervical cancer | Female | <65 | I/II | Unknown | Unknown | SD |
| Page: 1 2 3 4 5 6 7 8 9 10 11 12 13 14 15 16 17 18 19 20 21 22 23 24 25 26 27 28 29 30 |
Top |
Related drugs of malignant transformation related genes |
| Identification of chemicals and drugs interact with genes involved in malignant transfromation |
| (DGIdb 4.0) |
| Entrez ID | Symbol | Category | Interaction Types | Drug Claim Name | Drug Name | PMIDs |
| Page: 1 |

Copyright 2023-Present -The University of Texas Health Science Center at Houston |