
|
|||||
|
 | |
| |
| |
| |
| |
| |
|
Gene: ANKRD29 |
Gene summary for ANKRD29 |
| Gene information | Species | Human | Gene symbol | ANKRD29 | Gene ID | 147463 |
| Gene name | ankyrin repeat domain 29 | |
| Gene Alias | ANKRD29 | |
| Cytomap | 18q11.2 | |
| Gene Type | protein-coding | GO ID | GO:0003674 | UniProtAcc | Q8N6D5 |
Top |
Malignant transformation analysis |
| Identification of the aberrant gene expression in precancerous and cancerous lesions by comparing the gene expression of stem-like cells in diseased tissues with normal stem cells |
| Entrez ID | Symbol | Replicates | Species | Organ | Tissue | Adj P-value | Log2FC | Malignancy |
| 147463 | ANKRD29 | LZE4T | Human | Esophagus | ESCC | 1.94e-05 | 2.79e-01 | 0.0811 |
| 147463 | ANKRD29 | P2T-E | Human | Esophagus | ESCC | 3.60e-13 | 2.50e-01 | 0.1177 |
| 147463 | ANKRD29 | P5T-E | Human | Esophagus | ESCC | 1.25e-26 | 4.90e-01 | 0.1327 |
| 147463 | ANKRD29 | P9T-E | Human | Esophagus | ESCC | 8.98e-05 | 1.59e-01 | 0.1131 |
| 147463 | ANKRD29 | P10T-E | Human | Esophagus | ESCC | 1.78e-03 | 8.26e-02 | 0.116 |
| 147463 | ANKRD29 | P11T-E | Human | Esophagus | ESCC | 2.48e-03 | 1.82e-01 | 0.1426 |
| 147463 | ANKRD29 | P12T-E | Human | Esophagus | ESCC | 7.90e-03 | 7.56e-02 | 0.1122 |
| 147463 | ANKRD29 | P15T-E | Human | Esophagus | ESCC | 4.22e-03 | 1.48e-01 | 0.1149 |
| 147463 | ANKRD29 | P21T-E | Human | Esophagus | ESCC | 2.87e-41 | 8.58e-01 | 0.1617 |
| 147463 | ANKRD29 | P22T-E | Human | Esophagus | ESCC | 9.20e-06 | 1.34e-01 | 0.1236 |
| 147463 | ANKRD29 | P23T-E | Human | Esophagus | ESCC | 1.22e-08 | 3.52e-01 | 0.108 |
| 147463 | ANKRD29 | P26T-E | Human | Esophagus | ESCC | 2.13e-27 | 4.86e-01 | 0.1276 |
| 147463 | ANKRD29 | P27T-E | Human | Esophagus | ESCC | 1.30e-09 | 3.11e-01 | 0.1055 |
| 147463 | ANKRD29 | P28T-E | Human | Esophagus | ESCC | 1.88e-04 | 9.80e-02 | 0.1149 |
| 147463 | ANKRD29 | P30T-E | Human | Esophagus | ESCC | 1.11e-09 | 4.39e-01 | 0.137 |
| 147463 | ANKRD29 | P32T-E | Human | Esophagus | ESCC | 4.16e-22 | 4.13e-01 | 0.1666 |
| 147463 | ANKRD29 | P37T-E | Human | Esophagus | ESCC | 3.31e-03 | 1.69e-01 | 0.1371 |
| 147463 | ANKRD29 | P40T-E | Human | Esophagus | ESCC | 2.71e-12 | 4.22e-01 | 0.109 |
| 147463 | ANKRD29 | P42T-E | Human | Esophagus | ESCC | 2.25e-10 | 3.17e-01 | 0.1175 |
| 147463 | ANKRD29 | P48T-E | Human | Esophagus | ESCC | 9.20e-06 | 1.33e-01 | 0.0959 |
| Page: 1 2 3 |
| Tissue | Expression Dynamics | Abbreviation |
| Esophagus | 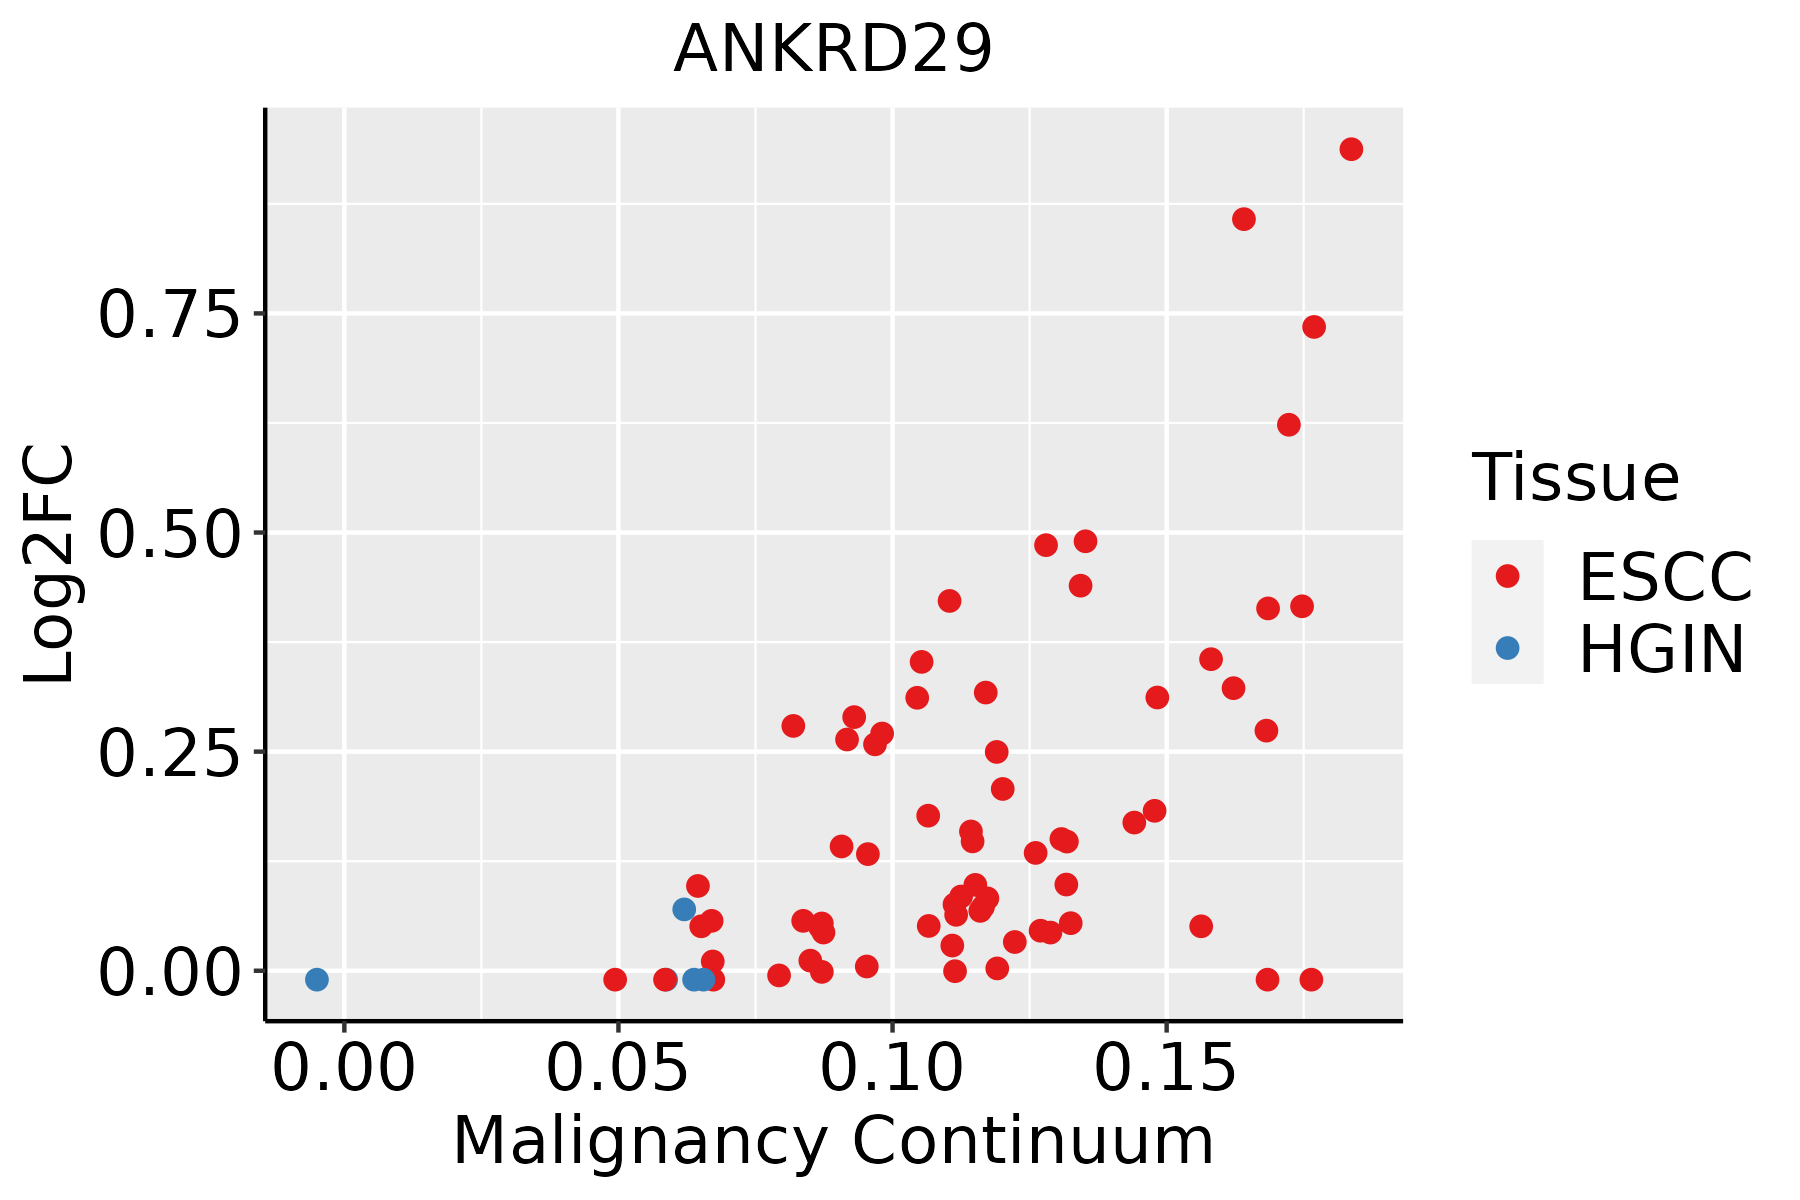 | ESCC: Esophageal squamous cell carcinoma |
| HGIN: High-grade intraepithelial neoplasias | ||
| LGIN: Low-grade intraepithelial neoplasias | ||
| Oral Cavity | 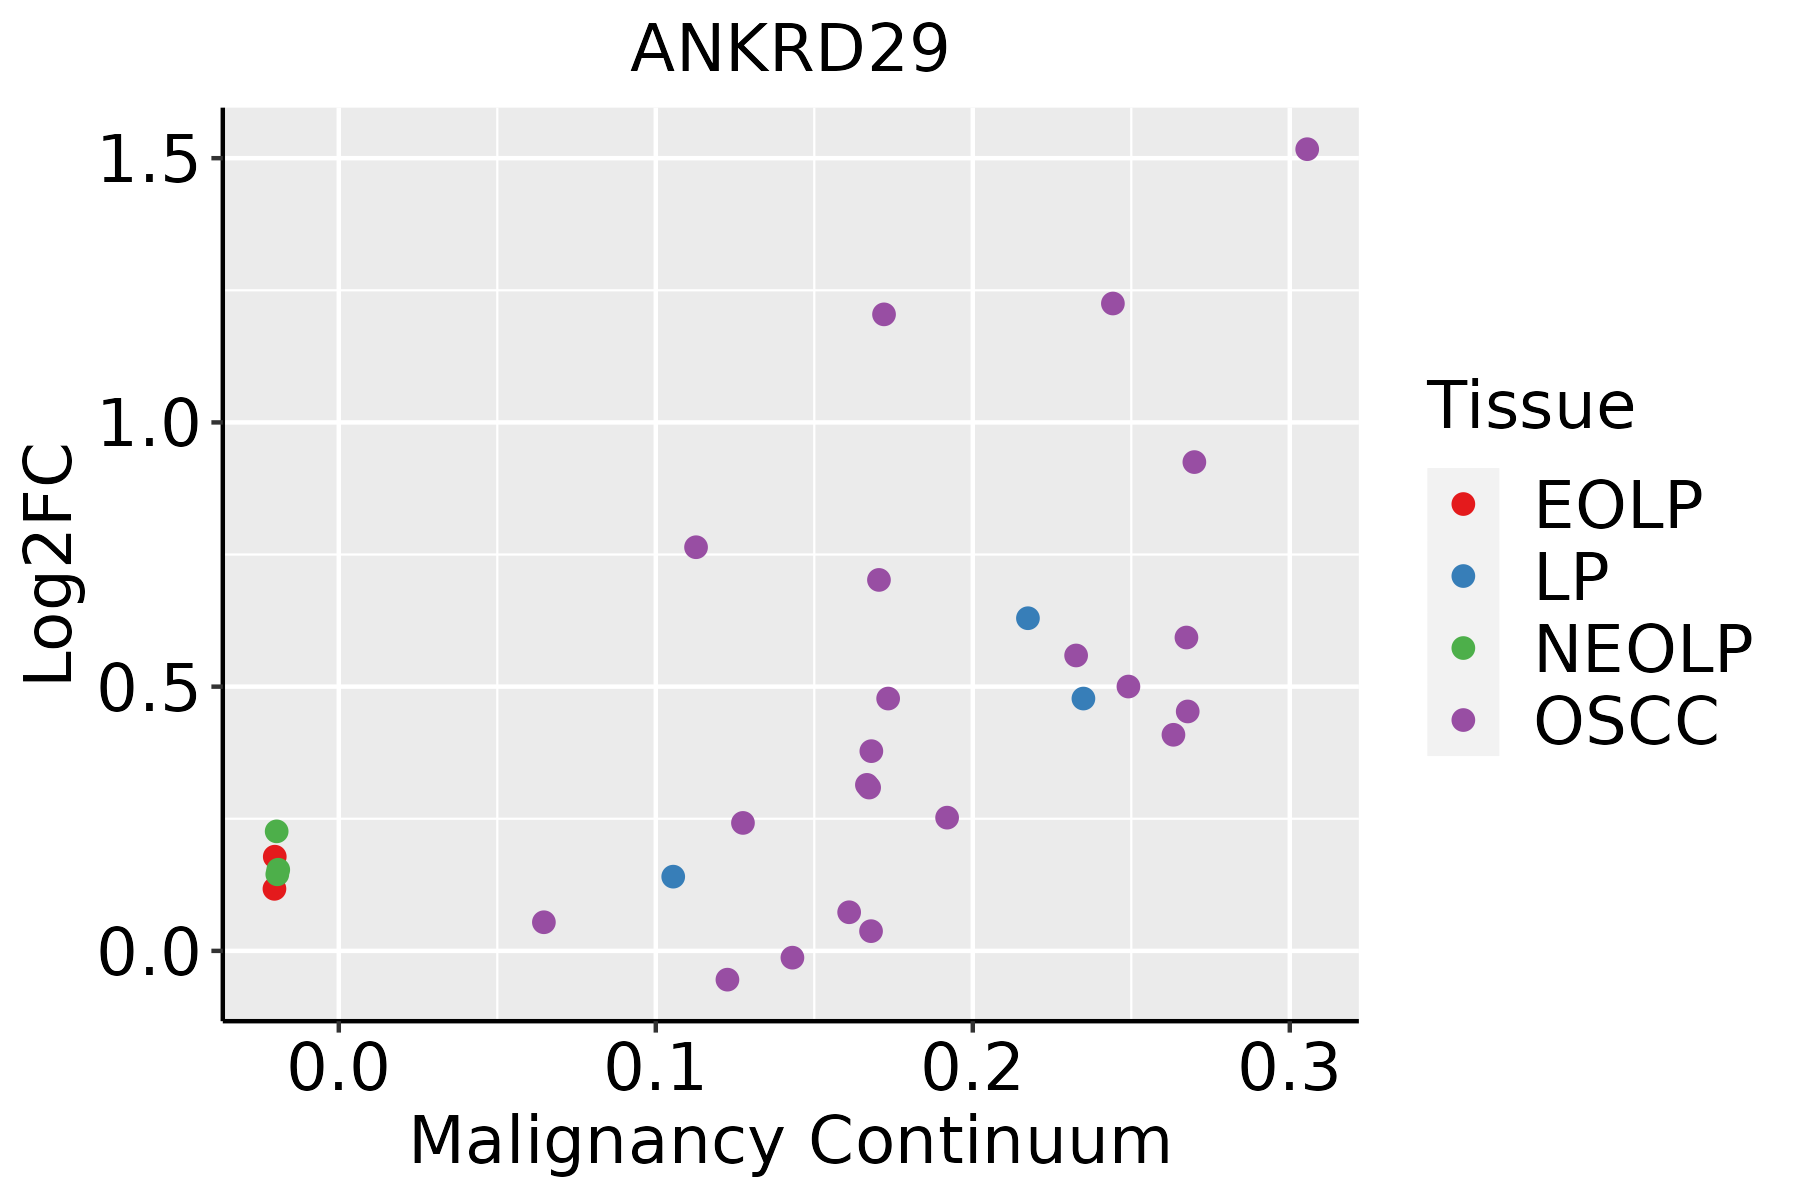 | EOLP: Erosive Oral lichen planus |
| LP: leukoplakia | ||
| NEOLP: Non-erosive oral lichen planus | ||
| OSCC: Oral squamous cell carcinoma | ||
| Skin | 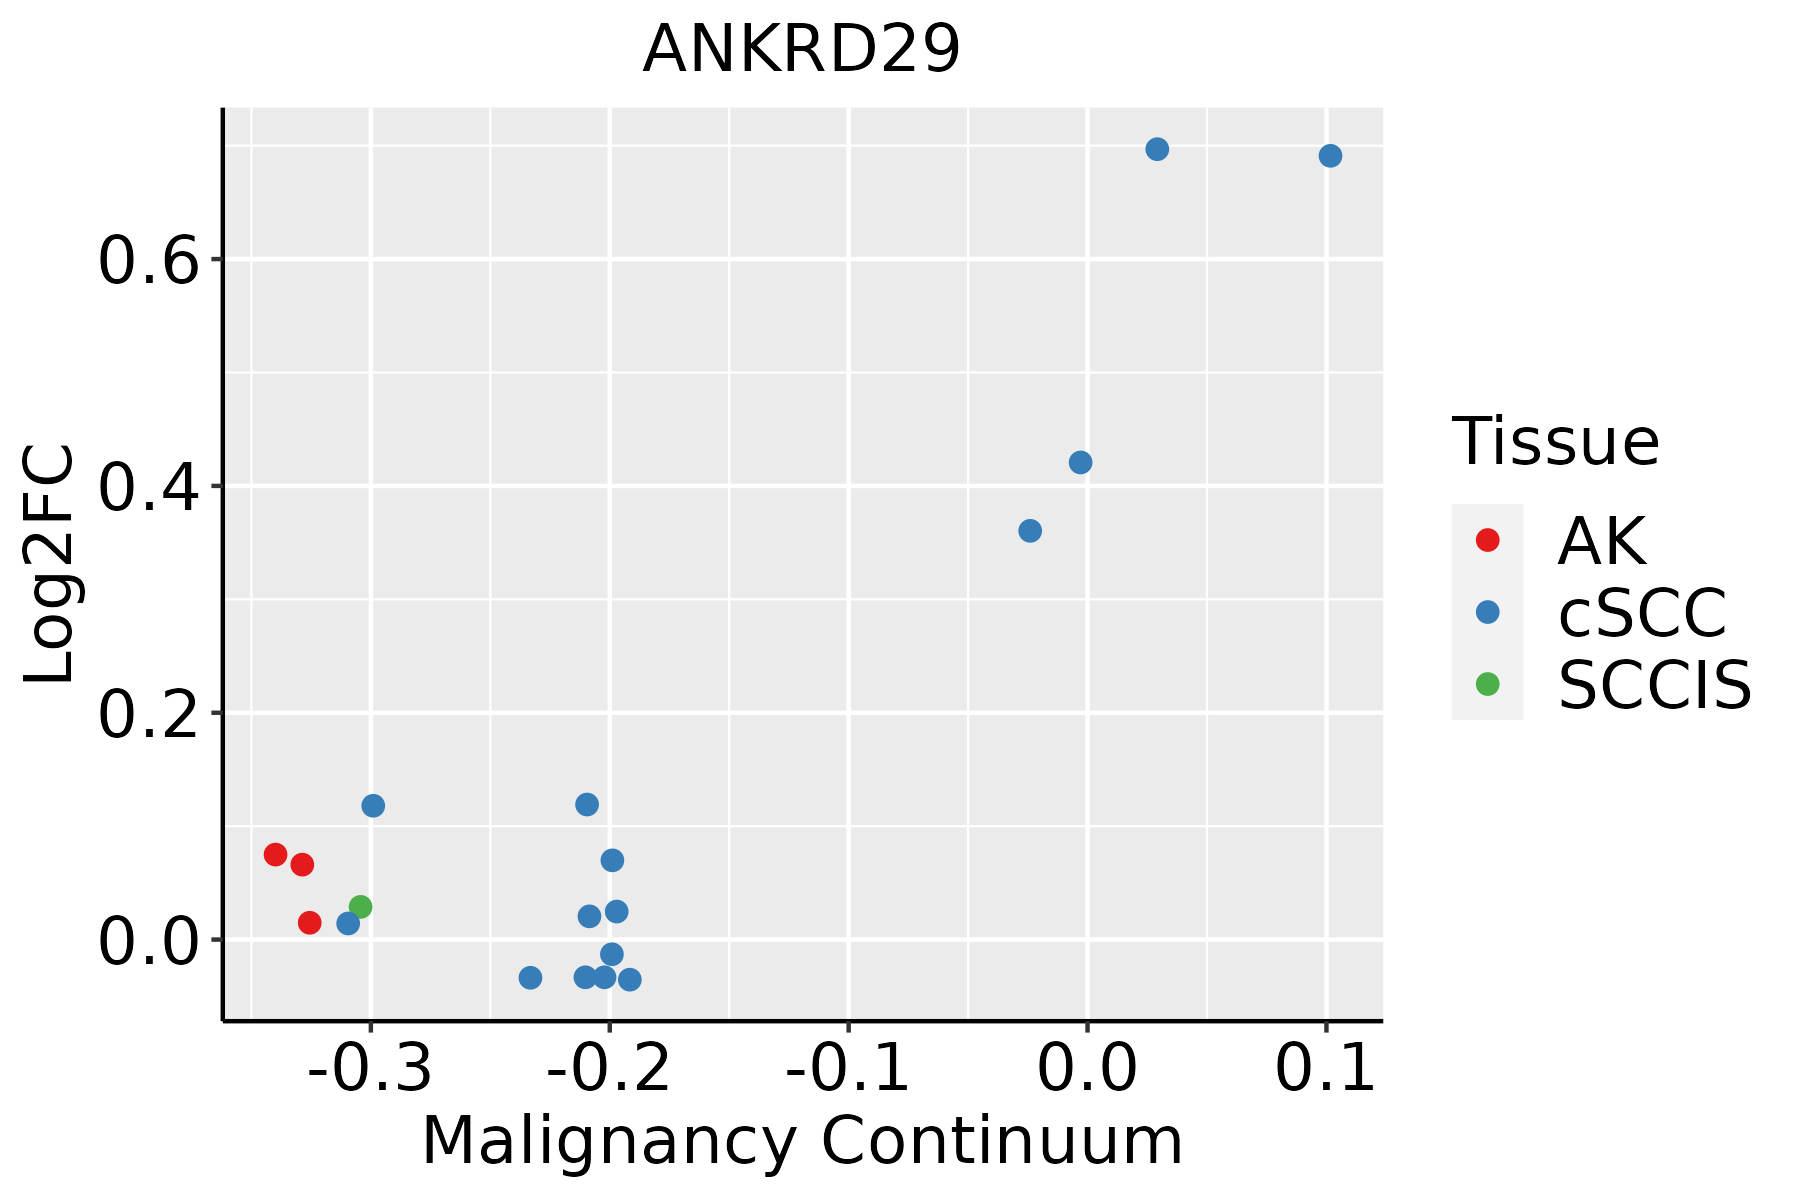 | AK: Actinic keratosis |
| cSCC: Cutaneous squamous cell carcinoma | ||
| SCCIS:squamous cell carcinoma in situ |
| ∗log2FC in expression of this searched gene in stem-like cells from each diseased tissue sample relative to stem-like cells in normal samples in each tissue plotted against the malignancy continuum. Samples are colored based on if they are from different disease stage. |
Top |
Malignant transformation related pathway analysis |
| Find out the enriched GO biological processes and KEGG pathways involved in transition from healthy to precancer to cancer |
| Tissue | Disease Stage | Enriched GO biological Processes |
| Colorectum | AD |  |
| Colorectum | SER |  |
| Colorectum | MSS |  |
| Colorectum | MSI-H |  |
| Colorectum | FAP |  |
| ∗Top 15 enriched GO BP terms are showed in the bar plot of each disease state in each tissue. Each row represents a significant GO biological process which is colored according to the -log10(p.adjust). |
| Page: 1 2 3 4 5 6 7 8 9 |
| GO ID | Tissue | Disease Stage | Description | Gene Ratio | Bg Ratio | pvalue | p.adjust | Count |
| Page: 1 |
| Pathway ID | Tissue | Disease Stage | Description | Gene Ratio | Bg Ratio | pvalue | p.adjust | qvalue | Count |
| Page: 1 |
Top |
Cell-cell communication analysis |
| Identification of potential cell-cell interactions between two cell types and their ligand-receptor pairs for different disease states |
| Ligand | Receptor | LRpair | Pathway | Tissue | Disease Stage |
| Page: 1 |
Top |
Single-cell gene regulatory network inference analysis |
| Find out the significant the regulons (TFs) and the target genes of each regulon across cell types for different disease states |
| TF | Cell Type | Tissue | Disease Stage | Target Gene | RSS | Regulon Activity |
| ∗The dot plots of a searched regulon are shown for all cell subpopulations in each disease state of each tissue based on the regulon specific score inferred using pySCENIC and by calculating the average expression. |
| Page: 1 |
Top |
Somatic mutation of malignant transformation related genes |
| Annotation of somatic variants for genes involved in malignant transformation |
| Hugo Symbol | Variant Class | Variant Classification | dbSNP RS | HGVSc | HGVSp | HGVSp Short | SWISSPROT | BIOTYPE | SIFT | PolyPhen | Tumor Sample Barcode | Tissue | Histology | Sex | Age | Stage | Therapy Types | Drugs | Outcome |
| ANKRD29 | SNV | Missense_Mutation | c.648N>C | p.Leu216Phe | p.L216F | Q8N6D5 | protein_coding | tolerated(1) | benign(0.031) | TCGA-C8-A27B-01 | Breast | breast invasive carcinoma | Female | <65 | I/II | Chemotherapy | 5-fluorouracil | CR | |
| ANKRD29 | insertion | Frame_Shift_Ins | novel | c.336_337insCTGGACT | p.Gly113LeufsTer30 | p.G113Lfs*30 | Q8N6D5 | protein_coding | TCGA-A8-A06P-01 | Breast | breast invasive carcinoma | Female | <65 | III/IV | Unspecific | SD | |||
| ANKRD29 | SNV | Missense_Mutation | rs754976508 | c.367N>A | p.Gly123Arg | p.G123R | Q8N6D5 | protein_coding | deleterious(0) | probably_damaging(1) | TCGA-VS-A9U5-01 | Cervix | cervical & endocervical cancer | Female | <65 | I/II | Chemotherapy | cisplatin | CR |
| ANKRD29 | SNV | Missense_Mutation | c.356N>T | p.Ala119Val | p.A119V | Q8N6D5 | protein_coding | deleterious(0) | probably_damaging(0.996) | TCGA-AA-3811-01 | Colorectum | colon adenocarcinoma | Female | >=65 | III/IV | Unknown | Unknown | PD | |
| ANKRD29 | SNV | Missense_Mutation | novel | c.343N>A | p.Ala115Thr | p.A115T | Q8N6D5 | protein_coding | deleterious(0.04) | probably_damaging(0.997) | TCGA-A5-A0G1-01 | Endometrium | uterine corpus endometrioid carcinoma | Female | >=65 | I/II | Unknown | Unknown | SD |
| ANKRD29 | SNV | Missense_Mutation | c.26N>C | p.Glu9Ala | p.E9A | Q8N6D5 | protein_coding | deleterious(0) | possibly_damaging(0.525) | TCGA-AP-A056-01 | Endometrium | uterine corpus endometrioid carcinoma | Female | <65 | I/II | Unknown | Unknown | SD | |
| ANKRD29 | SNV | Missense_Mutation | novel | c.288N>C | p.Arg96Ser | p.R96S | Q8N6D5 | protein_coding | tolerated(0.24) | benign(0.061) | TCGA-AP-A1E0-01 | Endometrium | uterine corpus endometrioid carcinoma | Female | <65 | III/IV | Chemotherapy | paclitaxel | SD |
| ANKRD29 | SNV | Missense_Mutation | rs368245092 | c.869N>A | p.Arg290His | p.R290H | Q8N6D5 | protein_coding | tolerated(0.06) | benign(0.003) | TCGA-AX-A06F-01 | Endometrium | uterine corpus endometrioid carcinoma | Female | <65 | III/IV | Chemotherapy | carboplatin | SD |
| ANKRD29 | SNV | Missense_Mutation | rs372274223 | c.859C>T | p.Arg287Cys | p.R287C | Q8N6D5 | protein_coding | deleterious(0) | possibly_damaging(0.791) | TCGA-AX-A0J1-01 | Endometrium | uterine corpus endometrioid carcinoma | Female | >=65 | I/II | Unknown | Unknown | SD |
| ANKRD29 | SNV | Missense_Mutation | novel | c.902N>A | p.Ser301Asn | p.S301N | Q8N6D5 | protein_coding | tolerated_low_confidence(0.1) | benign(0) | TCGA-AX-A1CE-01 | Endometrium | uterine corpus endometrioid carcinoma | Female | <65 | I/II | Unspecific | Paclitaxel | SD |
| Page: 1 2 3 |
Top |
Related drugs of malignant transformation related genes |
| Identification of chemicals and drugs interact with genes involved in malignant transfromation |
| (DGIdb 4.0) |
| Entrez ID | Symbol | Category | Interaction Types | Drug Claim Name | Drug Name | PMIDs |
| Page: 1 |

Copyright 2023-Present -The University of Texas Health Science Center at Houston |