
|
|||||
|
 | |
| |
| |
| |
| |
| |
|
Gene: ANKRD22 |
Gene summary for ANKRD22 |
| Gene information | Species | Human | Gene symbol | ANKRD22 | Gene ID | 118932 |
| Gene name | ankyrin repeat domain 22 | |
| Gene Alias | ANKRD22 | |
| Cytomap | 10q23.31 | |
| Gene Type | protein-coding | GO ID | NA | UniProtAcc | Q5VYY1 |
Top |
Malignant transformation analysis |
| Identification of the aberrant gene expression in precancerous and cancerous lesions by comparing the gene expression of stem-like cells in diseased tissues with normal stem cells |
| Entrez ID | Symbol | Replicates | Species | Organ | Tissue | Adj P-value | Log2FC | Malignancy |
| 118932 | ANKRD22 | C38 | Human | Oral cavity | OSCC | 3.10e-09 | 5.97e-01 | 0.172 |
| 118932 | ANKRD22 | C43 | Human | Oral cavity | OSCC | 4.33e-59 | 8.78e-01 | 0.1704 |
| 118932 | ANKRD22 | C46 | Human | Oral cavity | OSCC | 1.69e-31 | 6.61e-01 | 0.1673 |
| 118932 | ANKRD22 | C57 | Human | Oral cavity | OSCC | 1.58e-27 | 7.78e-01 | 0.1679 |
| 118932 | ANKRD22 | C08 | Human | Oral cavity | OSCC | 3.50e-02 | 9.38e-02 | 0.1919 |
| 118932 | ANKRD22 | LN46 | Human | Oral cavity | OSCC | 1.40e-32 | 8.92e-01 | 0.1666 |
| 118932 | ANKRD22 | SYSMH1 | Human | Oral cavity | OSCC | 1.22e-15 | 3.79e-01 | 0.1127 |
| 118932 | ANKRD22 | SYSMH2 | Human | Oral cavity | OSCC | 6.01e-03 | 8.84e-02 | 0.2326 |
| 118932 | ANKRD22 | Pat01-B | Human | Stomach | GC | 8.00e-15 | -4.93e-01 | 0.5754 |
| 118932 | ANKRD22 | Pat02-B | Human | Stomach | GC | 6.70e-44 | -2.84e-01 | 0.0368 |
| 118932 | ANKRD22 | Pat03-B | Human | Stomach | GC | 8.59e-17 | -5.60e-01 | 0.3693 |
| 118932 | ANKRD22 | Pat04-B | Human | Stomach | GC | 7.01e-18 | -3.81e-01 | -0.1483 |
| 118932 | ANKRD22 | Pat05-B | Human | Stomach | GC | 1.98e-07 | -3.12e-01 | -0.0353 |
| 118932 | ANKRD22 | Pat06-B | Human | Stomach | GC | 3.88e-34 | -2.16e-01 | -0.1961 |
| 118932 | ANKRD22 | Pat09-B | Human | Stomach | GC | 2.94e-07 | -4.43e-01 | -0.0359 |
| 118932 | ANKRD22 | Pat11-B | Human | Stomach | GC | 1.29e-11 | -2.24e-01 | -0.182 |
| 118932 | ANKRD22 | Pat12-B | Human | Stomach | GC | 8.54e-17 | -5.56e-01 | 0.0325 |
| 118932 | ANKRD22 | Pat13-B | Human | Stomach | GC | 4.09e-03 | -5.54e-01 | 0.0555 |
| 118932 | ANKRD22 | Pat15-B | Human | Stomach | GC | 5.22e-16 | -2.08e-01 | -0.0778 |
| 118932 | ANKRD22 | Pat16-B | Human | Stomach | GC | 9.60e-08 | -5.23e-01 | 0.1918 |
| Page: 1 2 |
| Tissue | Expression Dynamics | Abbreviation |
| GC | 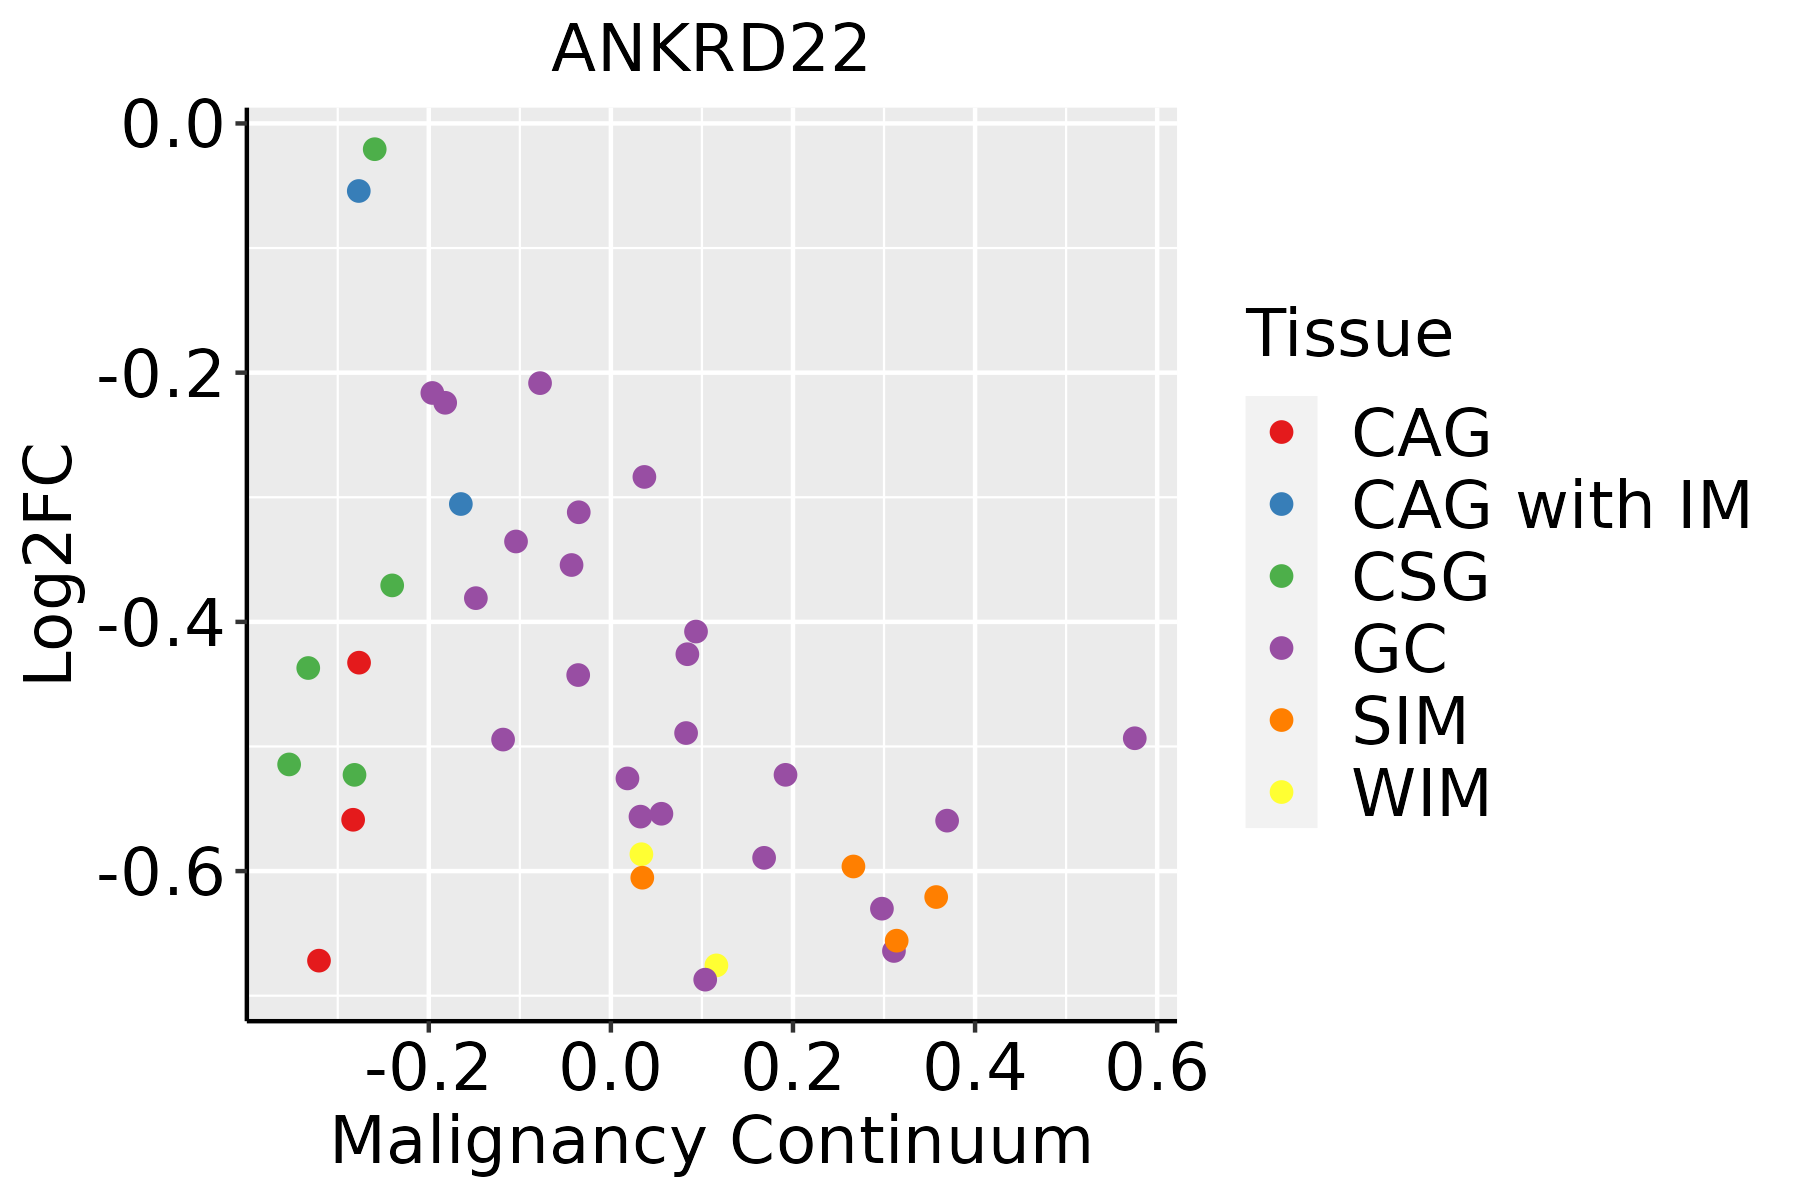 | CAG: Chronic atrophic gastritis |
| CAG with IM: Chronic atrophic gastritis with intestinal metaplasia | ||
| CSG: Chronic superficial gastritis | ||
| GC: Gastric cancer | ||
| SIM: Severe intestinal metaplasia | ||
| WIM: Wild intestinal metaplasia | ||
| Oral Cavity |  | EOLP: Erosive Oral lichen planus |
| LP: leukoplakia | ||
| NEOLP: Non-erosive oral lichen planus | ||
| OSCC: Oral squamous cell carcinoma |
| ∗log2FC in expression of this searched gene in stem-like cells from each diseased tissue sample relative to stem-like cells in normal samples in each tissue plotted against the malignancy continuum. Samples are colored based on if they are from different disease stage. |
Top |
Malignant transformation related pathway analysis |
| Find out the enriched GO biological processes and KEGG pathways involved in transition from healthy to precancer to cancer |
| Tissue | Disease Stage | Enriched GO biological Processes |
| Colorectum | AD |  |
| Colorectum | SER |  |
| Colorectum | MSS |  |
| Colorectum | MSI-H |  |
| Colorectum | FAP |  |
| ∗Top 15 enriched GO BP terms are showed in the bar plot of each disease state in each tissue. Each row represents a significant GO biological process which is colored according to the -log10(p.adjust). |
| Page: 1 2 3 4 5 6 7 8 9 |
| GO ID | Tissue | Disease Stage | Description | Gene Ratio | Bg Ratio | pvalue | p.adjust | Count |
| Page: 1 |
| Pathway ID | Tissue | Disease Stage | Description | Gene Ratio | Bg Ratio | pvalue | p.adjust | qvalue | Count |
| Page: 1 |
Top |
Cell-cell communication analysis |
| Identification of potential cell-cell interactions between two cell types and their ligand-receptor pairs for different disease states |
| Ligand | Receptor | LRpair | Pathway | Tissue | Disease Stage |
| Page: 1 |
Top |
Single-cell gene regulatory network inference analysis |
| Find out the significant the regulons (TFs) and the target genes of each regulon across cell types for different disease states |
| TF | Cell Type | Tissue | Disease Stage | Target Gene | RSS | Regulon Activity |
| ∗The dot plots of a searched regulon are shown for all cell subpopulations in each disease state of each tissue based on the regulon specific score inferred using pySCENIC and by calculating the average expression. |
| Page: 1 |
Top |
Somatic mutation of malignant transformation related genes |
| Annotation of somatic variants for genes involved in malignant transformation |
| Hugo Symbol | Variant Class | Variant Classification | dbSNP RS | HGVSc | HGVSp | HGVSp Short | SWISSPROT | BIOTYPE | SIFT | PolyPhen | Tumor Sample Barcode | Tissue | Histology | Sex | Age | Stage | Therapy Types | Drugs | Outcome |
| ANKRD22 | SNV | Missense_Mutation | novel | c.428N>A | p.Cys143Tyr | p.C143Y | Q5VYY1 | protein_coding | deleterious(0.01) | probably_damaging(0.999) | TCGA-MS-A51U-01 | Breast | breast invasive carcinoma | Female | <65 | I/II | Chemotherapy | adriamycin | SD |
| ANKRD22 | SNV | Missense_Mutation | c.17C>G | p.Ser6Cys | p.S6C | Q5VYY1 | protein_coding | deleterious(0) | benign(0.174) | TCGA-DR-A0ZM-01 | Cervix | cervical & endocervical cancer | Female | <65 | III/IV | Unspecific | Cisplatin | SD | |
| ANKRD22 | SNV | Missense_Mutation | c.133N>C | p.Ile45Leu | p.I45L | Q5VYY1 | protein_coding | deleterious(0.04) | probably_damaging(0.981) | TCGA-AA-3663-01 | Colorectum | colon adenocarcinoma | Male | <65 | I/II | Unknown | Unknown | SD | |
| ANKRD22 | SNV | Missense_Mutation | c.5N>A | p.Gly2Glu | p.G2E | Q5VYY1 | protein_coding | deleterious_low_confidence(0) | probably_damaging(0.998) | TCGA-AZ-6599-01 | Colorectum | colon adenocarcinoma | Male | >=65 | I/II | Unknown | Unknown | SD | |
| ANKRD22 | SNV | Missense_Mutation | c.28N>C | p.Cys10Arg | p.C10R | Q5VYY1 | protein_coding | deleterious(0) | probably_damaging(0.998) | TCGA-A5-A0GW-01 | Endometrium | uterine corpus endometrioid carcinoma | Female | <65 | I/II | Unknown | Unknown | SD | |
| ANKRD22 | SNV | Missense_Mutation | novel | c.336N>T | p.Lys112Asn | p.K112N | Q5VYY1 | protein_coding | tolerated(0.13) | probably_damaging(0.966) | TCGA-AJ-A3EK-01 | Endometrium | uterine corpus endometrioid carcinoma | Female | <65 | I/II | Chemotherapy | carboplatin | CR |
| ANKRD22 | SNV | Missense_Mutation | rs758073859 | c.379G>A | p.Glu127Lys | p.E127K | Q5VYY1 | protein_coding | deleterious(0.01) | benign(0.097) | TCGA-AP-A056-01 | Endometrium | uterine corpus endometrioid carcinoma | Female | <65 | I/II | Unknown | Unknown | SD |
| ANKRD22 | SNV | Missense_Mutation | rs758073859 | c.379N>A | p.Glu127Lys | p.E127K | Q5VYY1 | protein_coding | deleterious(0.01) | benign(0.097) | TCGA-B5-A11E-01 | Endometrium | uterine corpus endometrioid carcinoma | Female | <65 | I/II | Unknown | Unknown | SD |
| ANKRD22 | SNV | Missense_Mutation | novel | c.539N>G | p.Phe180Cys | p.F180C | Q5VYY1 | protein_coding | deleterious(0) | probably_damaging(0.999) | TCGA-BK-A6W3-01 | Endometrium | uterine corpus endometrioid carcinoma | Female | <65 | I/II | Unknown | Unknown | SD |
| ANKRD22 | SNV | Missense_Mutation | rs758073859 | c.379G>A | p.Glu127Lys | p.E127K | Q5VYY1 | protein_coding | deleterious(0.01) | benign(0.097) | TCGA-BS-A0UF-01 | Endometrium | uterine corpus endometrioid carcinoma | Female | >=65 | I/II | Unknown | Unknown | SD |
| Page: 1 2 |
Top |
Related drugs of malignant transformation related genes |
| Identification of chemicals and drugs interact with genes involved in malignant transfromation |
| (DGIdb 4.0) |
| Entrez ID | Symbol | Category | Interaction Types | Drug Claim Name | Drug Name | PMIDs |
| Page: 1 |

Copyright 2023-Present -The University of Texas Health Science Center at Houston |