
|
|||||
|
 | |
| |
| |
| |
| |
| |
|
Gene: ANKRD13D |
Gene summary for ANKRD13D |
| Gene information | Species | Human | Gene symbol | ANKRD13D | Gene ID | 338692 |
| Gene name | ankyrin repeat domain 13D | |
| Gene Alias | ANKRD13D | |
| Cytomap | 11q13.2 | |
| Gene Type | protein-coding | GO ID | GO:0002090 | UniProtAcc | A0A024R5D5 |
Top |
Malignant transformation analysis |
| Identification of the aberrant gene expression in precancerous and cancerous lesions by comparing the gene expression of stem-like cells in diseased tissues with normal stem cells |
| Entrez ID | Symbol | Replicates | Species | Organ | Tissue | Adj P-value | Log2FC | Malignancy |
| 338692 | ANKRD13D | LZE2T | Human | Esophagus | ESCC | 9.54e-06 | 4.66e-01 | 0.082 |
| 338692 | ANKRD13D | LZE4T | Human | Esophagus | ESCC | 1.47e-07 | 1.94e-01 | 0.0811 |
| 338692 | ANKRD13D | LZE7T | Human | Esophagus | ESCC | 9.32e-08 | 2.53e-01 | 0.0667 |
| 338692 | ANKRD13D | LZE20T | Human | Esophagus | ESCC | 1.85e-18 | 4.69e-01 | 0.0662 |
| 338692 | ANKRD13D | LZE22D1 | Human | Esophagus | HGIN | 1.24e-04 | 1.53e-01 | 0.0595 |
| 338692 | ANKRD13D | LZE24D1 | Human | Esophagus | HGIN | 3.66e-03 | 8.00e-01 | 0.054 |
| 338692 | ANKRD13D | LZE24T | Human | Esophagus | ESCC | 2.47e-19 | 3.55e-01 | 0.0596 |
| 338692 | ANKRD13D | LZE21T | Human | Esophagus | ESCC | 8.02e-04 | 2.06e-01 | 0.0655 |
| 338692 | ANKRD13D | P1T-E | Human | Esophagus | ESCC | 1.42e-19 | 6.22e-01 | 0.0875 |
| 338692 | ANKRD13D | P2T-E | Human | Esophagus | ESCC | 8.08e-18 | 2.12e-01 | 0.1177 |
| 338692 | ANKRD13D | P4T-E | Human | Esophagus | ESCC | 1.44e-19 | 3.44e-01 | 0.1323 |
| 338692 | ANKRD13D | P5T-E | Human | Esophagus | ESCC | 2.62e-33 | 4.80e-01 | 0.1327 |
| 338692 | ANKRD13D | P8T-E | Human | Esophagus | ESCC | 4.30e-62 | 1.01e+00 | 0.0889 |
| 338692 | ANKRD13D | P9T-E | Human | Esophagus | ESCC | 1.99e-10 | 1.80e-01 | 0.1131 |
| 338692 | ANKRD13D | P10T-E | Human | Esophagus | ESCC | 2.33e-21 | 3.83e-01 | 0.116 |
| 338692 | ANKRD13D | P11T-E | Human | Esophagus | ESCC | 2.10e-10 | 3.28e-01 | 0.1426 |
| 338692 | ANKRD13D | P12T-E | Human | Esophagus | ESCC | 3.31e-31 | 5.48e-01 | 0.1122 |
| 338692 | ANKRD13D | P15T-E | Human | Esophagus | ESCC | 6.22e-32 | 5.09e-01 | 0.1149 |
| 338692 | ANKRD13D | P16T-E | Human | Esophagus | ESCC | 1.31e-16 | 2.97e-01 | 0.1153 |
| 338692 | ANKRD13D | P17T-E | Human | Esophagus | ESCC | 2.68e-03 | 1.09e-01 | 0.1278 |
| Page: 1 2 3 4 5 6 |
| Tissue | Expression Dynamics | Abbreviation |
| Esophagus | 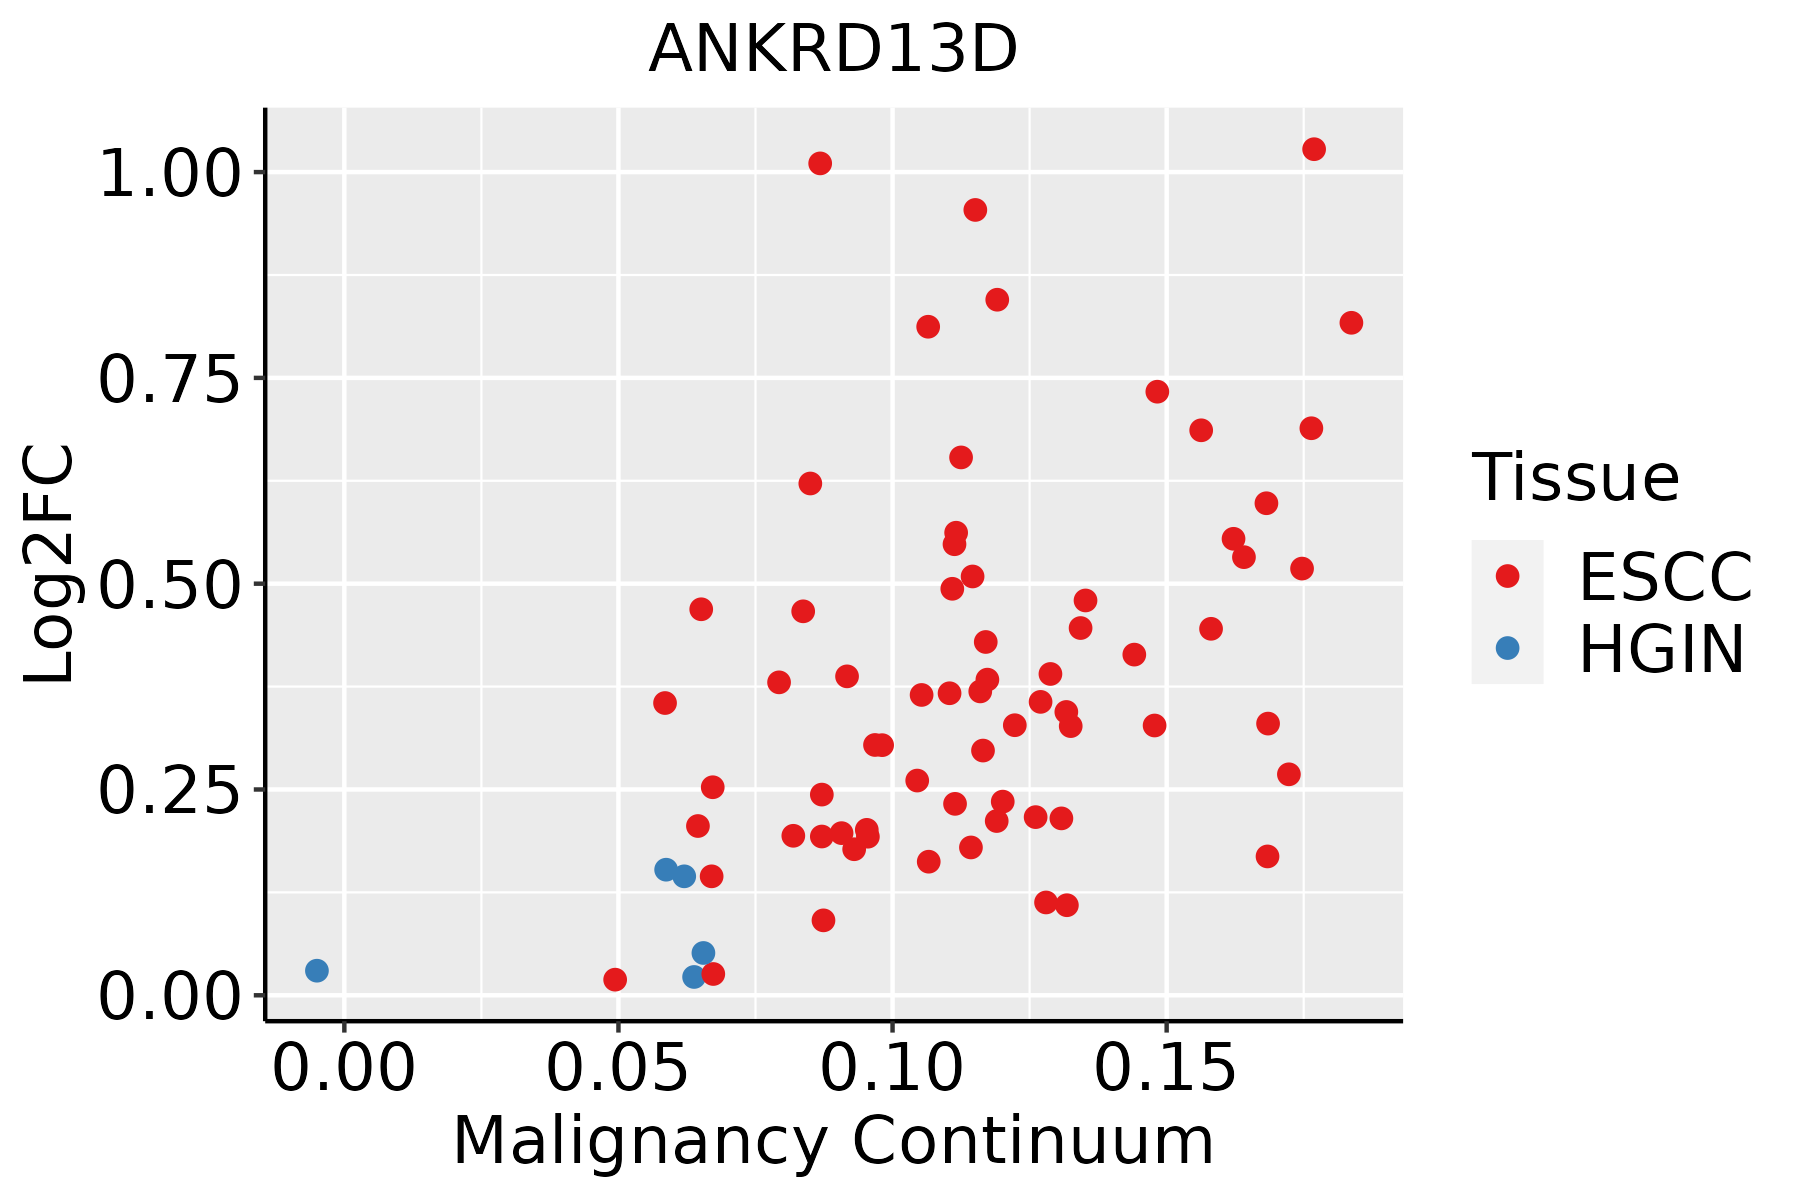 | ESCC: Esophageal squamous cell carcinoma |
| HGIN: High-grade intraepithelial neoplasias | ||
| LGIN: Low-grade intraepithelial neoplasias | ||
| Liver |  | HCC: Hepatocellular carcinoma |
| NAFLD: Non-alcoholic fatty liver disease | ||
| Oral Cavity |  | EOLP: Erosive Oral lichen planus |
| LP: leukoplakia | ||
| NEOLP: Non-erosive oral lichen planus | ||
| OSCC: Oral squamous cell carcinoma | ||
| Thyroid | 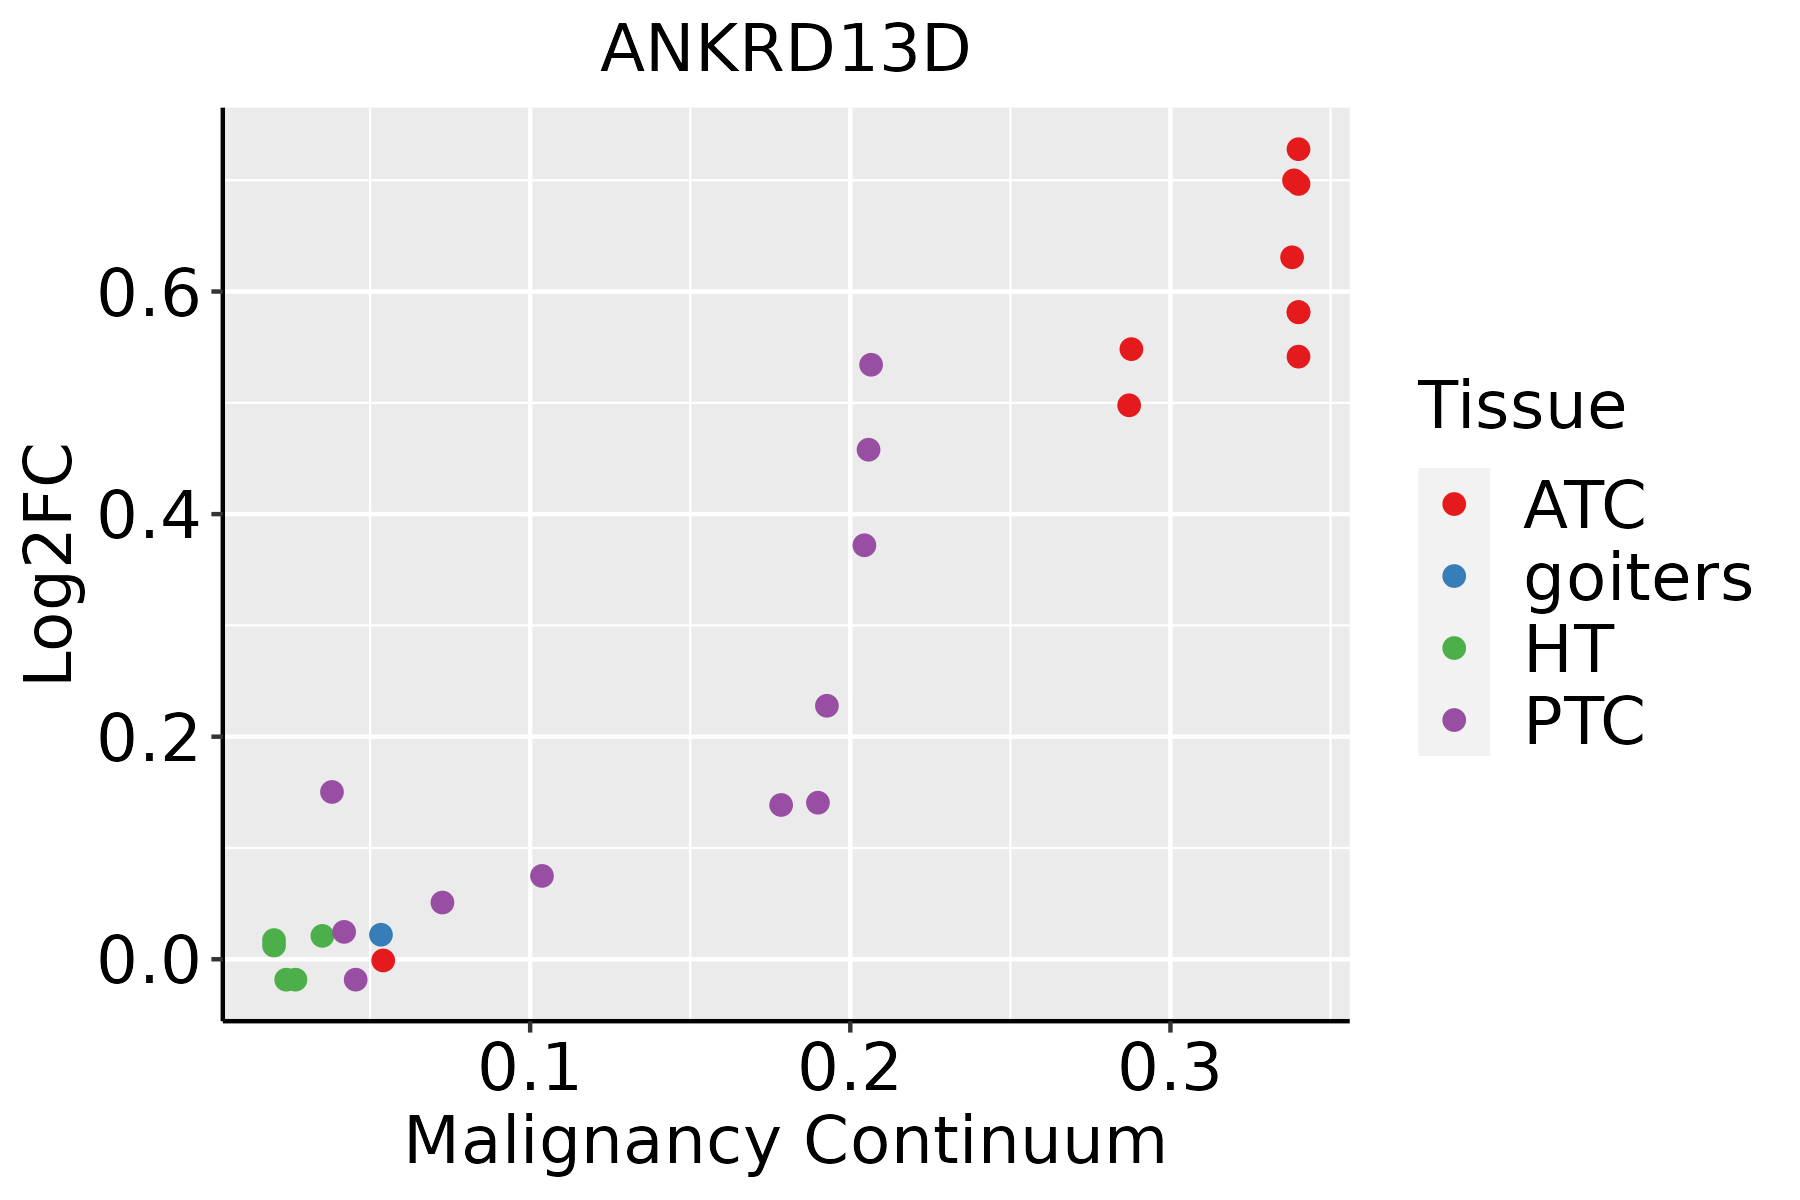 | ATC: Anaplastic thyroid cancer |
| HT: Hashimoto's thyroiditis | ||
| PTC: Papillary thyroid cancer |
| ∗log2FC in expression of this searched gene in stem-like cells from each diseased tissue sample relative to stem-like cells in normal samples in each tissue plotted against the malignancy continuum. Samples are colored based on if they are from different disease stage. |
Top |
Malignant transformation related pathway analysis |
| Find out the enriched GO biological processes and KEGG pathways involved in transition from healthy to precancer to cancer |
| Tissue | Disease Stage | Enriched GO biological Processes |
| Colorectum | AD |  |
| Colorectum | SER |  |
| Colorectum | MSS |  |
| Colorectum | MSI-H |  |
| Colorectum | FAP |  |
| ∗Top 15 enriched GO BP terms are showed in the bar plot of each disease state in each tissue. Each row represents a significant GO biological process which is colored according to the -log10(p.adjust). |
| Page: 1 2 3 4 5 6 7 8 9 |
| GO ID | Tissue | Disease Stage | Description | Gene Ratio | Bg Ratio | pvalue | p.adjust | Count |
| GO:004311217 | Esophagus | HGIN | receptor metabolic process | 36/2587 | 166/18723 | 3.60e-03 | 3.29e-02 | 36 |
| GO:003010018 | Esophagus | ESCC | regulation of endocytosis | 135/8552 | 211/18723 | 5.75e-08 | 1.02e-06 | 135 |
| GO:004311218 | Esophagus | ESCC | receptor metabolic process | 104/8552 | 166/18723 | 7.44e-06 | 7.37e-05 | 104 |
| GO:000689818 | Esophagus | ESCC | receptor-mediated endocytosis | 142/8552 | 244/18723 | 5.22e-05 | 4.05e-04 | 142 |
| GO:004825916 | Esophagus | ESCC | regulation of receptor-mediated endocytosis | 66/8552 | 110/18723 | 1.72e-03 | 7.96e-03 | 66 |
| GO:004311221 | Liver | HCC | receptor metabolic process | 96/7958 | 166/18723 | 4.69e-05 | 4.50e-04 | 96 |
| GO:000689821 | Liver | HCC | receptor-mediated endocytosis | 134/7958 | 244/18723 | 5.73e-05 | 5.31e-04 | 134 |
| GO:003010021 | Liver | HCC | regulation of endocytosis | 117/7958 | 211/18723 | 9.56e-05 | 8.32e-04 | 117 |
| GO:004825921 | Liver | HCC | regulation of receptor-mediated endocytosis | 60/7958 | 110/18723 | 7.12e-03 | 2.84e-02 | 60 |
| GO:003010016 | Oral cavity | OSCC | regulation of endocytosis | 121/7305 | 211/18723 | 4.74e-08 | 8.80e-07 | 121 |
| GO:000689810 | Oral cavity | OSCC | receptor-mediated endocytosis | 125/7305 | 244/18723 | 6.56e-05 | 5.32e-04 | 125 |
| GO:004311210 | Oral cavity | OSCC | receptor metabolic process | 88/7305 | 166/18723 | 1.68e-04 | 1.15e-03 | 88 |
| GO:004825910 | Oral cavity | OSCC | regulation of receptor-mediated endocytosis | 58/7305 | 110/18723 | 2.37e-03 | 1.05e-02 | 58 |
| GO:00316239 | Oral cavity | OSCC | receptor internalization | 56/7305 | 113/18723 | 1.44e-02 | 4.69e-02 | 56 |
| GO:003010020 | Thyroid | PTC | regulation of endocytosis | 108/5968 | 211/18723 | 3.92e-09 | 1.04e-07 | 108 |
| GO:0006898110 | Thyroid | PTC | receptor-mediated endocytosis | 112/5968 | 244/18723 | 2.87e-06 | 3.74e-05 | 112 |
| GO:004825918 | Thyroid | PTC | regulation of receptor-mediated endocytosis | 55/5968 | 110/18723 | 5.64e-05 | 4.99e-04 | 55 |
| GO:004311219 | Thyroid | PTC | receptor metabolic process | 77/5968 | 166/18723 | 6.21e-05 | 5.47e-04 | 77 |
| GO:00510518 | Thyroid | PTC | negative regulation of transport | 176/5968 | 470/18723 | 5.44e-03 | 2.49e-02 | 176 |
| GO:0030100111 | Thyroid | ATC | regulation of endocytosis | 113/6293 | 211/18723 | 1.71e-09 | 4.22e-08 | 113 |
| Page: 1 2 |
| Pathway ID | Tissue | Disease Stage | Description | Gene Ratio | Bg Ratio | pvalue | p.adjust | qvalue | Count |
| Page: 1 |
Top |
Cell-cell communication analysis |
| Identification of potential cell-cell interactions between two cell types and their ligand-receptor pairs for different disease states |
| Ligand | Receptor | LRpair | Pathway | Tissue | Disease Stage |
| Page: 1 |
Top |
Single-cell gene regulatory network inference analysis |
| Find out the significant the regulons (TFs) and the target genes of each regulon across cell types for different disease states |
| TF | Cell Type | Tissue | Disease Stage | Target Gene | RSS | Regulon Activity |
| ∗The dot plots of a searched regulon are shown for all cell subpopulations in each disease state of each tissue based on the regulon specific score inferred using pySCENIC and by calculating the average expression. |
| Page: 1 |
Top |
Somatic mutation of malignant transformation related genes |
| Annotation of somatic variants for genes involved in malignant transformation |
| Hugo Symbol | Variant Class | Variant Classification | dbSNP RS | HGVSc | HGVSp | HGVSp Short | SWISSPROT | BIOTYPE | SIFT | PolyPhen | Tumor Sample Barcode | Tissue | Histology | Sex | Age | Stage | Therapy Types | Drugs | Outcome |
| ANKRD13D | SNV | Missense_Mutation | c.763G>C | p.Glu255Gln | p.E255Q | Q6ZTN6 | protein_coding | deleterious(0) | probably_damaging(0.982) | TCGA-AC-A23H-01 | Breast | breast invasive carcinoma | Female | >=65 | I/II | Unknown | Unknown | PD | |
| ANKRD13D | SNV | Missense_Mutation | c.173N>C | p.Val58Ala | p.V58A | Q6ZTN6 | protein_coding | tolerated(0.14) | benign(0.332) | TCGA-AO-A128-01 | Breast | breast invasive carcinoma | Female | <65 | I/II | Chemotherapy | doxorubicin | SD | |
| ANKRD13D | SNV | Missense_Mutation | c.498N>A | p.Met166Ile | p.M166I | Q6ZTN6 | protein_coding | deleterious(0.01) | possibly_damaging(0.885) | TCGA-AO-A12D-01 | Breast | breast invasive carcinoma | Female | <65 | I/II | Chemotherapy | cyclophosphamide | SD | |
| ANKRD13D | SNV | Missense_Mutation | rs750361664 | c.784N>A | p.Gly262Ser | p.G262S | Q6ZTN6 | protein_coding | deleterious(0.01) | probably_damaging(1) | TCGA-AR-A1AP-01 | Breast | breast invasive carcinoma | Female | >=65 | I/II | Hormone Therapy | anastrozole | SD |
| ANKRD13D | SNV | Missense_Mutation | rs771324597 | c.1262N>A | p.Arg421His | p.R421H | Q6ZTN6 | protein_coding | deleterious(0.02) | probably_damaging(1) | TCGA-BH-A0DS-01 | Breast | breast invasive carcinoma | Female | >=65 | III/IV | Chemotherapy | cyclophosphamide | SD |
| ANKRD13D | SNV | Missense_Mutation | novel | c.1202N>A | p.Arg401His | p.R401H | Q6ZTN6 | protein_coding | deleterious(0.03) | probably_damaging(0.947) | TCGA-2W-A8YY-01 | Cervix | cervical & endocervical cancer | Female | <65 | I/II | Chemotherapy | cisplatin | CR |
| ANKRD13D | SNV | Missense_Mutation | c.727G>A | p.Glu243Lys | p.E243K | Q6ZTN6 | protein_coding | deleterious(0) | probably_damaging(0.999) | TCGA-DS-A1OC-01 | Cervix | cervical & endocervical cancer | Female | <65 | I/II | Chemotherapy | gemcitabine | SD | |
| ANKRD13D | SNV | Missense_Mutation | c.1660N>T | p.Pro554Ser | p.P554S | Q6ZTN6 | protein_coding | tolerated(1) | benign(0.014) | TCGA-FU-A2QG-01 | Cervix | cervical & endocervical cancer | Female | <65 | I/II | Unknown | Unknown | SD | |
| ANKRD13D | SNV | Missense_Mutation | rs140647228 | c.490G>A | p.Glu164Lys | p.E164K | Q6ZTN6 | protein_coding | deleterious(0) | possibly_damaging(0.701) | TCGA-JW-AAVH-01 | Cervix | cervical & endocervical cancer | Female | <65 | I/II | Unknown | Unknown | SD |
| ANKRD13D | SNV | Missense_Mutation | c.534N>C | p.Lys178Asn | p.K178N | Q6ZTN6 | protein_coding | deleterious(0) | possibly_damaging(0.892) | TCGA-Q1-A6DT-01 | Cervix | cervical & endocervical cancer | Female | <65 | I/II | Unknown | Unknown | PD |
| Page: 1 2 3 4 5 |
Top |
Related drugs of malignant transformation related genes |
| Identification of chemicals and drugs interact with genes involved in malignant transfromation |
| (DGIdb 4.0) |
| Entrez ID | Symbol | Category | Interaction Types | Drug Claim Name | Drug Name | PMIDs |
| Page: 1 |

Copyright 2023-Present -The University of Texas Health Science Center at Houston |