
|
|||||
|
 | |
| |
| |
| |
| |
| |
|
Gene: ANKRD13C |
Gene summary for ANKRD13C |
| Gene information | Species | Human | Gene symbol | ANKRD13C | Gene ID | 81573 |
| Gene name | ankyrin repeat domain 13C | |
| Gene Alias | dJ677H15.3 | |
| Cytomap | 1p31.1 | |
| Gene Type | protein-coding | GO ID | GO:0006621 | UniProtAcc | Q8N6S4 |
Top |
Malignant transformation analysis |
| Identification of the aberrant gene expression in precancerous and cancerous lesions by comparing the gene expression of stem-like cells in diseased tissues with normal stem cells |
| Entrez ID | Symbol | Replicates | Species | Organ | Tissue | Adj P-value | Log2FC | Malignancy |
| 81573 | ANKRD13C | LZE4T | Human | Esophagus | ESCC | 3.19e-07 | 1.58e-01 | 0.0811 |
| 81573 | ANKRD13C | LZE7T | Human | Esophagus | ESCC | 5.01e-03 | 1.20e-01 | 0.0667 |
| 81573 | ANKRD13C | LZE8T | Human | Esophagus | ESCC | 4.00e-04 | 1.07e-01 | 0.067 |
| 81573 | ANKRD13C | LZE20T | Human | Esophagus | ESCC | 8.50e-03 | 5.94e-02 | 0.0662 |
| 81573 | ANKRD13C | LZE24T | Human | Esophagus | ESCC | 5.50e-12 | 2.36e-01 | 0.0596 |
| 81573 | ANKRD13C | P1T-E | Human | Esophagus | ESCC | 2.42e-03 | 1.29e-01 | 0.0875 |
| 81573 | ANKRD13C | P2T-E | Human | Esophagus | ESCC | 5.22e-19 | 2.92e-01 | 0.1177 |
| 81573 | ANKRD13C | P4T-E | Human | Esophagus | ESCC | 1.20e-14 | 2.70e-01 | 0.1323 |
| 81573 | ANKRD13C | P5T-E | Human | Esophagus | ESCC | 4.25e-13 | 1.70e-01 | 0.1327 |
| 81573 | ANKRD13C | P8T-E | Human | Esophagus | ESCC | 1.11e-09 | 1.73e-01 | 0.0889 |
| 81573 | ANKRD13C | P9T-E | Human | Esophagus | ESCC | 1.12e-06 | 7.52e-02 | 0.1131 |
| 81573 | ANKRD13C | P10T-E | Human | Esophagus | ESCC | 1.16e-07 | 2.03e-01 | 0.116 |
| 81573 | ANKRD13C | P11T-E | Human | Esophagus | ESCC | 1.20e-08 | 2.42e-01 | 0.1426 |
| 81573 | ANKRD13C | P12T-E | Human | Esophagus | ESCC | 1.69e-17 | 2.11e-01 | 0.1122 |
| 81573 | ANKRD13C | P15T-E | Human | Esophagus | ESCC | 4.86e-21 | 2.87e-01 | 0.1149 |
| 81573 | ANKRD13C | P16T-E | Human | Esophagus | ESCC | 3.38e-09 | 1.49e-01 | 0.1153 |
| 81573 | ANKRD13C | P17T-E | Human | Esophagus | ESCC | 1.09e-07 | 1.44e-01 | 0.1278 |
| 81573 | ANKRD13C | P19T-E | Human | Esophagus | ESCC | 2.85e-02 | 2.51e-01 | 0.1662 |
| 81573 | ANKRD13C | P20T-E | Human | Esophagus | ESCC | 1.28e-15 | 2.91e-01 | 0.1124 |
| 81573 | ANKRD13C | P21T-E | Human | Esophagus | ESCC | 8.27e-19 | 2.73e-01 | 0.1617 |
| Page: 1 2 3 |
| Tissue | Expression Dynamics | Abbreviation |
| Esophagus | 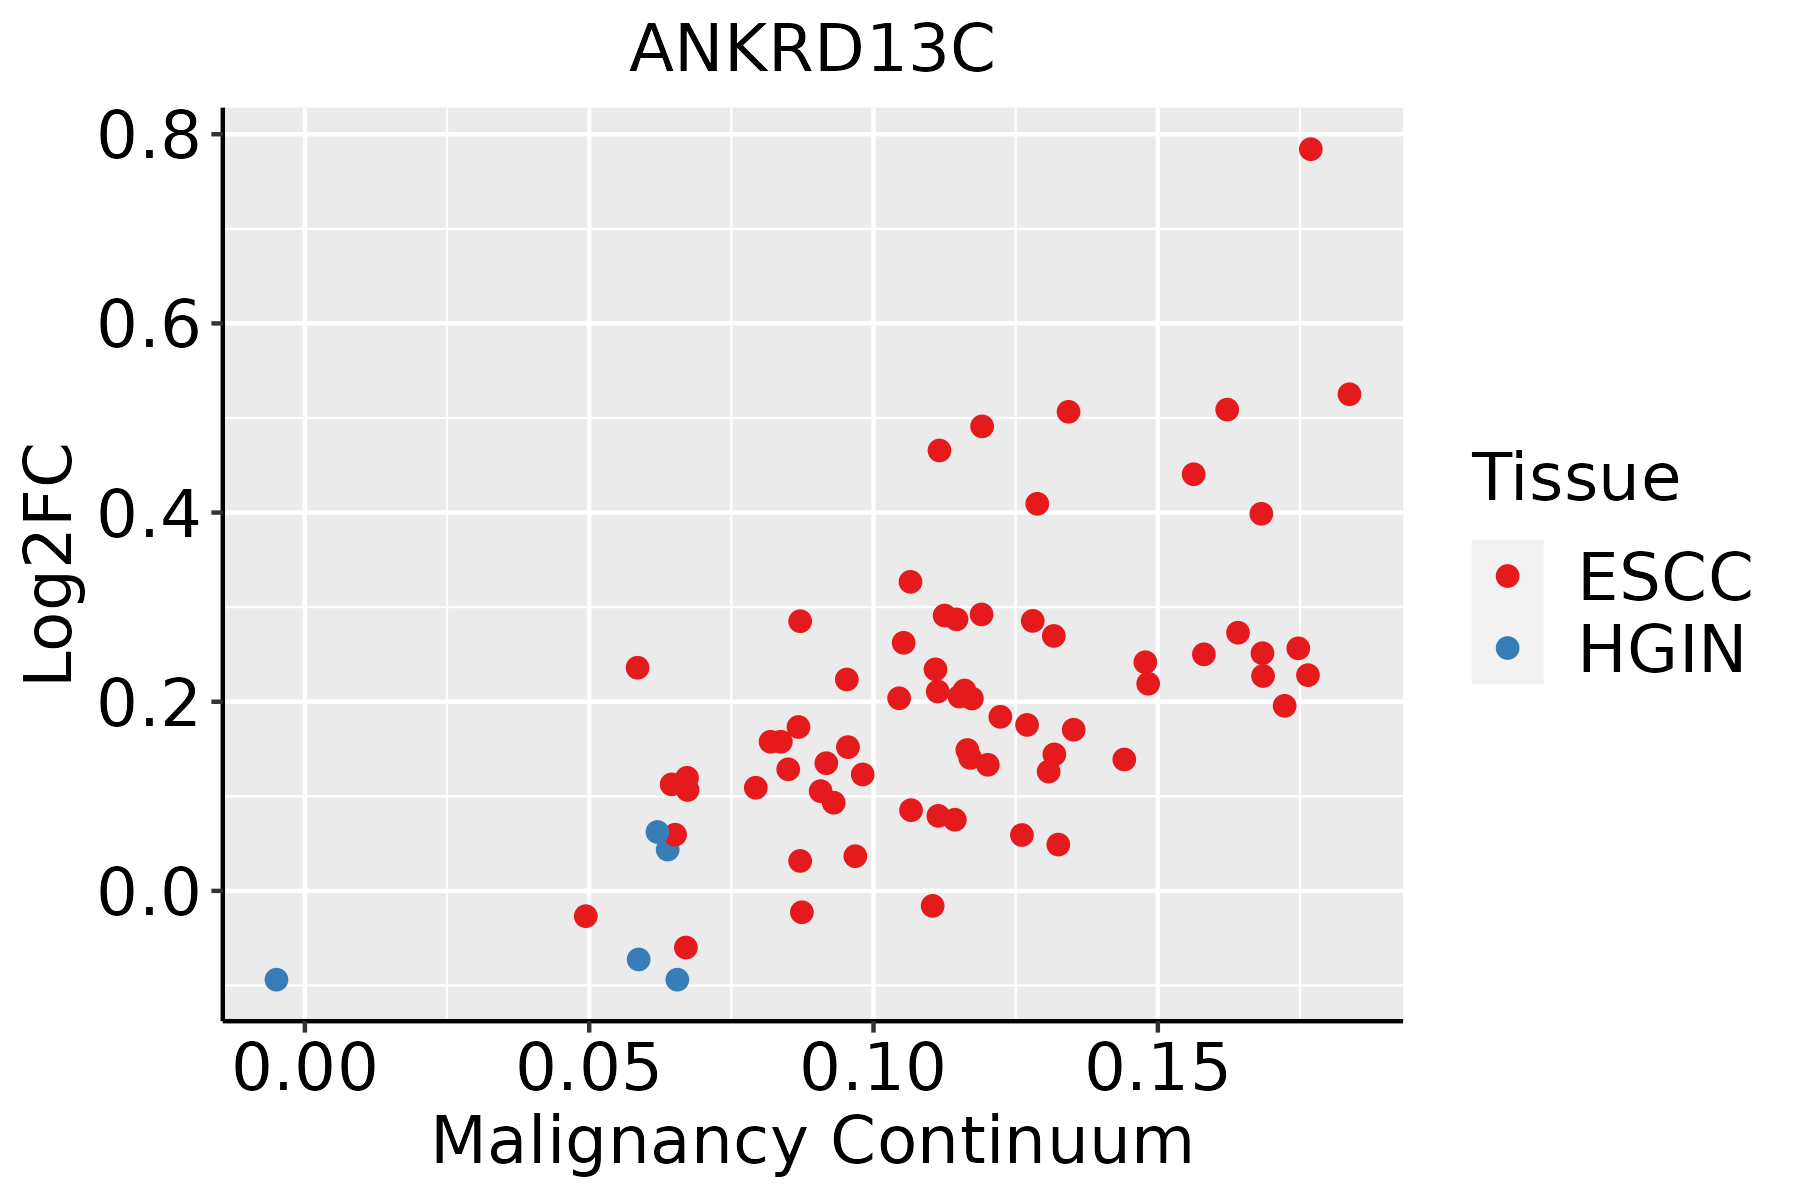 | ESCC: Esophageal squamous cell carcinoma |
| HGIN: High-grade intraepithelial neoplasias | ||
| LGIN: Low-grade intraepithelial neoplasias |
| ∗log2FC in expression of this searched gene in stem-like cells from each diseased tissue sample relative to stem-like cells in normal samples in each tissue plotted against the malignancy continuum. Samples are colored based on if they are from different disease stage. |
Top |
Malignant transformation related pathway analysis |
| Find out the enriched GO biological processes and KEGG pathways involved in transition from healthy to precancer to cancer |
| Tissue | Disease Stage | Enriched GO biological Processes |
| Colorectum | AD |  |
| Colorectum | SER |  |
| Colorectum | MSS |  |
| Colorectum | MSI-H |  |
| Colorectum | FAP |  |
| ∗Top 15 enriched GO BP terms are showed in the bar plot of each disease state in each tissue. Each row represents a significant GO biological process which is colored according to the -log10(p.adjust). |
| Page: 1 2 3 4 5 6 7 8 9 |
| GO ID | Tissue | Disease Stage | Description | Gene Ratio | Bg Ratio | pvalue | p.adjust | Count |
| GO:0045185111 | Esophagus | ESCC | maintenance of protein location | 71/8552 | 94/18723 | 3.41e-09 | 7.24e-08 | 71 |
| GO:0051235110 | Esophagus | ESCC | maintenance of location | 200/8552 | 327/18723 | 1.01e-08 | 2.02e-07 | 200 |
| GO:0032507110 | Esophagus | ESCC | maintenance of protein location in cell | 52/8552 | 65/18723 | 1.41e-08 | 2.77e-07 | 52 |
| GO:007259517 | Esophagus | ESCC | maintenance of protein localization in organelle | 36/8552 | 42/18723 | 8.46e-08 | 1.44e-06 | 36 |
| GO:007097218 | Esophagus | ESCC | protein localization to endoplasmic reticulum | 52/8552 | 74/18723 | 1.58e-05 | 1.42e-04 | 52 |
| GO:0051651111 | Esophagus | ESCC | maintenance of location in cell | 126/8552 | 214/18723 | 6.57e-05 | 5.00e-04 | 126 |
| GO:20002093 | Esophagus | ESCC | regulation of anoikis | 20/8552 | 24/18723 | 1.69e-04 | 1.11e-03 | 20 |
| GO:00432761 | Esophagus | ESCC | anoikis | 26/8552 | 34/18723 | 2.53e-04 | 1.55e-03 | 26 |
| GO:00354377 | Esophagus | ESCC | maintenance of protein localization in endoplasmic reticulum | 11/8552 | 14/18723 | 1.30e-02 | 4.27e-02 | 11 |
| Page: 1 |
| Pathway ID | Tissue | Disease Stage | Description | Gene Ratio | Bg Ratio | pvalue | p.adjust | qvalue | Count |
| Page: 1 |
Top |
Cell-cell communication analysis |
| Identification of potential cell-cell interactions between two cell types and their ligand-receptor pairs for different disease states |
| Ligand | Receptor | LRpair | Pathway | Tissue | Disease Stage |
| Page: 1 |
Top |
Single-cell gene regulatory network inference analysis |
| Find out the significant the regulons (TFs) and the target genes of each regulon across cell types for different disease states |
| TF | Cell Type | Tissue | Disease Stage | Target Gene | RSS | Regulon Activity |
| ∗The dot plots of a searched regulon are shown for all cell subpopulations in each disease state of each tissue based on the regulon specific score inferred using pySCENIC and by calculating the average expression. |
| Page: 1 |
Top |
Somatic mutation of malignant transformation related genes |
| Annotation of somatic variants for genes involved in malignant transformation |
| Hugo Symbol | Variant Class | Variant Classification | dbSNP RS | HGVSc | HGVSp | HGVSp Short | SWISSPROT | BIOTYPE | SIFT | PolyPhen | Tumor Sample Barcode | Tissue | Histology | Sex | Age | Stage | Therapy Types | Drugs | Outcome |
| ANKRD13C | SNV | Missense_Mutation | c.1154G>A | p.Arg385Gln | p.R385Q | Q8N6S4 | protein_coding | deleterious(0.01) | benign(0.349) | TCGA-A8-A07O-01 | Breast | breast invasive carcinoma | Female | <65 | I/II | Chemotherapy | CR | ||
| ANKRD13C | SNV | Missense_Mutation | c.1471C>A | p.Pro491Thr | p.P491T | Q8N6S4 | protein_coding | deleterious(0) | probably_damaging(1) | TCGA-EX-A3L1-01 | Cervix | cervical & endocervical cancer | Female | <65 | I/II | Chemotherapy | cisplatin | CR | |
| ANKRD13C | SNV | Missense_Mutation | c.466A>C | p.Asn156His | p.N156H | Q8N6S4 | protein_coding | tolerated(1) | benign(0.003) | TCGA-FU-A3HZ-01 | Cervix | cervical & endocervical cancer | Female | <65 | I/II | Chemotherapy | cisplatin | CR | |
| ANKRD13C | SNV | Missense_Mutation | c.283N>G | p.Leu95Val | p.L95V | Q8N6S4 | protein_coding | tolerated_low_confidence(0.76) | benign(0.027) | TCGA-JW-A5VJ-01 | Cervix | cervical & endocervical cancer | Female | <65 | I/II | Unknown | Unknown | PD | |
| ANKRD13C | SNV | Missense_Mutation | rs774093011 | c.635G>A | p.Arg212Gln | p.R212Q | Q8N6S4 | protein_coding | tolerated(0.13) | possibly_damaging(0.895) | TCGA-AA-A00N-01 | Colorectum | colon adenocarcinoma | Male | >=65 | I/II | Unknown | Unknown | PD |
| ANKRD13C | SNV | Missense_Mutation | c.1304N>G | p.His435Arg | p.H435R | Q8N6S4 | protein_coding | tolerated(0.61) | benign(0.066) | TCGA-AD-6889-01 | Colorectum | colon adenocarcinoma | Male | >=65 | I/II | Chemotherapy | xeloda | PD | |
| ANKRD13C | SNV | Missense_Mutation | c.1223G>A | p.Arg408Gln | p.R408Q | Q8N6S4 | protein_coding | tolerated(0.12) | probably_damaging(0.989) | TCGA-AZ-4315-01 | Colorectum | colon adenocarcinoma | Male | <65 | I/II | Unknown | Unknown | SD | |
| ANKRD13C | SNV | Missense_Mutation | c.1456N>A | p.Val486Ile | p.V486I | Q8N6S4 | protein_coding | tolerated(0.52) | possibly_damaging(0.557) | TCGA-DM-A1D9-01 | Colorectum | colon adenocarcinoma | Female | >=65 | I/II | Unknown | Unknown | SD | |
| ANKRD13C | SNV | Missense_Mutation | c.1223G>A | p.Arg408Gln | p.R408Q | Q8N6S4 | protein_coding | tolerated(0.12) | probably_damaging(0.989) | TCGA-AG-A002-01 | Colorectum | rectum adenocarcinoma | Male | <65 | I/II | Unknown | Unknown | SD | |
| ANKRD13C | SNV | Missense_Mutation | c.725N>A | p.Arg242Gln | p.R242Q | Q8N6S4 | protein_coding | deleterious(0) | probably_damaging(0.981) | TCGA-A5-A0G1-01 | Endometrium | uterine corpus endometrioid carcinoma | Female | >=65 | I/II | Unknown | Unknown | SD |
| Page: 1 2 3 4 5 6 |
Top |
Related drugs of malignant transformation related genes |
| Identification of chemicals and drugs interact with genes involved in malignant transfromation |
| (DGIdb 4.0) |
| Entrez ID | Symbol | Category | Interaction Types | Drug Claim Name | Drug Name | PMIDs |
| Page: 1 |

Copyright 2023-Present -The University of Texas Health Science Center at Houston |