
|
|||||
|
 | |
| |
| |
| |
| |
| |
|
Gene: ANKRD13A |
Gene summary for ANKRD13A |
| Gene information | Species | Human | Gene symbol | ANKRD13A | Gene ID | 88455 |
| Gene name | ankyrin repeat domain 13A | |
| Gene Alias | ANKRD13 | |
| Cytomap | 12q24.11 | |
| Gene Type | protein-coding | GO ID | GO:0002090 | UniProtAcc | Q3ZTS7 |
Top |
Malignant transformation analysis |
| Identification of the aberrant gene expression in precancerous and cancerous lesions by comparing the gene expression of stem-like cells in diseased tissues with normal stem cells |
| Entrez ID | Symbol | Replicates | Species | Organ | Tissue | Adj P-value | Log2FC | Malignancy |
| 88455 | ANKRD13A | LZE5T | Human | Esophagus | ESCC | 9.13e-04 | 2.30e-01 | 0.0514 |
| 88455 | ANKRD13A | LZE24T | Human | Esophagus | ESCC | 1.06e-10 | 4.35e-01 | 0.0596 |
| 88455 | ANKRD13A | P1T-E | Human | Esophagus | ESCC | 2.30e-09 | 5.07e-01 | 0.0875 |
| 88455 | ANKRD13A | P2T-E | Human | Esophagus | ESCC | 4.60e-20 | 2.87e-01 | 0.1177 |
| 88455 | ANKRD13A | P4T-E | Human | Esophagus | ESCC | 1.02e-13 | 2.14e-01 | 0.1323 |
| 88455 | ANKRD13A | P5T-E | Human | Esophagus | ESCC | 7.76e-04 | 3.92e-02 | 0.1327 |
| 88455 | ANKRD13A | P8T-E | Human | Esophagus | ESCC | 9.62e-14 | 2.91e-01 | 0.0889 |
| 88455 | ANKRD13A | P10T-E | Human | Esophagus | ESCC | 2.45e-11 | 1.42e-01 | 0.116 |
| 88455 | ANKRD13A | P12T-E | Human | Esophagus | ESCC | 2.27e-07 | 9.97e-02 | 0.1122 |
| 88455 | ANKRD13A | P15T-E | Human | Esophagus | ESCC | 1.06e-06 | 1.75e-01 | 0.1149 |
| 88455 | ANKRD13A | P16T-E | Human | Esophagus | ESCC | 1.12e-03 | 7.54e-02 | 0.1153 |
| 88455 | ANKRD13A | P20T-E | Human | Esophagus | ESCC | 8.82e-05 | 6.87e-02 | 0.1124 |
| 88455 | ANKRD13A | P21T-E | Human | Esophagus | ESCC | 4.38e-08 | 1.85e-01 | 0.1617 |
| 88455 | ANKRD13A | P22T-E | Human | Esophagus | ESCC | 5.29e-06 | 6.28e-02 | 0.1236 |
| 88455 | ANKRD13A | P23T-E | Human | Esophagus | ESCC | 6.26e-07 | 2.39e-01 | 0.108 |
| 88455 | ANKRD13A | P24T-E | Human | Esophagus | ESCC | 1.21e-02 | 1.04e-01 | 0.1287 |
| 88455 | ANKRD13A | P26T-E | Human | Esophagus | ESCC | 2.98e-06 | 8.88e-02 | 0.1276 |
| 88455 | ANKRD13A | P27T-E | Human | Esophagus | ESCC | 6.02e-09 | 1.78e-01 | 0.1055 |
| 88455 | ANKRD13A | P28T-E | Human | Esophagus | ESCC | 2.30e-04 | 5.83e-02 | 0.1149 |
| 88455 | ANKRD13A | P30T-E | Human | Esophagus | ESCC | 5.62e-03 | 2.41e-01 | 0.137 |
| Page: 1 2 3 |
| Tissue | Expression Dynamics | Abbreviation |
| Esophagus | 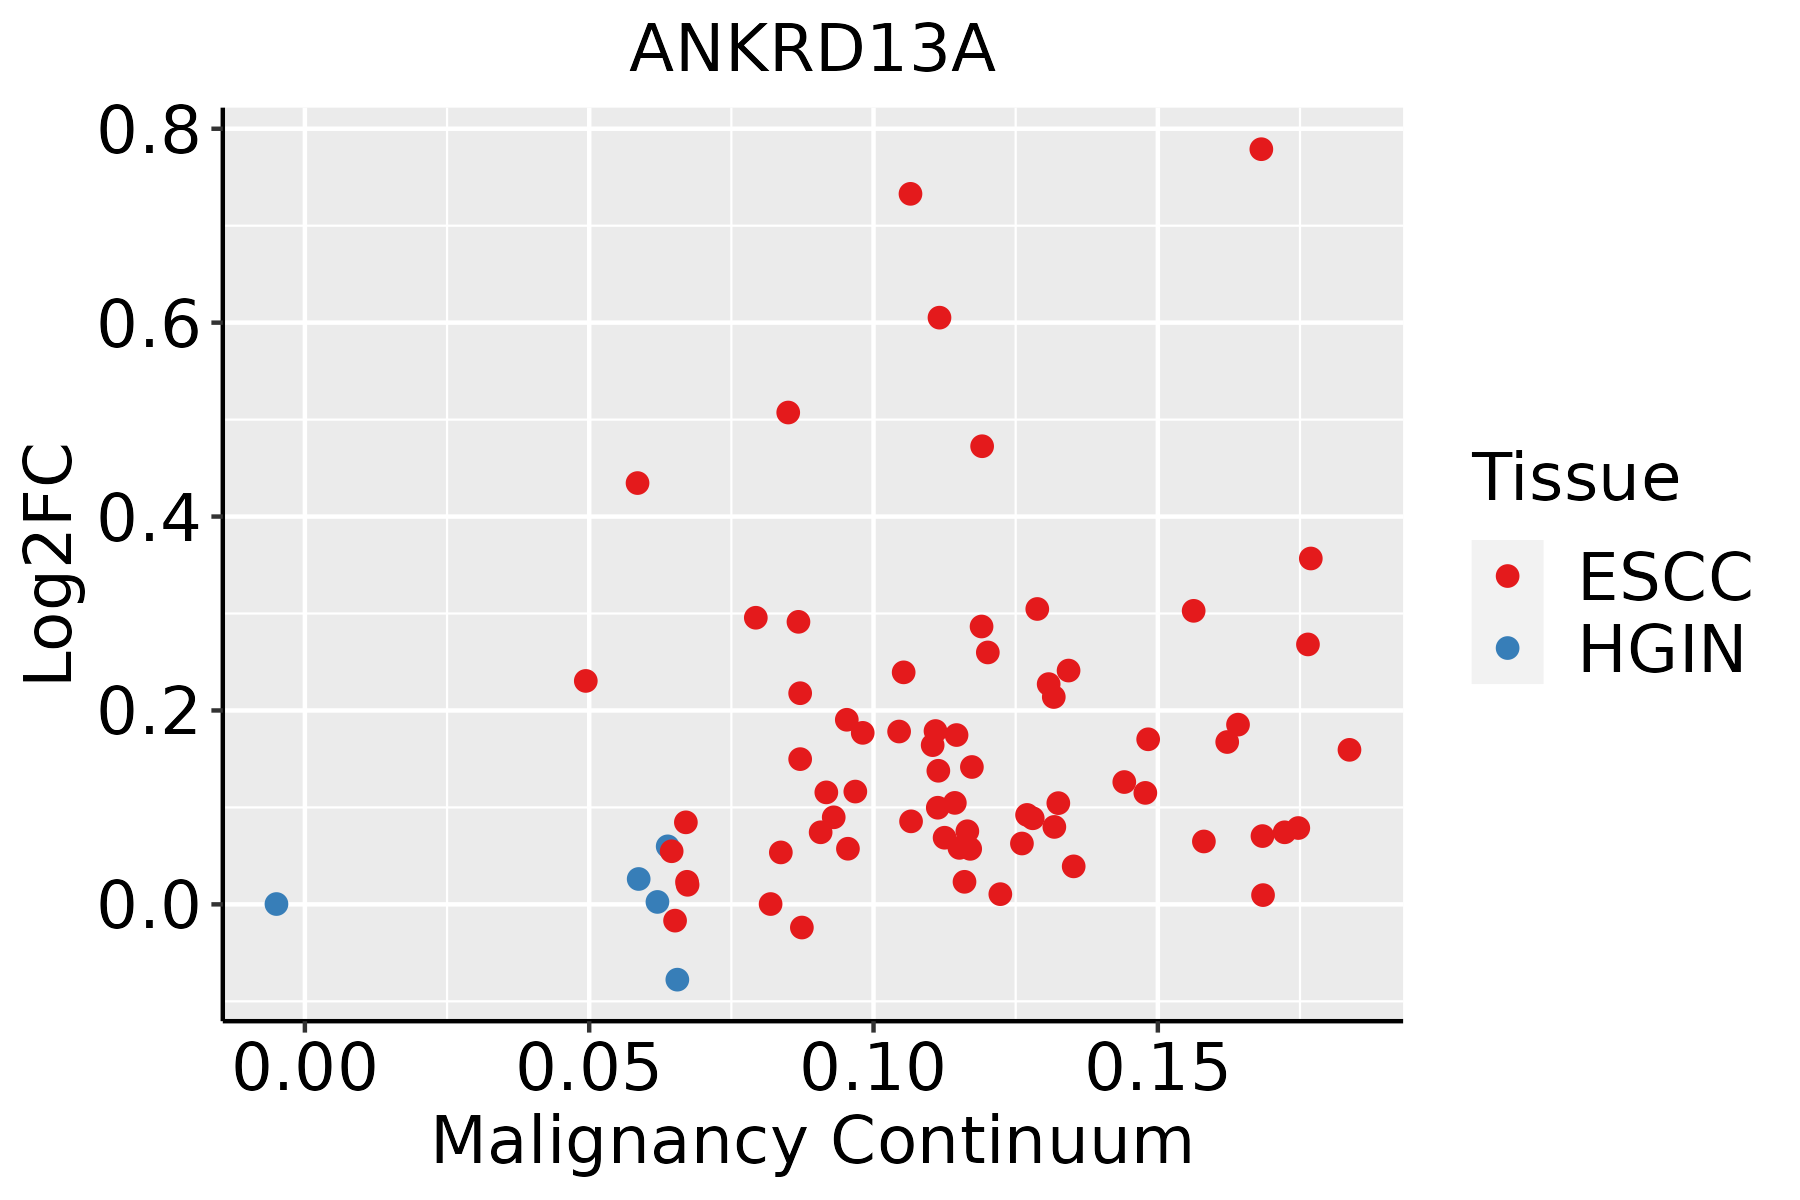 | ESCC: Esophageal squamous cell carcinoma |
| HGIN: High-grade intraepithelial neoplasias | ||
| LGIN: Low-grade intraepithelial neoplasias | ||
| Oral Cavity | 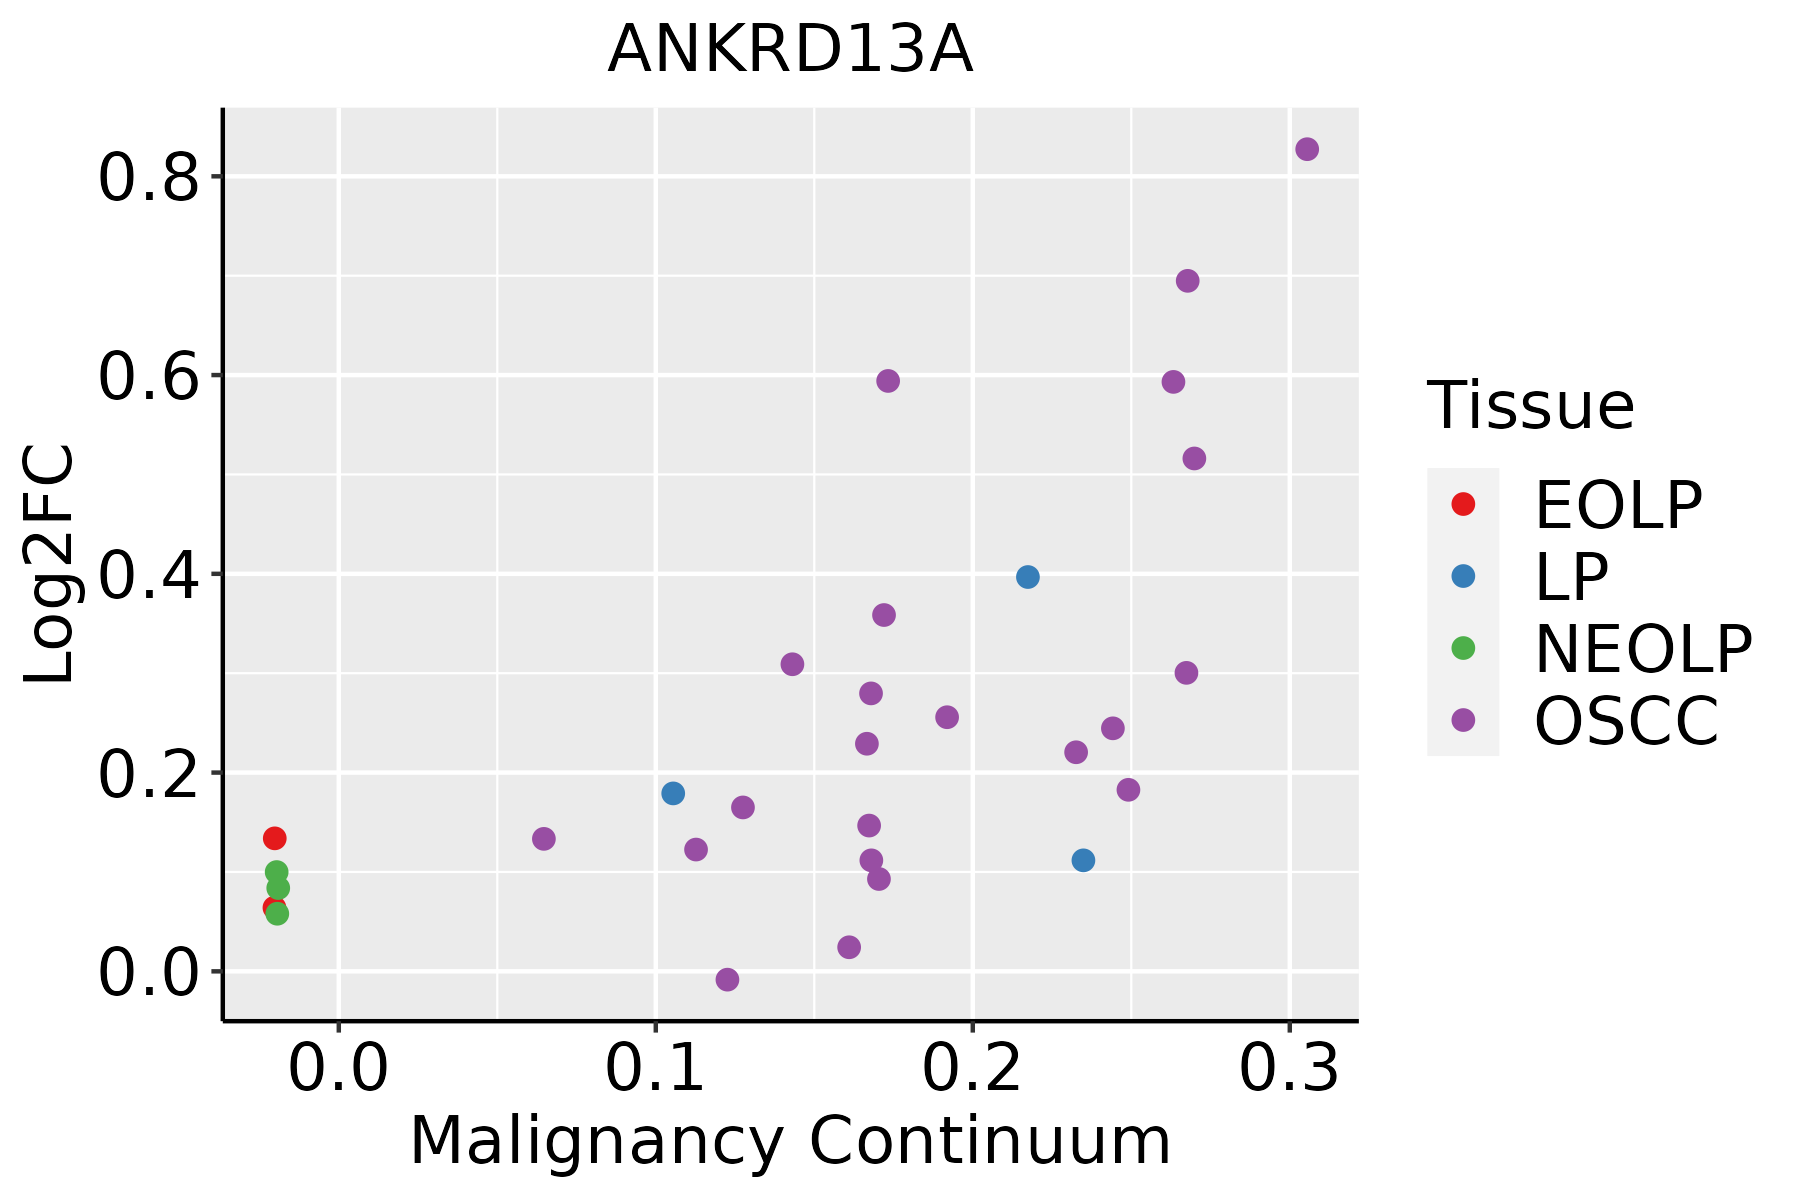 | EOLP: Erosive Oral lichen planus |
| LP: leukoplakia | ||
| NEOLP: Non-erosive oral lichen planus | ||
| OSCC: Oral squamous cell carcinoma |
| ∗log2FC in expression of this searched gene in stem-like cells from each diseased tissue sample relative to stem-like cells in normal samples in each tissue plotted against the malignancy continuum. Samples are colored based on if they are from different disease stage. |
Top |
Malignant transformation related pathway analysis |
| Find out the enriched GO biological processes and KEGG pathways involved in transition from healthy to precancer to cancer |
| Tissue | Disease Stage | Enriched GO biological Processes |
| Colorectum | AD |  |
| Colorectum | SER |  |
| Colorectum | MSS |  |
| Colorectum | MSI-H |  |
| Colorectum | FAP |  |
| ∗Top 15 enriched GO BP terms are showed in the bar plot of each disease state in each tissue. Each row represents a significant GO biological process which is colored according to the -log10(p.adjust). |
| Page: 1 2 3 4 5 6 7 8 9 |
| GO ID | Tissue | Disease Stage | Description | Gene Ratio | Bg Ratio | pvalue | p.adjust | Count |
| GO:003010018 | Esophagus | ESCC | regulation of endocytosis | 135/8552 | 211/18723 | 5.75e-08 | 1.02e-06 | 135 |
| GO:004311218 | Esophagus | ESCC | receptor metabolic process | 104/8552 | 166/18723 | 7.44e-06 | 7.37e-05 | 104 |
| GO:19038289 | Esophagus | ESCC | negative regulation of cellular protein localization | 76/8552 | 117/18723 | 1.97e-05 | 1.72e-04 | 76 |
| GO:000689818 | Esophagus | ESCC | receptor-mediated endocytosis | 142/8552 | 244/18723 | 5.22e-05 | 4.05e-04 | 142 |
| GO:004825916 | Esophagus | ESCC | regulation of receptor-mediated endocytosis | 66/8552 | 110/18723 | 1.72e-03 | 7.96e-03 | 66 |
| GO:00360106 | Esophagus | ESCC | protein localization to endosome | 18/8552 | 24/18723 | 3.43e-03 | 1.41e-02 | 18 |
| GO:003010016 | Oral cavity | OSCC | regulation of endocytosis | 121/7305 | 211/18723 | 4.74e-08 | 8.80e-07 | 121 |
| GO:000689810 | Oral cavity | OSCC | receptor-mediated endocytosis | 125/7305 | 244/18723 | 6.56e-05 | 5.32e-04 | 125 |
| GO:004311210 | Oral cavity | OSCC | receptor metabolic process | 88/7305 | 166/18723 | 1.68e-04 | 1.15e-03 | 88 |
| GO:19038288 | Oral cavity | OSCC | negative regulation of cellular protein localization | 65/7305 | 117/18723 | 2.05e-04 | 1.36e-03 | 65 |
| GO:004825910 | Oral cavity | OSCC | regulation of receptor-mediated endocytosis | 58/7305 | 110/18723 | 2.37e-03 | 1.05e-02 | 58 |
| GO:00360105 | Oral cavity | OSCC | protein localization to endosome | 16/7305 | 24/18723 | 5.63e-03 | 2.17e-02 | 16 |
| GO:00316239 | Oral cavity | OSCC | receptor internalization | 56/7305 | 113/18723 | 1.44e-02 | 4.69e-02 | 56 |
| GO:003010017 | Oral cavity | LP | regulation of endocytosis | 81/4623 | 211/18723 | 6.57e-06 | 1.29e-04 | 81 |
| GO:190382813 | Oral cavity | LP | negative regulation of cellular protein localization | 49/4623 | 117/18723 | 3.18e-05 | 4.89e-04 | 49 |
| GO:004311216 | Oral cavity | LP | receptor metabolic process | 64/4623 | 166/18723 | 5.00e-05 | 7.02e-04 | 64 |
| GO:000689817 | Oral cavity | LP | receptor-mediated endocytosis | 87/4623 | 244/18723 | 7.83e-05 | 1.02e-03 | 87 |
| GO:003601012 | Oral cavity | LP | protein localization to endosome | 14/4623 | 24/18723 | 4.52e-04 | 4.30e-03 | 14 |
| Page: 1 |
| Pathway ID | Tissue | Disease Stage | Description | Gene Ratio | Bg Ratio | pvalue | p.adjust | qvalue | Count |
| Page: 1 |
Top |
Cell-cell communication analysis |
| Identification of potential cell-cell interactions between two cell types and their ligand-receptor pairs for different disease states |
| Ligand | Receptor | LRpair | Pathway | Tissue | Disease Stage |
| Page: 1 |
Top |
Single-cell gene regulatory network inference analysis |
| Find out the significant the regulons (TFs) and the target genes of each regulon across cell types for different disease states |
| TF | Cell Type | Tissue | Disease Stage | Target Gene | RSS | Regulon Activity |
| ∗The dot plots of a searched regulon are shown for all cell subpopulations in each disease state of each tissue based on the regulon specific score inferred using pySCENIC and by calculating the average expression. |
| Page: 1 |
Top |
Somatic mutation of malignant transformation related genes |
| Annotation of somatic variants for genes involved in malignant transformation |
| Hugo Symbol | Variant Class | Variant Classification | dbSNP RS | HGVSc | HGVSp | HGVSp Short | SWISSPROT | BIOTYPE | SIFT | PolyPhen | Tumor Sample Barcode | Tissue | Histology | Sex | Age | Stage | Therapy Types | Drugs | Outcome |
| ANKRD13A | SNV | Missense_Mutation | c.524G>T | p.Ser175Ile | p.S175I | Q8IZ07 | protein_coding | deleterious(0) | possibly_damaging(0.875) | TCGA-B6-A1KC-01 | Breast | breast invasive carcinoma | Female | >=65 | I/II | Unknown | Unknown | SD | |
| ANKRD13A | SNV | Missense_Mutation | novel | c.967N>T | p.Thr323Ser | p.T323S | Q8IZ07 | protein_coding | tolerated(1) | benign(0.41) | TCGA-D8-A73U-01 | Breast | breast invasive carcinoma | Female | >=65 | I/II | Hormone Therapy | tamoxiphen | SD |
| ANKRD13A | insertion | Nonsense_Mutation | novel | c.1198_1199insGTGTGGAGTAAAGCTGCTGTTGTCTAGCCTACTGCAT | p.Lys400SerfsTer4 | p.K400Sfs*4 | Q8IZ07 | protein_coding | TCGA-A8-A0AD-01 | Breast | breast invasive carcinoma | Female | >=65 | I/II | Hormone Therapy | tamoxiphen | SD | ||
| ANKRD13A | insertion | Frame_Shift_Ins | novel | c.523_524insCTACT | p.Ser175ThrfsTer15 | p.S175Tfs*15 | Q8IZ07 | protein_coding | TCGA-AC-A3QQ-01 | Breast | breast invasive carcinoma | Female | <65 | I/II | Unknown | Unknown | SD | ||
| ANKRD13A | insertion | Frame_Shift_Ins | novel | c.1054_1055insGGTTAACACGTCCACCTCAGACACTGAGTGCC | p.Glu352GlyfsTer13 | p.E352Gfs*13 | Q8IZ07 | protein_coding | TCGA-BH-A0DS-01 | Breast | breast invasive carcinoma | Female | >=65 | III/IV | Chemotherapy | cyclophosphamide | SD | ||
| ANKRD13A | SNV | Missense_Mutation | novel | c.437N>A | p.Cys146Tyr | p.C146Y | Q8IZ07 | protein_coding | tolerated(1) | probably_damaging(0.996) | TCGA-2W-A8YY-01 | Cervix | cervical & endocervical cancer | Female | <65 | I/II | Chemotherapy | cisplatin | CR |
| ANKRD13A | SNV | Missense_Mutation | novel | c.631N>T | p.Leu211Phe | p.L211F | Q8IZ07 | protein_coding | tolerated(0.24) | possibly_damaging(0.757) | TCGA-2W-A8YY-01 | Cervix | cervical & endocervical cancer | Female | <65 | I/II | Chemotherapy | cisplatin | CR |
| ANKRD13A | SNV | Missense_Mutation | novel | c.886N>C | p.Asp296His | p.D296H | Q8IZ07 | protein_coding | tolerated(0.06) | probably_damaging(0.979) | TCGA-C5-A1BQ-01 | Cervix | cervical & endocervical cancer | Female | >=65 | III/IV | Chemotherapy | cisplatin | CR |
| ANKRD13A | SNV | Missense_Mutation | rs769790065 | c.214N>T | p.Arg72Cys | p.R72C | Q8IZ07 | protein_coding | tolerated(0.19) | benign(0.001) | TCGA-A6-2686-01 | Colorectum | colon adenocarcinoma | Female | >=65 | I/II | Unknown | Unknown | SD |
| ANKRD13A | SNV | Missense_Mutation | c.629N>A | p.Arg210His | p.R210H | Q8IZ07 | protein_coding | tolerated(0.09) | benign(0.019) | TCGA-AA-3715-01 | Colorectum | colon adenocarcinoma | Male | >=65 | I/II | Unknown | Unknown | PD |
| Page: 1 2 3 4 5 6 7 |
Top |
Related drugs of malignant transformation related genes |
| Identification of chemicals and drugs interact with genes involved in malignant transfromation |
| (DGIdb 4.0) |
| Entrez ID | Symbol | Category | Interaction Types | Drug Claim Name | Drug Name | PMIDs |
| Page: 1 |

Copyright 2023-Present -The University of Texas Health Science Center at Houston |