
|
|||||
|
 | |
| |
| |
| |
| |
| |
|
Gene: ANKRD10 |
Gene summary for ANKRD10 |
| Gene information | Species | Human | Gene symbol | ANKRD10 | Gene ID | 55608 |
| Gene name | ankyrin repeat domain 10 | |
| Gene Alias | ANKRD10 | |
| Cytomap | 13q34 | |
| Gene Type | protein-coding | GO ID | GO:0003674 | UniProtAcc | Q9NXR5 |
Top |
Malignant transformation analysis |
| Identification of the aberrant gene expression in precancerous and cancerous lesions by comparing the gene expression of stem-like cells in diseased tissues with normal stem cells |
| Entrez ID | Symbol | Replicates | Species | Organ | Tissue | Adj P-value | Log2FC | Malignancy |
| 55608 | ANKRD10 | HTA11_3410_2000001011 | Human | Colorectum | AD | 6.78e-26 | -7.41e-01 | 0.0155 |
| 55608 | ANKRD10 | HTA11_2487_2000001011 | Human | Colorectum | SER | 1.90e-12 | -6.22e-01 | -0.1808 |
| 55608 | ANKRD10 | HTA11_2951_2000001011 | Human | Colorectum | AD | 1.61e-03 | -8.30e-01 | 0.0216 |
| 55608 | ANKRD10 | HTA11_78_2000001011 | Human | Colorectum | AD | 9.13e-03 | -3.73e-01 | -0.1088 |
| 55608 | ANKRD10 | HTA11_347_2000001011 | Human | Colorectum | AD | 4.05e-05 | -3.21e-01 | -0.1954 |
| 55608 | ANKRD10 | HTA11_2112_2000001011 | Human | Colorectum | SER | 2.47e-02 | -7.51e-01 | -0.2196 |
| 55608 | ANKRD10 | HTA11_3361_2000001011 | Human | Colorectum | AD | 9.88e-07 | -6.84e-01 | -0.1207 |
| 55608 | ANKRD10 | HTA11_83_2000001011 | Human | Colorectum | SER | 6.90e-10 | -6.20e-01 | -0.1526 |
| 55608 | ANKRD10 | HTA11_696_2000001011 | Human | Colorectum | AD | 2.92e-33 | -7.09e-01 | -0.1464 |
| 55608 | ANKRD10 | HTA11_866_2000001011 | Human | Colorectum | AD | 1.02e-27 | -6.78e-01 | -0.1001 |
| 55608 | ANKRD10 | HTA11_1391_2000001011 | Human | Colorectum | AD | 2.94e-12 | -5.53e-01 | -0.059 |
| 55608 | ANKRD10 | HTA11_2992_2000001011 | Human | Colorectum | SER | 5.92e-04 | -6.91e-01 | -0.1706 |
| 55608 | ANKRD10 | HTA11_5212_2000001011 | Human | Colorectum | AD | 5.02e-04 | -7.60e-01 | -0.2061 |
| 55608 | ANKRD10 | HTA11_5216_2000001011 | Human | Colorectum | SER | 7.60e-03 | -7.37e-01 | -0.1462 |
| 55608 | ANKRD10 | HTA11_546_2000001011 | Human | Colorectum | AD | 4.11e-06 | -7.15e-01 | -0.0842 |
| 55608 | ANKRD10 | HTA11_866_3004761011 | Human | Colorectum | AD | 3.61e-11 | -6.26e-01 | 0.096 |
| 55608 | ANKRD10 | HTA11_9408_2000001011 | Human | Colorectum | AD | 6.59e-05 | -9.30e-01 | 0.0451 |
| 55608 | ANKRD10 | HTA11_7663_2000001011 | Human | Colorectum | SER | 3.79e-02 | -6.46e-01 | 0.0131 |
| 55608 | ANKRD10 | HTA11_10711_2000001011 | Human | Colorectum | AD | 2.40e-09 | -6.72e-01 | 0.0338 |
| 55608 | ANKRD10 | HTA11_7696_3000711011 | Human | Colorectum | AD | 1.06e-26 | -6.99e-01 | 0.0674 |
| Page: 1 2 3 4 5 6 7 8 |
| Tissue | Expression Dynamics | Abbreviation |
| Colorectum (GSE201348) |  | FAP: Familial adenomatous polyposis |
| CRC: Colorectal cancer | ||
| Colorectum (HTA11) |  | AD: Adenomas |
| SER: Sessile serrated lesions | ||
| MSI-H: Microsatellite-high colorectal cancer | ||
| MSS: Microsatellite stable colorectal cancer | ||
| Esophagus |  | ESCC: Esophageal squamous cell carcinoma |
| HGIN: High-grade intraepithelial neoplasias | ||
| LGIN: Low-grade intraepithelial neoplasias | ||
| Liver | 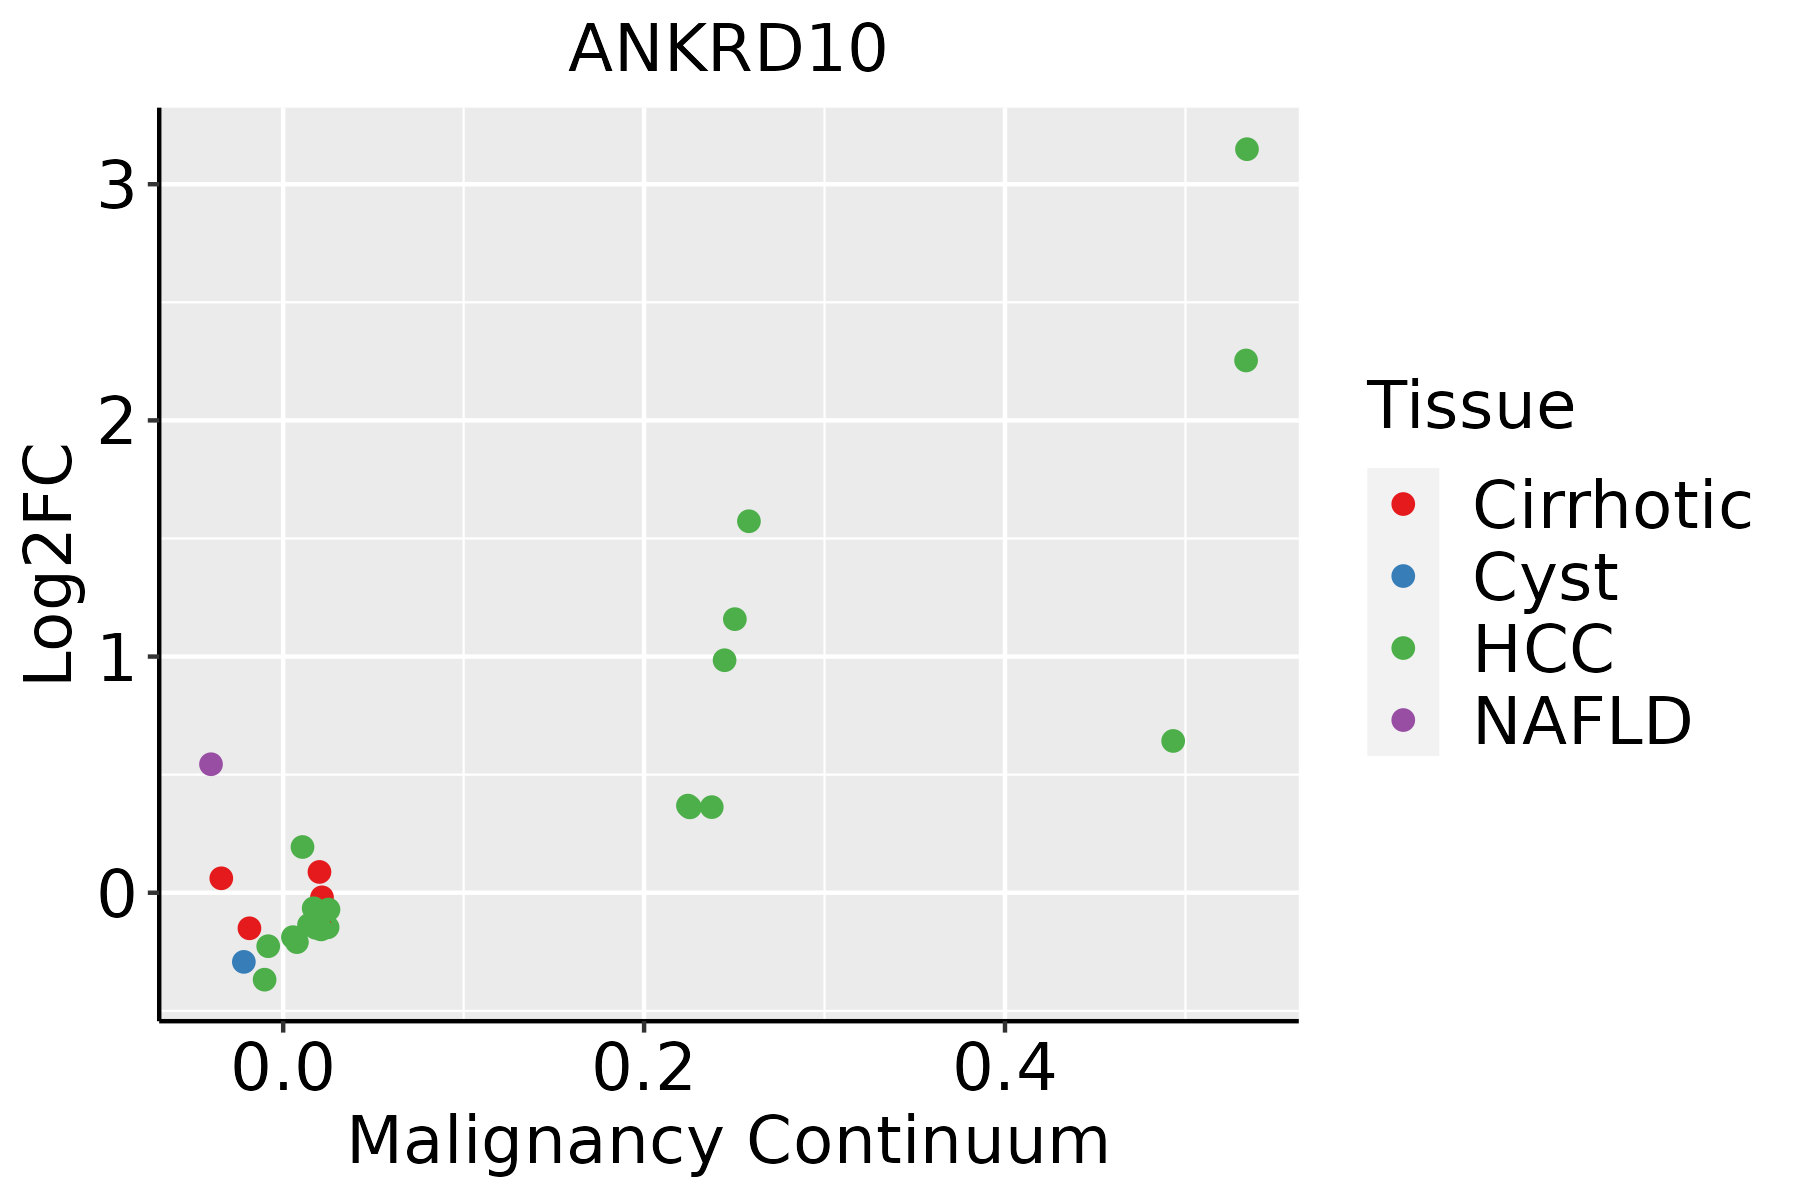 | HCC: Hepatocellular carcinoma |
| NAFLD: Non-alcoholic fatty liver disease | ||
| Oral Cavity |  | EOLP: Erosive Oral lichen planus |
| LP: leukoplakia | ||
| NEOLP: Non-erosive oral lichen planus | ||
| OSCC: Oral squamous cell carcinoma | ||
| Thyroid | 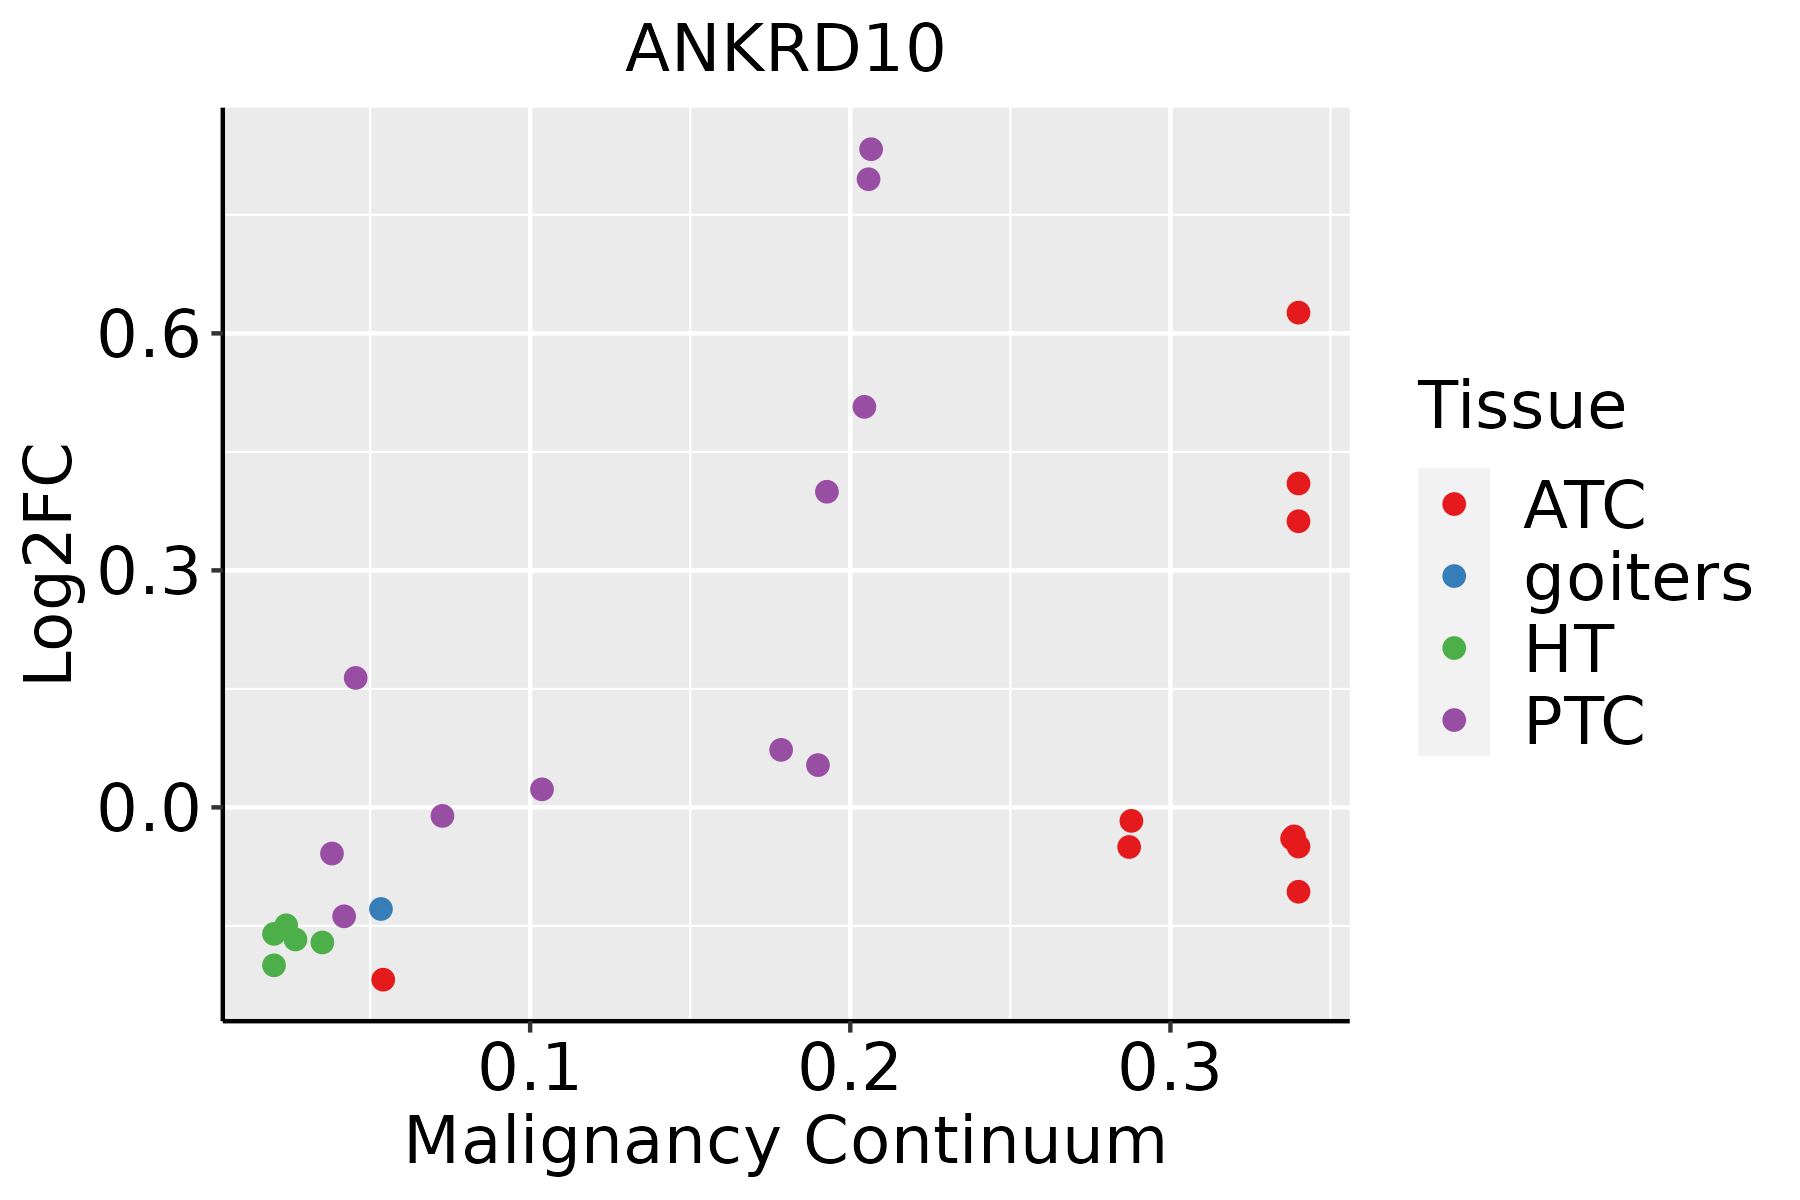 | ATC: Anaplastic thyroid cancer |
| HT: Hashimoto's thyroiditis | ||
| PTC: Papillary thyroid cancer |
| ∗log2FC in expression of this searched gene in stem-like cells from each diseased tissue sample relative to stem-like cells in normal samples in each tissue plotted against the malignancy continuum. Samples are colored based on if they are from different disease stage. |
Top |
Malignant transformation related pathway analysis |
| Find out the enriched GO biological processes and KEGG pathways involved in transition from healthy to precancer to cancer |
| Tissue | Disease Stage | Enriched GO biological Processes |
| Colorectum | AD |  |
| Colorectum | SER |  |
| Colorectum | MSS |  |
| Colorectum | MSI-H |  |
| Colorectum | FAP |  |
| ∗Top 15 enriched GO BP terms are showed in the bar plot of each disease state in each tissue. Each row represents a significant GO biological process which is colored according to the -log10(p.adjust). |
| Page: 1 2 3 4 5 6 7 8 9 |
| GO ID | Tissue | Disease Stage | Description | Gene Ratio | Bg Ratio | pvalue | p.adjust | Count |
| Page: 1 |
| Pathway ID | Tissue | Disease Stage | Description | Gene Ratio | Bg Ratio | pvalue | p.adjust | qvalue | Count |
| Page: 1 |
Top |
Cell-cell communication analysis |
| Identification of potential cell-cell interactions between two cell types and their ligand-receptor pairs for different disease states |
| Ligand | Receptor | LRpair | Pathway | Tissue | Disease Stage |
| Page: 1 |
Top |
Single-cell gene regulatory network inference analysis |
| Find out the significant the regulons (TFs) and the target genes of each regulon across cell types for different disease states |
| TF | Cell Type | Tissue | Disease Stage | Target Gene | RSS | Regulon Activity |
| ∗The dot plots of a searched regulon are shown for all cell subpopulations in each disease state of each tissue based on the regulon specific score inferred using pySCENIC and by calculating the average expression. |
| Page: 1 |
Top |
Somatic mutation of malignant transformation related genes |
| Annotation of somatic variants for genes involved in malignant transformation |
| Hugo Symbol | Variant Class | Variant Classification | dbSNP RS | HGVSc | HGVSp | HGVSp Short | SWISSPROT | BIOTYPE | SIFT | PolyPhen | Tumor Sample Barcode | Tissue | Histology | Sex | Age | Stage | Therapy Types | Drugs | Outcome |
| ANKRD10 | SNV | Missense_Mutation | rs779123844 | c.635N>A | p.Arg212Gln | p.R212Q | Q9NXR5 | protein_coding | deleterious(0) | probably_damaging(0.992) | TCGA-AN-A046-01 | Breast | breast invasive carcinoma | Female | >=65 | I/II | Unknown | Unknown | SD |
| ANKRD10 | SNV | Missense_Mutation | c.1058G>T | p.Ser353Ile | p.S353I | Q9NXR5 | protein_coding | deleterious(0) | probably_damaging(0.994) | TCGA-AN-A0FW-01 | Breast | breast invasive carcinoma | Female | >=65 | III/IV | Unknown | Unknown | SD | |
| ANKRD10 | insertion | Frame_Shift_Ins | novel | c.1163_1164insTCAACATTGTCTTTTTAATACTGTCACCAGAT | p.Glu389GlnfsTer11 | p.E389Qfs*11 | Q9NXR5 | protein_coding | TCGA-A8-A07R-01 | Breast | breast invasive carcinoma | Female | >=65 | III/IV | Ancillary | zoledronic | SD | ||
| ANKRD10 | SNV | Missense_Mutation | rs755781873 | c.808N>A | p.Val270Ile | p.V270I | Q9NXR5 | protein_coding | tolerated(0.36) | benign(0.007) | TCGA-AA-A022-01 | Colorectum | colon adenocarcinoma | Female | >=65 | I/II | Unknown | Unknown | SD |
| ANKRD10 | SNV | Missense_Mutation | rs368912394 | c.437C>T | p.Ala146Val | p.A146V | Q9NXR5 | protein_coding | tolerated(0.53) | possibly_damaging(0.752) | TCGA-AD-6895-01 | Colorectum | colon adenocarcinoma | Male | >=65 | III/IV | Unknown | Unknown | SD |
| ANKRD10 | SNV | Missense_Mutation | rs779123844 | c.635N>A | p.Arg212Gln | p.R212Q | Q9NXR5 | protein_coding | deleterious(0) | probably_damaging(0.992) | TCGA-AZ-4315-01 | Colorectum | colon adenocarcinoma | Male | <65 | I/II | Unknown | Unknown | SD |
| ANKRD10 | SNV | Missense_Mutation | c.1243N>T | p.His415Tyr | p.H415Y | Q9NXR5 | protein_coding | tolerated(0.23) | benign(0.001) | TCGA-CK-5916-01 | Colorectum | colon adenocarcinoma | Female | >=65 | I/II | Unknown | Unknown | PD | |
| ANKRD10 | SNV | Missense_Mutation | c.1103N>G | p.Ile368Ser | p.I368S | Q9NXR5 | protein_coding | tolerated(0.92) | benign(0.006) | TCGA-A5-A0G1-01 | Endometrium | uterine corpus endometrioid carcinoma | Female | >=65 | I/II | Unknown | Unknown | SD | |
| ANKRD10 | SNV | Missense_Mutation | rs761519788 | c.256N>A | p.Val86Ile | p.V86I | Q9NXR5 | protein_coding | tolerated(0.27) | benign(0.01) | TCGA-A5-A0G2-01 | Endometrium | uterine corpus endometrioid carcinoma | Female | <65 | III/IV | Unknown | Unknown | SD |
| ANKRD10 | SNV | Missense_Mutation | novel | c.286G>A | p.Ala96Thr | p.A96T | Q9NXR5 | protein_coding | tolerated(0.71) | probably_damaging(0.999) | TCGA-A5-A2K3-01 | Endometrium | uterine corpus endometrioid carcinoma | Female | >=65 | I/II | Chemotherapy | carboplatin | SD |
| Page: 1 2 3 |
Top |
Related drugs of malignant transformation related genes |
| Identification of chemicals and drugs interact with genes involved in malignant transfromation |
| (DGIdb 4.0) |
| Entrez ID | Symbol | Category | Interaction Types | Drug Claim Name | Drug Name | PMIDs |
| Page: 1 |

Copyright 2023-Present -The University of Texas Health Science Center at Houston |