
|
|||||
|
 | |
| |
| |
| |
| |
| |
|
Gene: ANKMY2 |
Gene summary for ANKMY2 |
| Gene information | Species | Human | Gene symbol | ANKMY2 | Gene ID | 57037 |
| Gene name | ankyrin repeat and MYND domain containing 2 | |
| Gene Alias | ZMYND20 | |
| Cytomap | 7p21.1 | |
| Gene Type | protein-coding | GO ID | GO:0005575 | UniProtAcc | A0A024R9Z6 |
Top |
Malignant transformation analysis |
| Identification of the aberrant gene expression in precancerous and cancerous lesions by comparing the gene expression of stem-like cells in diseased tissues with normal stem cells |
| Entrez ID | Symbol | Replicates | Species | Organ | Tissue | Adj P-value | Log2FC | Malignancy |
| 57037 | ANKMY2 | LZE4T | Human | Esophagus | ESCC | 2.39e-07 | 2.17e-01 | 0.0811 |
| 57037 | ANKMY2 | LZE24T | Human | Esophagus | ESCC | 4.15e-07 | 2.28e-01 | 0.0596 |
| 57037 | ANKMY2 | P2T-E | Human | Esophagus | ESCC | 2.42e-15 | 2.39e-01 | 0.1177 |
| 57037 | ANKMY2 | P4T-E | Human | Esophagus | ESCC | 1.56e-11 | 2.23e-01 | 0.1323 |
| 57037 | ANKMY2 | P5T-E | Human | Esophagus | ESCC | 1.12e-02 | 6.29e-02 | 0.1327 |
| 57037 | ANKMY2 | P8T-E | Human | Esophagus | ESCC | 2.06e-07 | 2.15e-01 | 0.0889 |
| 57037 | ANKMY2 | P9T-E | Human | Esophagus | ESCC | 8.05e-03 | 1.25e-01 | 0.1131 |
| 57037 | ANKMY2 | P10T-E | Human | Esophagus | ESCC | 1.53e-19 | 3.02e-01 | 0.116 |
| 57037 | ANKMY2 | P11T-E | Human | Esophagus | ESCC | 2.59e-07 | 2.78e-01 | 0.1426 |
| 57037 | ANKMY2 | P12T-E | Human | Esophagus | ESCC | 1.77e-22 | 3.40e-01 | 0.1122 |
| 57037 | ANKMY2 | P15T-E | Human | Esophagus | ESCC | 8.40e-07 | 2.14e-01 | 0.1149 |
| 57037 | ANKMY2 | P16T-E | Human | Esophagus | ESCC | 1.29e-13 | 3.15e-01 | 0.1153 |
| 57037 | ANKMY2 | P20T-E | Human | Esophagus | ESCC | 2.64e-13 | 3.08e-01 | 0.1124 |
| 57037 | ANKMY2 | P21T-E | Human | Esophagus | ESCC | 2.85e-14 | 1.58e-01 | 0.1617 |
| 57037 | ANKMY2 | P22T-E | Human | Esophagus | ESCC | 2.56e-10 | 1.62e-01 | 0.1236 |
| 57037 | ANKMY2 | P23T-E | Human | Esophagus | ESCC | 1.97e-11 | 2.19e-01 | 0.108 |
| 57037 | ANKMY2 | P24T-E | Human | Esophagus | ESCC | 9.16e-05 | 6.18e-02 | 0.1287 |
| 57037 | ANKMY2 | P26T-E | Human | Esophagus | ESCC | 5.78e-14 | 2.80e-01 | 0.1276 |
| 57037 | ANKMY2 | P27T-E | Human | Esophagus | ESCC | 4.44e-19 | 2.51e-01 | 0.1055 |
| 57037 | ANKMY2 | P28T-E | Human | Esophagus | ESCC | 3.99e-04 | 1.35e-01 | 0.1149 |
| Page: 1 2 3 |
| Tissue | Expression Dynamics | Abbreviation |
| Esophagus | 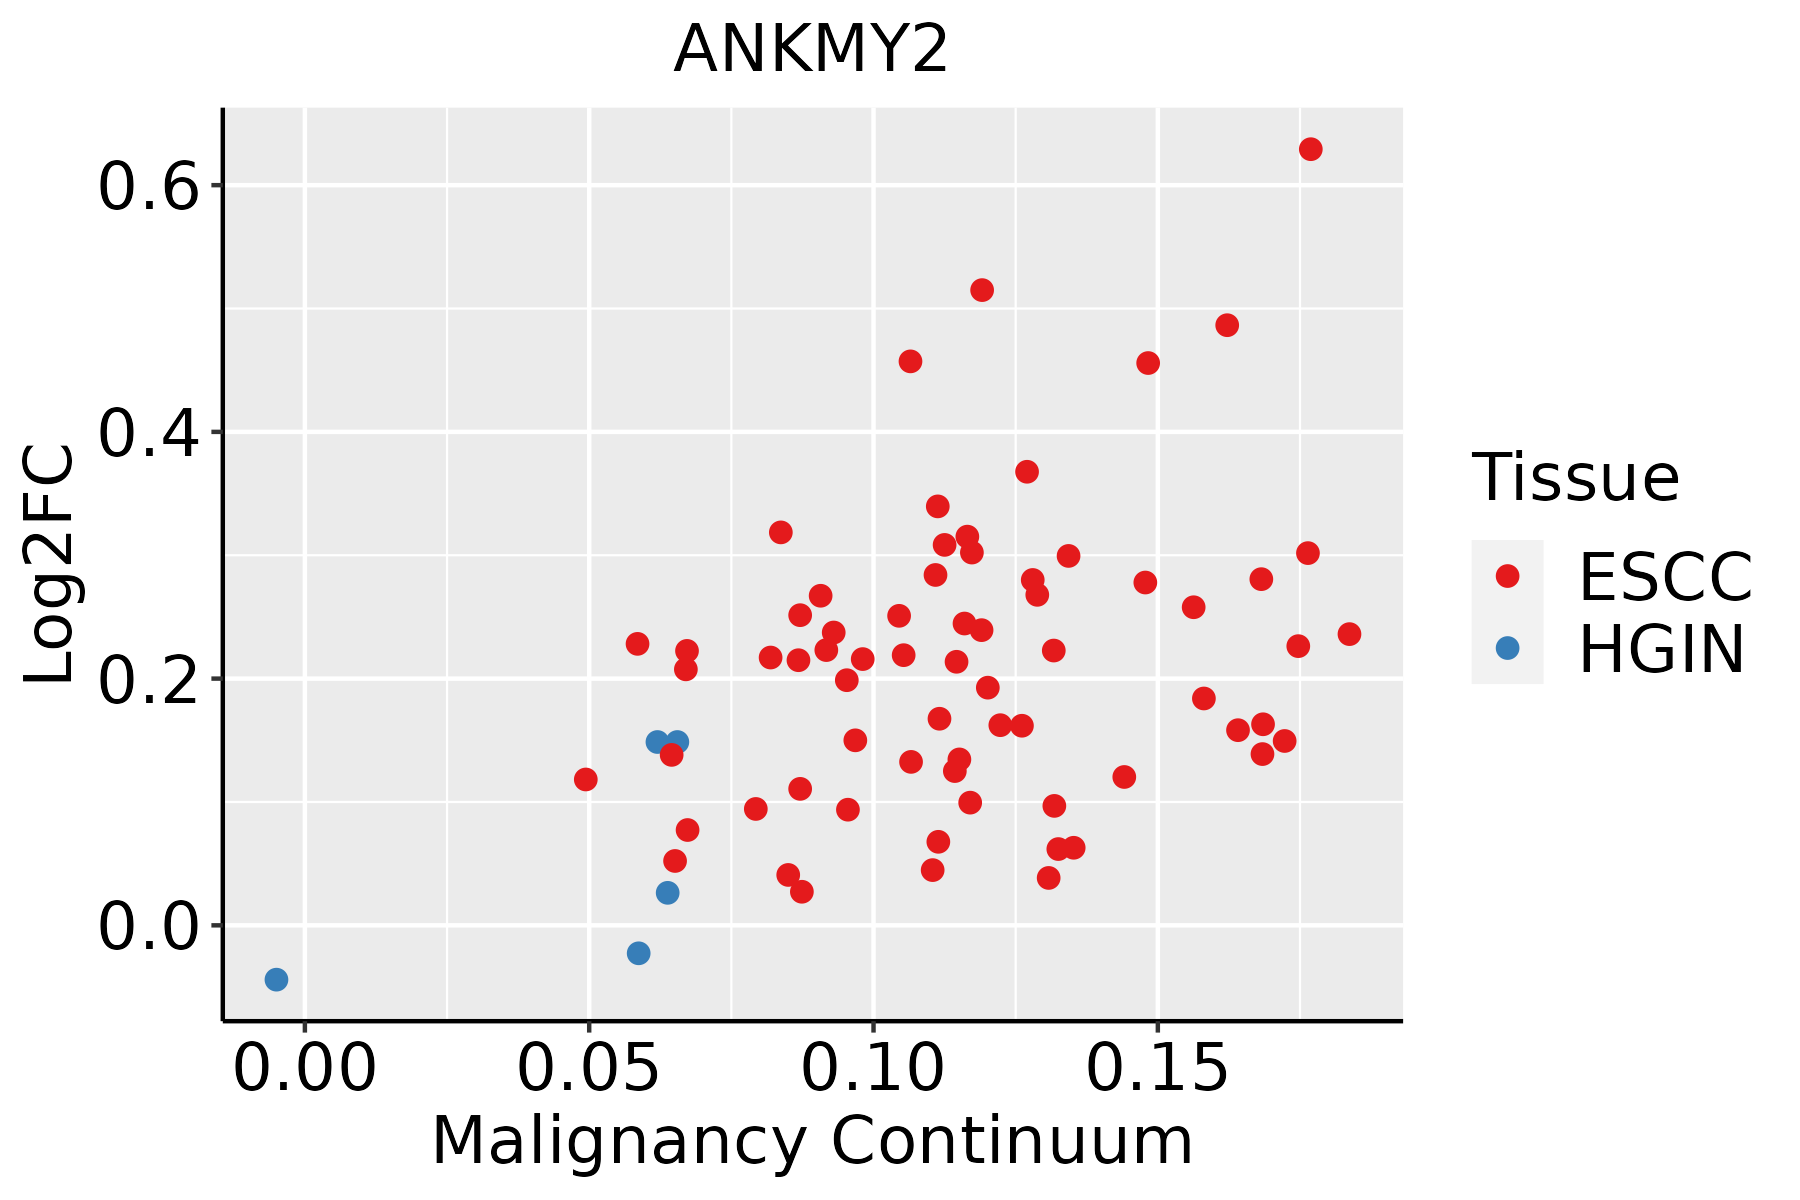 | ESCC: Esophageal squamous cell carcinoma |
| HGIN: High-grade intraepithelial neoplasias | ||
| LGIN: Low-grade intraepithelial neoplasias |
| ∗log2FC in expression of this searched gene in stem-like cells from each diseased tissue sample relative to stem-like cells in normal samples in each tissue plotted against the malignancy continuum. Samples are colored based on if they are from different disease stage. |
Top |
Malignant transformation related pathway analysis |
| Find out the enriched GO biological processes and KEGG pathways involved in transition from healthy to precancer to cancer |
| Tissue | Disease Stage | Enriched GO biological Processes |
| Colorectum | AD |  |
| Colorectum | SER |  |
| Colorectum | MSS |  |
| Colorectum | MSI-H |  |
| Colorectum | FAP |  |
| ∗Top 15 enriched GO BP terms are showed in the bar plot of each disease state in each tissue. Each row represents a significant GO biological process which is colored according to the -log10(p.adjust). |
| Page: 1 2 3 4 5 6 7 8 9 |
| GO ID | Tissue | Disease Stage | Description | Gene Ratio | Bg Ratio | pvalue | p.adjust | Count |
| Page: 1 |
| Pathway ID | Tissue | Disease Stage | Description | Gene Ratio | Bg Ratio | pvalue | p.adjust | qvalue | Count |
| Page: 1 |
Top |
Cell-cell communication analysis |
| Identification of potential cell-cell interactions between two cell types and their ligand-receptor pairs for different disease states |
| Ligand | Receptor | LRpair | Pathway | Tissue | Disease Stage |
| Page: 1 |
Top |
Single-cell gene regulatory network inference analysis |
| Find out the significant the regulons (TFs) and the target genes of each regulon across cell types for different disease states |
| TF | Cell Type | Tissue | Disease Stage | Target Gene | RSS | Regulon Activity |
| ∗The dot plots of a searched regulon are shown for all cell subpopulations in each disease state of each tissue based on the regulon specific score inferred using pySCENIC and by calculating the average expression. |
| Page: 1 |
Top |
Somatic mutation of malignant transformation related genes |
| Annotation of somatic variants for genes involved in malignant transformation |
| Hugo Symbol | Variant Class | Variant Classification | dbSNP RS | HGVSc | HGVSp | HGVSp Short | SWISSPROT | BIOTYPE | SIFT | PolyPhen | Tumor Sample Barcode | Tissue | Histology | Sex | Age | Stage | Therapy Types | Drugs | Outcome |
| ANKMY2 | SNV | Missense_Mutation | c.716N>A | p.Gly239Glu | p.G239E | Q8IV38 | protein_coding | tolerated(0.3) | benign(0.079) | TCGA-AC-A23H-01 | Breast | breast invasive carcinoma | Female | >=65 | I/II | Unknown | Unknown | PD | |
| ANKMY2 | SNV | Missense_Mutation | c.660N>A | p.Met220Ile | p.M220I | Q8IV38 | protein_coding | tolerated(0.13) | benign(0.003) | TCGA-C8-A26Y-01 | Breast | breast invasive carcinoma | Female | >=65 | I/II | Unknown | Unknown | SD | |
| ANKMY2 | deletion | Frame_Shift_Del | novel | c.473delN | p.Pro158GlnfsTer22 | p.P158Qfs*22 | Q8IV38 | protein_coding | TCGA-D8-A27V-01 | Breast | breast invasive carcinoma | Female | <65 | I/II | Hormone Therapy | tamoxiphen | SD | ||
| ANKMY2 | SNV | Missense_Mutation | rs768714189 | c.907N>A | p.Val303Ile | p.V303I | Q8IV38 | protein_coding | tolerated(0.27) | benign(0.015) | TCGA-A6-6781-01 | Colorectum | colon adenocarcinoma | Male | <65 | III/IV | Chemotherapy | oxaliplatin | SD |
| ANKMY2 | SNV | Missense_Mutation | c.1078N>A | p.Leu360Met | p.L360M | Q8IV38 | protein_coding | deleterious(0.01) | possibly_damaging(0.888) | TCGA-AA-3864-01 | Colorectum | colon adenocarcinoma | Male | >=65 | I/II | Unknown | Unknown | SD | |
| ANKMY2 | SNV | Missense_Mutation | c.1248G>T | p.Lys416Asn | p.K416N | Q8IV38 | protein_coding | tolerated_low_confidence(0.19) | benign(0.003) | TCGA-AA-3977-01 | Colorectum | colon adenocarcinoma | Male | >=65 | I/II | Unknown | Unknown | SD | |
| ANKMY2 | SNV | Missense_Mutation | c.820N>G | p.Phe274Val | p.F274V | Q8IV38 | protein_coding | deleterious(0) | probably_damaging(0.989) | TCGA-AA-A010-01 | Colorectum | colon adenocarcinoma | Female | <65 | I/II | Chemotherapy | folinic | CR | |
| ANKMY2 | SNV | Missense_Mutation | novel | c.901N>A | p.Phe301Ile | p.F301I | Q8IV38 | protein_coding | tolerated(0.26) | benign(0.003) | TCGA-AM-5820-01 | Colorectum | colon adenocarcinoma | Female | <65 | I/II | Unknown | Unknown | SD |
| ANKMY2 | SNV | Missense_Mutation | rs771078807 | c.395N>C | p.Ile132Thr | p.I132T | Q8IV38 | protein_coding | deleterious(0) | possibly_damaging(0.886) | TCGA-CM-4743-01 | Colorectum | colon adenocarcinoma | Male | >=65 | I/II | Chemotherapy | capecitabine | SD |
| ANKMY2 | SNV | Missense_Mutation | novel | c.370G>A | p.Gly124Ser | p.G124S | Q8IV38 | protein_coding | deleterious(0.05) | probably_damaging(0.932) | TCGA-A5-A0G2-01 | Endometrium | uterine corpus endometrioid carcinoma | Female | <65 | III/IV | Unknown | Unknown | SD |
| Page: 1 2 3 4 |
Top |
Related drugs of malignant transformation related genes |
| Identification of chemicals and drugs interact with genes involved in malignant transfromation |
| (DGIdb 4.0) |
| Entrez ID | Symbol | Category | Interaction Types | Drug Claim Name | Drug Name | PMIDs |
| Page: 1 |

Copyright 2023-Present -The University of Texas Health Science Center at Houston |