Schematic overview of the cellular and molecular mechanisms involved in the cancer progression, including the proposed cellular and molecular mechanisms in cancer cells trajectory. AT1: alveolar type 1 cells; AT2: alveolar type 2 cells; AAH: atypical adenomatous hyperplasia; AIS: adenocarcinoma in situ; MIA: minimally invasive adenocarcinoma; IA: invasive adenocarcinoma; EMT: epithelial-mesenchymal transition

Home

Download

Statistics

Help

Contact

Center for Computational Systems Medicine
leaf

Gene summary

leaf

Malignant transformation analysis

leaf

Malignant transformation related pathway analysis

leaf

Cell-cell communication analysis

leaf

Single-cell gene regulatory network inference analysis

leaf

Somatic mutation of malignant transformation related genes

leaf

Related drugs of malignant transformation related genes

Gene: ANKIB1

Gene summary for ANKIB1

check button Gene summary.

Gene informationSpeciesHuman
Gene symbol

ANKIB1

Gene ID

54467

Gene nameankyrin repeat and IBR domain containing 1
Gene AliasANKIB1
Cytomap7q21.2
Gene Typeprotein-coding
GO ID

GO:0000209

UniProtAcc

Q9P2G1


Top

Malignant transformation analysis

check button Identification of the aberrant gene expression in precancerous and cancerous lesions by comparing the gene expression of stem-like cells in diseased tissues with normal stem cells
check button Malignant transformation involving gene list.
Entrez IDSymbolReplicatesSpeciesOrganTissueAdj P-valueLog2FCMalignancy
54467ANKIB1CCI_1HumanCervixCC5.83e-046.78e-010.528
54467ANKIB1CCI_2HumanCervixCC1.11e-089.81e-010.5249
54467ANKIB1CCI_3HumanCervixCC9.73e-139.70e-010.516
54467ANKIB1HTA11_3410_2000001011HumanColorectumAD1.33e-09-4.24e-010.0155
54467ANKIB1HTA11_3361_2000001011HumanColorectumAD3.17e-06-6.09e-01-0.1207
54467ANKIB1HTA11_866_2000001011HumanColorectumAD3.63e-02-2.22e-01-0.1001
54467ANKIB1HTA11_5212_2000001011HumanColorectumAD1.46e-04-6.06e-01-0.2061
54467ANKIB1HTA11_5216_2000001011HumanColorectumSER7.39e-04-7.97e-01-0.1462
54467ANKIB1HTA11_99999970781_79442HumanColorectumMSS9.71e-05-1.70e-010.294
54467ANKIB1HTA11_99999965104_69814HumanColorectumMSS5.54e-046.00e-010.281
54467ANKIB1HTA11_99999974143_84620HumanColorectumMSS1.16e-08-4.14e-010.3005
54467ANKIB1F007HumanColorectumFAP4.17e-02-2.33e-010.1176
54467ANKIB1A001-C-207HumanColorectumFAP4.18e-06-2.85e-010.1278
54467ANKIB1A015-C-203HumanColorectumFAP1.37e-25-4.02e-01-0.1294
54467ANKIB1A015-C-204HumanColorectumFAP6.81e-10-4.28e-01-0.0228
54467ANKIB1A014-C-040HumanColorectumFAP2.59e-07-5.67e-01-0.1184
54467ANKIB1A002-C-201HumanColorectumFAP3.91e-17-3.73e-010.0324
54467ANKIB1A001-C-119HumanColorectumFAP2.24e-06-3.58e-01-0.1557
54467ANKIB1A001-C-108HumanColorectumFAP1.97e-13-2.88e-01-0.0272
54467ANKIB1A002-C-205HumanColorectumFAP1.43e-25-4.73e-01-0.1236
Page: 1 2 3 4 5 6 7 8 9 

check button Transcriptomic changes along malignancy continuum.
TissueExpression DynamicsAbbreviation
CervixThe image shows the transcriptomic changes along malignancy continuum.log2FC in expression of this searched gene in stem-like cells from each diseased tissue sample relative to stem-like cells in normal samples in each tissue plotted against the malignancy continuum. Samples are colored based on if they are from different disease stage.CC: Cervix cancer
HSIL_HPV: HPV-infected high-grade squamous intraepithelial lesions
N_HPV: HPV-infected normal cervix
Colorectum (GSE201348)The image shows the transcriptomic changes along malignancy continuum.log2FC in expression of this searched gene in stem-like cells from each diseased tissue sample relative to stem-like cells in normal samples in each tissue plotted against the malignancy continuum. Samples are colored based on if they are from different disease stage.FAP: Familial adenomatous polyposis
CRC: Colorectal cancer
Colorectum (HTA11)The image shows the transcriptomic changes along malignancy continuum.log2FC in expression of this searched gene in stem-like cells from each diseased tissue sample relative to stem-like cells in normal samples in each tissue plotted against the malignancy continuum. Samples are colored based on if they are from different disease stage.AD: Adenomas
SER: Sessile serrated lesions
MSI-H: Microsatellite-high colorectal cancer
MSS: Microsatellite stable colorectal cancer
EsophagusThe image shows the transcriptomic changes along malignancy continuum.log2FC in expression of this searched gene in stem-like cells from each diseased tissue sample relative to stem-like cells in normal samples in each tissue plotted against the malignancy continuum. Samples are colored based on if they are from different disease stage.ESCC: Esophageal squamous cell carcinoma
HGIN: High-grade intraepithelial neoplasias
LGIN: Low-grade intraepithelial neoplasias
LiverThe image shows the transcriptomic changes along malignancy continuum.log2FC in expression of this searched gene in stem-like cells from each diseased tissue sample relative to stem-like cells in normal samples in each tissue plotted against the malignancy continuum. Samples are colored based on if they are from different disease stage.HCC: Hepatocellular carcinoma
NAFLD: Non-alcoholic fatty liver disease
LungThe image shows the transcriptomic changes along malignancy continuum.log2FC in expression of this searched gene in stem-like cells from each diseased tissue sample relative to stem-like cells in normal samples in each tissue plotted against the malignancy continuum. Samples are colored based on if they are from different disease stage.
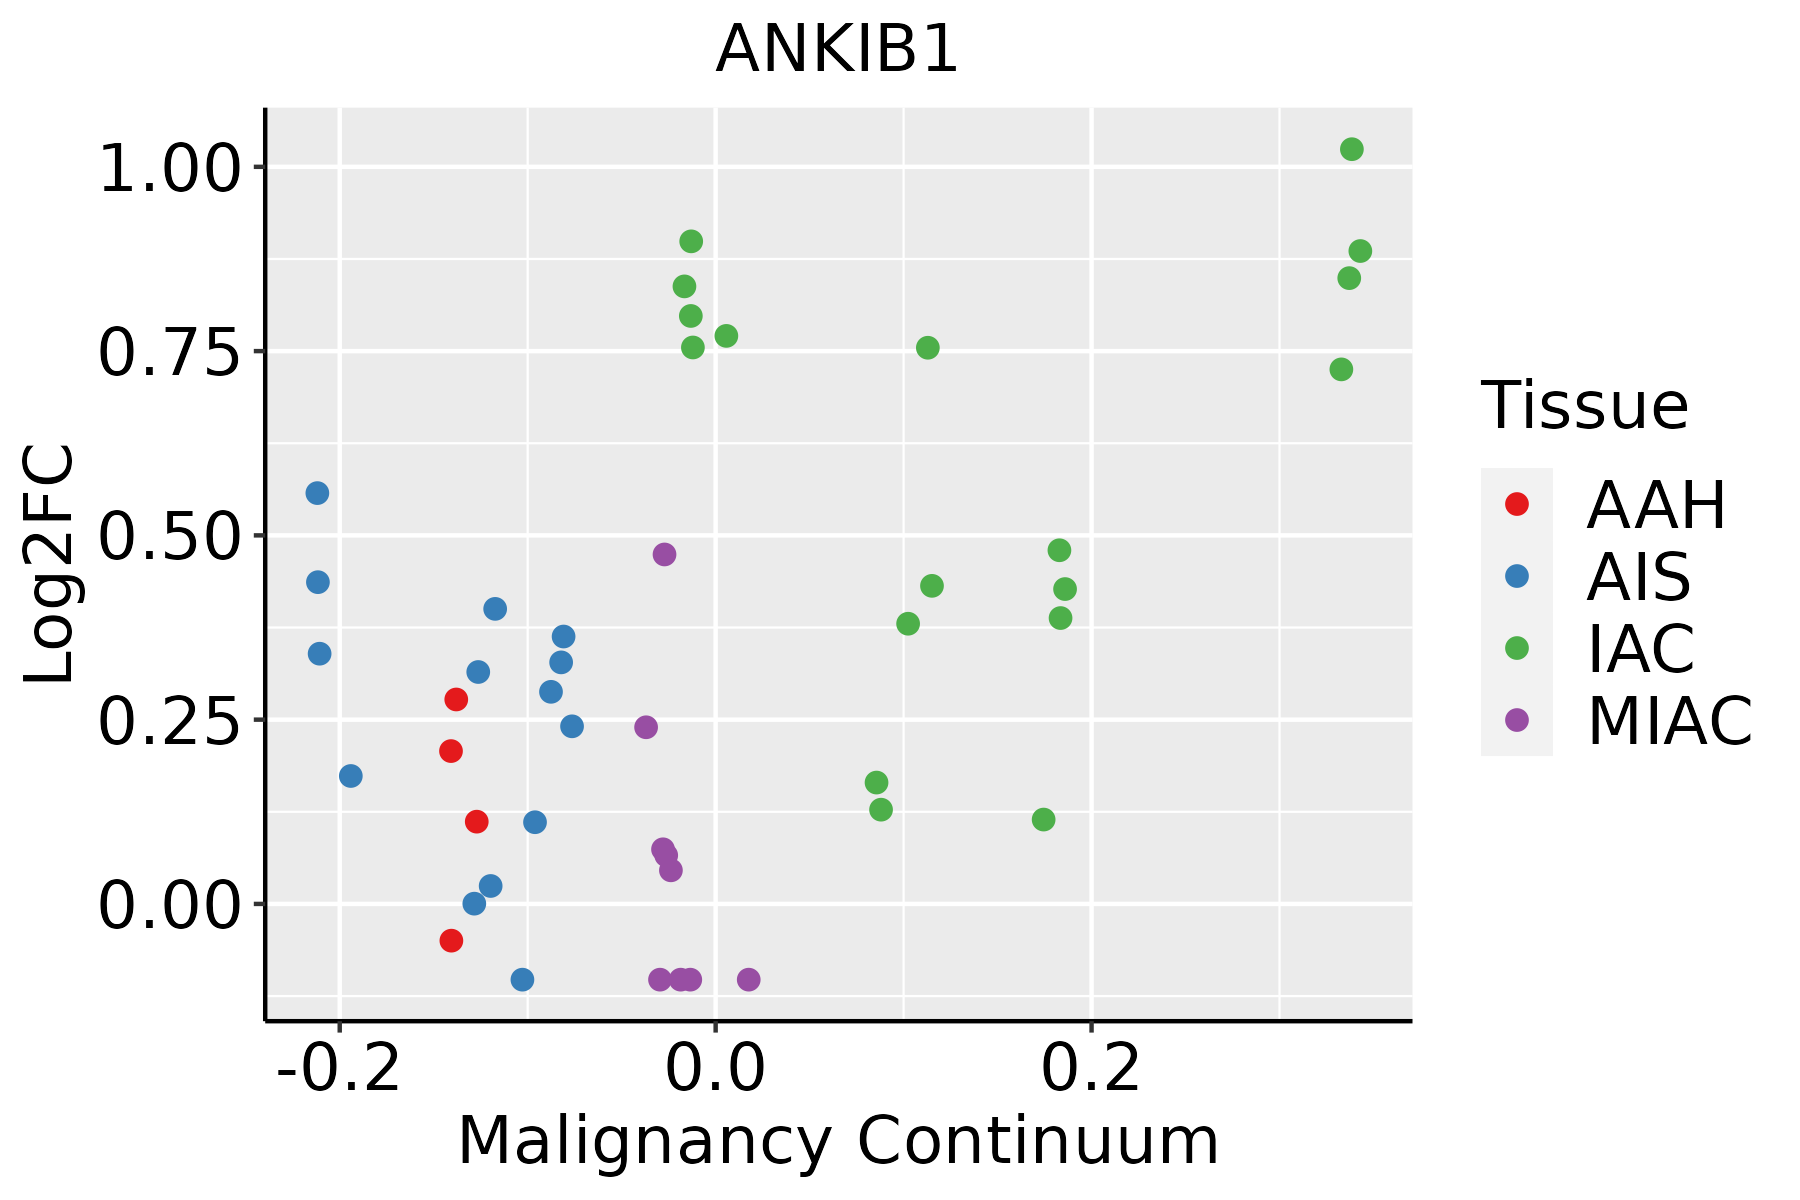
AAH: Atypical adenomatous hyperplasia
AIS: Adenocarcinoma in situ
IAC: Invasive lung adenocarcinoma
MIA: Minimally invasive adenocarcinoma
Oral CavityThe image shows the transcriptomic changes along malignancy continuum.log2FC in expression of this searched gene in stem-like cells from each diseased tissue sample relative to stem-like cells in normal samples in each tissue plotted against the malignancy continuum. Samples are colored based on if they are from different disease stage.
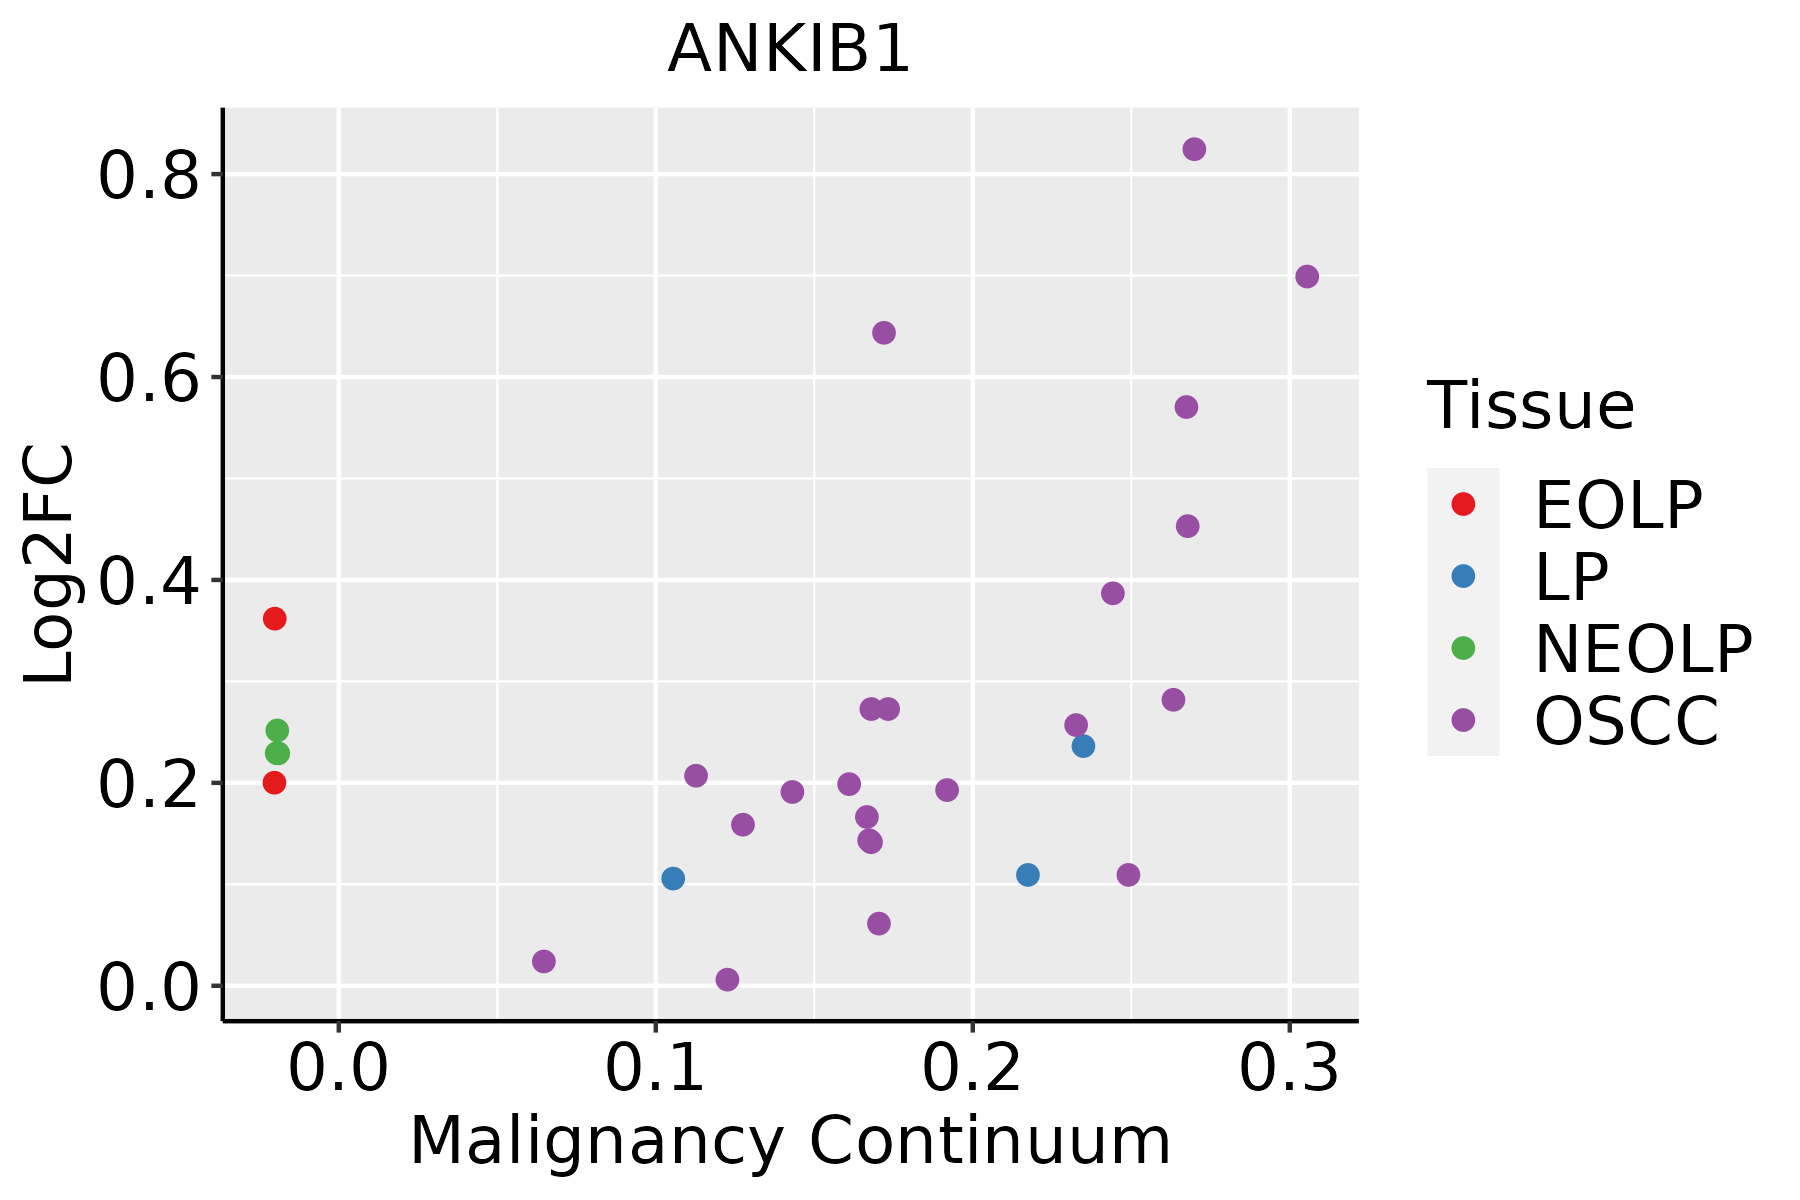
EOLP: Erosive Oral lichen planus
LP: leukoplakia
NEOLP: Non-erosive oral lichen planus
OSCC: Oral squamous cell carcinoma
ProstateThe image shows the transcriptomic changes along malignancy continuum.log2FC in expression of this searched gene in stem-like cells from each diseased tissue sample relative to stem-like cells in normal samples in each tissue plotted against the malignancy continuum. Samples are colored based on if they are from different disease stage.BPH: Benign Prostatic Hyperplasia
SkinThe image shows the transcriptomic changes along malignancy continuum.log2FC in expression of this searched gene in stem-like cells from each diseased tissue sample relative to stem-like cells in normal samples in each tissue plotted against the malignancy continuum. Samples are colored based on if they are from different disease stage.
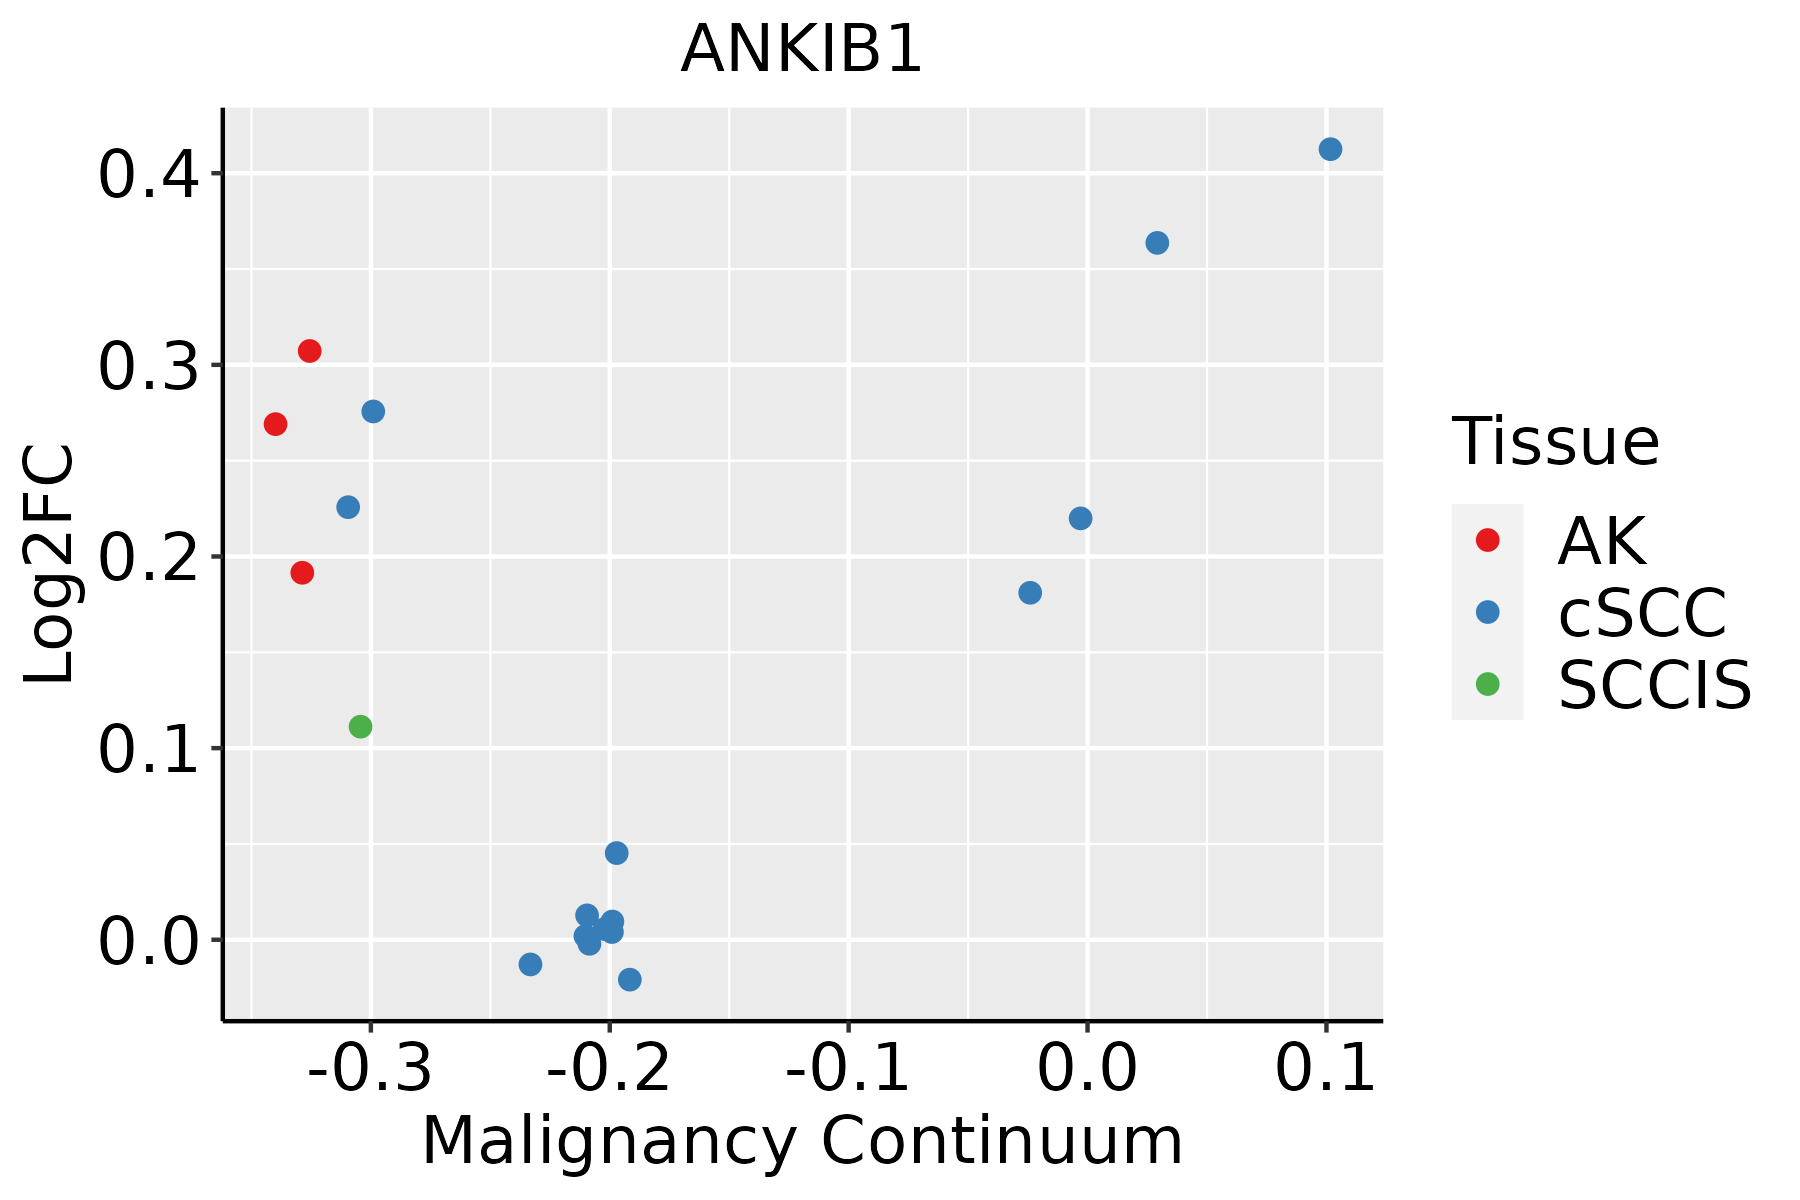
AK: Actinic keratosis
cSCC: Cutaneous squamous cell carcinoma
SCCIS:squamous cell carcinoma in situ
ThyroidThe image shows the transcriptomic changes along malignancy continuum.log2FC in expression of this searched gene in stem-like cells from each diseased tissue sample relative to stem-like cells in normal samples in each tissue plotted against the malignancy continuum. Samples are colored based on if they are from different disease stage.ATC: Anaplastic thyroid cancer
HT: Hashimoto's thyroiditis
PTC: Papillary thyroid cancer
∗log2FC in expression of this searched gene in stem-like cells from each diseased tissue sample relative to stem-like cells in normal samples in each tissue plotted against the malignancy continuum. Samples are colored based on if they are from different disease stage.

Top

Malignant transformation related pathway analysis

check buttonFind out the enriched GO biological processes and KEGG pathways involved in transition from healthy to precancer to cancer
check button Figure of enriched GO biological processes.
TissueDisease StageEnriched GO biological Processes
ColorectumADGO analysis - Figure of enriched GO biological processes: Top 15 enriched GO BP terms are showed in the bar plot of each disease state in each tissue. Each row represents a significant GO biological process which is colored according to the -log10(p.adjust).
ColorectumSERGO analysis - Figure of enriched GO biological processes: Top 15 enriched GO BP terms are showed in the bar plot of each disease state in each tissue. Each row represents a significant GO biological process which is colored according to the -log10(p.adjust).
ColorectumMSSGO analysis - Figure of enriched GO biological processes: Top 15 enriched GO BP terms are showed in the bar plot of each disease state in each tissue. Each row represents a significant GO biological process which is colored according to the -log10(p.adjust).
ColorectumMSI-HGO analysis - Figure of enriched GO biological processes: Top 15 enriched GO BP terms are showed in the bar plot of each disease state in each tissue. Each row represents a significant GO biological process which is colored according to the -log10(p.adjust).
ColorectumFAPGO analysis - Figure of enriched GO biological processes: Top 15 enriched GO BP terms are showed in the bar plot of each disease state in each tissue. Each row represents a significant GO biological process which is colored according to the -log10(p.adjust).
∗Top 15 enriched GO BP terms are showed in the bar plot of each disease state in each tissue. Each row represents a significant GO biological process which is colored according to the -log10(p.adjust).
Page: 1 2 3 4 5 6 7 8 9 

check button Enriched GO biological processes.
GO IDTissueDisease StageDescriptionGene RatioBg Ratiopvaluep.adjustCount
GO:004217610CervixCCregulation of protein catabolic process104/2311391/187239.39e-159.36e-12104
GO:004586210CervixCCpositive regulation of proteolysis95/2311372/187231.84e-126.86e-1095
GO:190336210CervixCCregulation of cellular protein catabolic process72/2311255/187235.98e-122.10e-0972
GO:004573210CervixCCpositive regulation of protein catabolic process65/2311231/187237.44e-111.39e-0865
GO:001049810CervixCCproteasomal protein catabolic process111/2311490/187238.98e-111.58e-08111
GO:000989610CervixCCpositive regulation of catabolic process109/2311492/187235.26e-106.99e-08109
GO:190305010CervixCCregulation of proteolysis involved in cellular protein catabolic process60/2311221/187231.82e-091.98e-0760
GO:200005810CervixCCregulation of ubiquitin-dependent protein catabolic process47/2311164/187231.63e-081.25e-0647
GO:004316110CervixCCproteasome-mediated ubiquitin-dependent protein catabolic process91/2311412/187231.65e-081.25e-0691
GO:003133110CervixCCpositive regulation of cellular catabolic process91/2311427/187239.64e-085.25e-0691
GO:00002097CervixCCprotein polyubiquitination58/2311236/187231.57e-077.41e-0658
GO:190336410CervixCCpositive regulation of cellular protein catabolic process43/2311155/187231.80e-078.28e-0643
GO:006113610CervixCCregulation of proteasomal protein catabolic process48/2311187/187234.63e-071.77e-0548
GO:003243410CervixCCregulation of proteasomal ubiquitin-dependent protein catabolic process38/2311134/187234.99e-071.88e-0538
GO:19030528CervixCCpositive regulation of proteolysis involved in cellular protein catabolic process34/2311133/187232.28e-054.01e-0434
GO:200006010CervixCCpositive regulation of ubiquitin-dependent protein catabolic process29/2311107/187232.77e-054.62e-0429
GO:00324369CervixCCpositive regulation of proteasomal ubiquitin-dependent protein catabolic process25/231190/187236.22e-058.90e-0425
GO:19018008CervixCCpositive regulation of proteasomal protein catabolic process29/2311114/187239.71e-051.27e-0329
GO:0042176ColorectumADregulation of protein catabolic process160/3918391/187231.06e-197.34e-17160
GO:0009896ColorectumADpositive regulation of catabolic process180/3918492/187234.33e-161.94e-13180
Page: 1 2 3 4 5 6 7 8 9 10 11 12 13 14 15 16 17 18 

check button Enriched KEGG pathways.
Pathway IDTissueDisease StageDescriptionGene RatioBg Ratiopvaluep.adjustqvalueCount
Page: 1 

Top

Cell-cell communication analysis

check buttonIdentification of potential cell-cell interactions between two cell types and their ligand-receptor pairs for different disease states
LigandReceptorLRpairPathwayTissueDisease Stage
Page: 1 

Top

Single-cell gene regulatory network inference analysis

check buttonFind out the significant the regulons (TFs) and the target genes of each regulon across cell types for different disease states
TFCell TypeTissueDisease StageTarget GeneRSSRegulon Activity
∗The dot plots of a searched regulon are shown for all cell subpopulations in each disease state of each tissue based on the regulon specific score inferred using pySCENIC and by calculating the average expression.
Page: 1 

Top

Somatic mutation of malignant transformation related genes

check buttonAnnotation of somatic variants for genes involved in malignant transformation
Hugo SymbolVariant ClassVariant ClassificationdbSNP RSHGVScHGVSpHGVSp ShortSWISSPROTBIOTYPESIFTPolyPhenTumor Sample BarcodeTissueHistologySexAgeStageTherapy TypesDrugsOutcome
ANKIB1SNVMissense_Mutationnovelc.898N>Tp.Asp300Tyrp.D300YQ9P2G1protein_codingdeleterious(0)probably_damaging(0.921)TCGA-A2-A25A-01Breastbreast invasive carcinomaFemale<65I/IIUnspecificCytoxanSD
ANKIB1SNVMissense_Mutationnovelc.2602N>Tp.Gly868Trpp.G868WQ9P2G1protein_codingdeleterious_low_confidence(0)probably_damaging(0.936)TCGA-A7-A0DB-01Breastbreast invasive carcinomaFemale<65I/IIHormone TherapyarimidexSD
ANKIB1SNVMissense_Mutationnovelc.733N>Tp.Ala245Serp.A245SQ9P2G1protein_codingtolerated(0.35)possibly_damaging(0.473)TCGA-A7-A3J1-01Breastbreast invasive carcinomaFemale<65I/IIHormone TherapyanastrazoleSD
ANKIB1SNVMissense_Mutationc.1879N>Cp.Glu627Glnp.E627QQ9P2G1protein_codingtolerated(0.23)benign(0.387)TCGA-D8-A1JA-01Breastbreast invasive carcinomaFemale<65III/IVChemotherapyadriamycinPD
ANKIB1SNVMissense_Mutationrs191723687c.613N>Tp.Arg205Trpp.R205WQ9P2G1protein_codingdeleterious(0.02)possibly_damaging(0.862)TCGA-D8-A1Y1-01Breastbreast invasive carcinomaFemale>=65III/IVHormone TherapytamoxiphenPD
ANKIB1SNVMissense_Mutationnovelc.798N>Tp.Arg266Serp.R266SQ9P2G1protein_codingtolerated(0.08)probably_damaging(0.917)TCGA-EW-A1P7-01Breastbreast invasive carcinomaFemale<65I/IIChemotherapycarboplatinPD
ANKIB1SNVMissense_Mutationrs748508968c.460N>Tp.Ala154Serp.A154SQ9P2G1protein_codingtolerated(0.06)possibly_damaging(0.578)TCGA-EW-A1PD-01Breastbreast invasive carcinomaMale<65I/IIChemotherapydocetaxelSD
ANKIB1SNVMissense_Mutationnovelc.2888N>Gp.Pro963Argp.P963RQ9P2G1protein_codingdeleterious_low_confidence(0.02)benign(0.1)TCGA-LL-A5YP-01Breastbreast invasive carcinomaFemale<65I/IIChemotherapycytoxanSD
ANKIB1insertionFrame_Shift_Insnovelc.2972_2973insGCTTTCCTATTTCTTCCTTCCATTCTp.Thr992LeufsTer9p.T992Lfs*9Q9P2G1protein_codingTCGA-A8-A09E-01Breastbreast invasive carcinomaFemale>=65III/IVHormone TherapyanastrozoleSD
ANKIB1insertionFrame_Shift_Insrs201434379c.429_430insAp.Asn146LysfsTer29p.N146Kfs*29Q9P2G1protein_codingTCGA-AN-A0AK-01Breastbreast invasive carcinomaFemale>=65I/IIUnknownUnknownSD
Page: 1 2 3 4 5 6 7 8 9 10 11 12 13 14 

Top

Related drugs of malignant transformation related genes

check buttonIdentification of chemicals and drugs interact with genes involved in malignant transfromation
(DGIdb 4.0)
Entrez IDSymbolCategoryInteraction TypesDrug Claim NameDrug NamePMIDs
Page: 1