
|
|||||
|
 | |
| |
| |
| |
| |
| |
|
Gene: ANKFN1 |
Gene summary for ANKFN1 |
| Gene information | Species | Human | Gene symbol | ANKFN1 | Gene ID | 162282 |
| Gene name | ankyrin repeat and fibronectin type III domain containing 1 | |
| Gene Alias | ANKFN1 | |
| Cytomap | 17q22 | |
| Gene Type | protein-coding | GO ID | GO:0000132 | UniProtAcc | Q8N957 |
Top |
Malignant transformation analysis |
| Identification of the aberrant gene expression in precancerous and cancerous lesions by comparing the gene expression of stem-like cells in diseased tissues with normal stem cells |
| Entrez ID | Symbol | Replicates | Species | Organ | Tissue | Adj P-value | Log2FC | Malignancy |
| 162282 | ANKFN1 | HTA11_3410_2000001011 | Human | Colorectum | AD | 4.21e-59 | 1.12e+00 | 0.0155 |
| 162282 | ANKFN1 | HTA11_2487_2000001011 | Human | Colorectum | SER | 7.43e-25 | 8.26e-01 | -0.1808 |
| 162282 | ANKFN1 | HTA11_2951_2000001011 | Human | Colorectum | AD | 1.33e-06 | 5.99e-01 | 0.0216 |
| 162282 | ANKFN1 | HTA11_1938_2000001011 | Human | Colorectum | AD | 5.11e-31 | 1.03e+00 | -0.0811 |
| 162282 | ANKFN1 | HTA11_78_2000001011 | Human | Colorectum | AD | 7.56e-19 | 7.11e-01 | -0.1088 |
| 162282 | ANKFN1 | HTA11_347_2000001011 | Human | Colorectum | AD | 7.03e-46 | 9.07e-01 | -0.1954 |
| 162282 | ANKFN1 | HTA11_411_2000001011 | Human | Colorectum | SER | 1.34e-08 | 9.94e-01 | -0.2602 |
| 162282 | ANKFN1 | HTA11_2112_2000001011 | Human | Colorectum | SER | 9.43e-12 | 8.27e-01 | -0.2196 |
| 162282 | ANKFN1 | HTA11_3361_2000001011 | Human | Colorectum | AD | 5.69e-25 | 8.67e-01 | -0.1207 |
| 162282 | ANKFN1 | HTA11_83_2000001011 | Human | Colorectum | SER | 1.60e-23 | 1.02e+00 | -0.1526 |
| 162282 | ANKFN1 | HTA11_696_2000001011 | Human | Colorectum | AD | 4.36e-51 | 1.15e+00 | -0.1464 |
| 162282 | ANKFN1 | HTA11_866_2000001011 | Human | Colorectum | AD | 2.89e-19 | 5.30e-01 | -0.1001 |
| 162282 | ANKFN1 | HTA11_1391_2000001011 | Human | Colorectum | AD | 4.98e-21 | 5.46e-01 | -0.059 |
| 162282 | ANKFN1 | HTA11_2992_2000001011 | Human | Colorectum | SER | 1.21e-27 | 1.27e+00 | -0.1706 |
| 162282 | ANKFN1 | HTA11_5212_2000001011 | Human | Colorectum | AD | 3.91e-38 | 1.59e+00 | -0.2061 |
| 162282 | ANKFN1 | HTA11_5216_2000001011 | Human | Colorectum | SER | 4.10e-19 | 1.27e+00 | -0.1462 |
| 162282 | ANKFN1 | HTA11_546_2000001011 | Human | Colorectum | AD | 8.14e-34 | 1.27e+00 | -0.0842 |
| 162282 | ANKFN1 | HTA11_10623_2000001011 | Human | Colorectum | AD | 2.31e-02 | 2.61e-01 | -0.0177 |
| 162282 | ANKFN1 | HTA11_6801_2000001011 | Human | Colorectum | SER | 5.49e-03 | 3.40e-01 | 0.0171 |
| 162282 | ANKFN1 | HTA11_6818_2000001011 | Human | Colorectum | AD | 5.20e-06 | 4.59e-01 | 0.0112 |
| Page: 1 2 |
| Tissue | Expression Dynamics | Abbreviation |
| Colorectum (GSE201348) |  | FAP: Familial adenomatous polyposis |
| CRC: Colorectal cancer | ||
| Colorectum (HTA11) |  | AD: Adenomas |
| SER: Sessile serrated lesions | ||
| MSI-H: Microsatellite-high colorectal cancer | ||
| MSS: Microsatellite stable colorectal cancer | ||
| Endometrium | 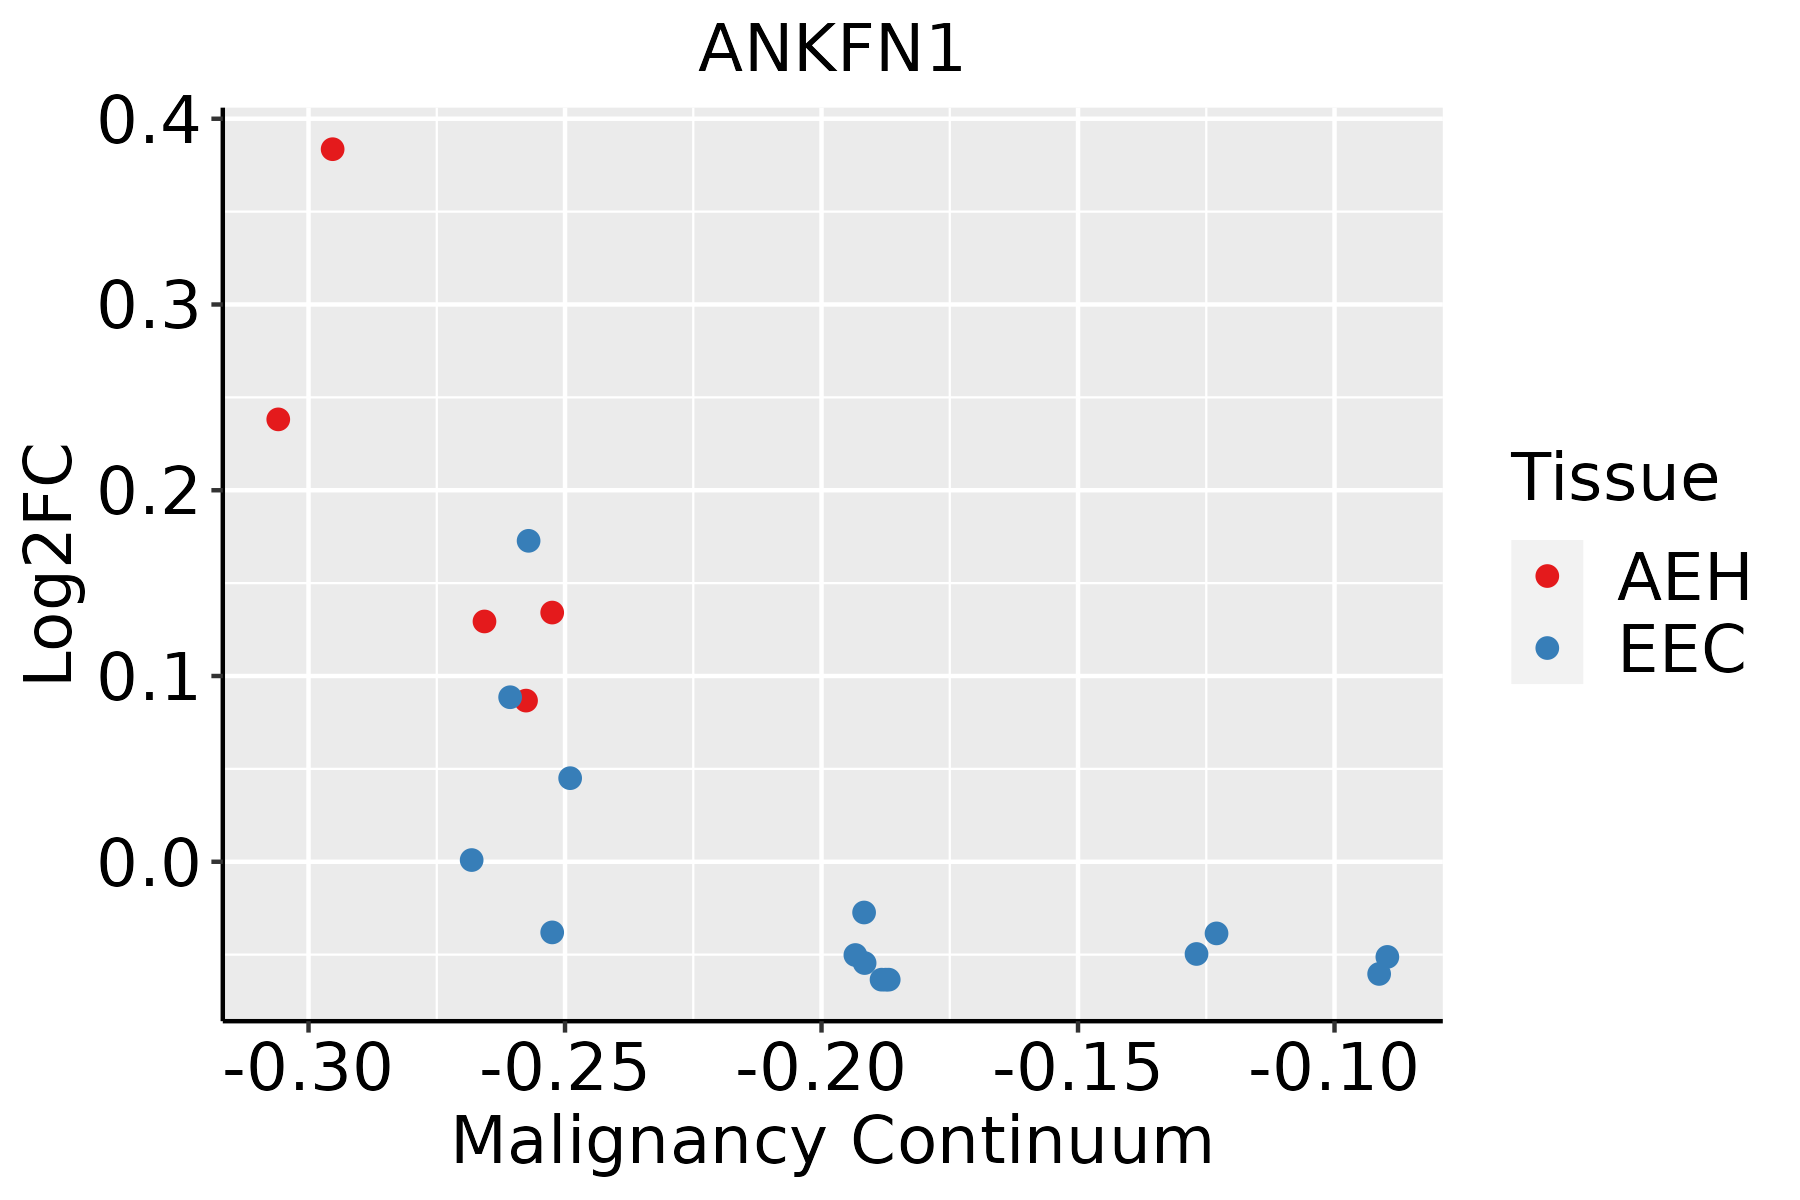 | AEH: Atypical endometrial hyperplasia |
| EEC: Endometrioid Cancer | ||
| Lung | 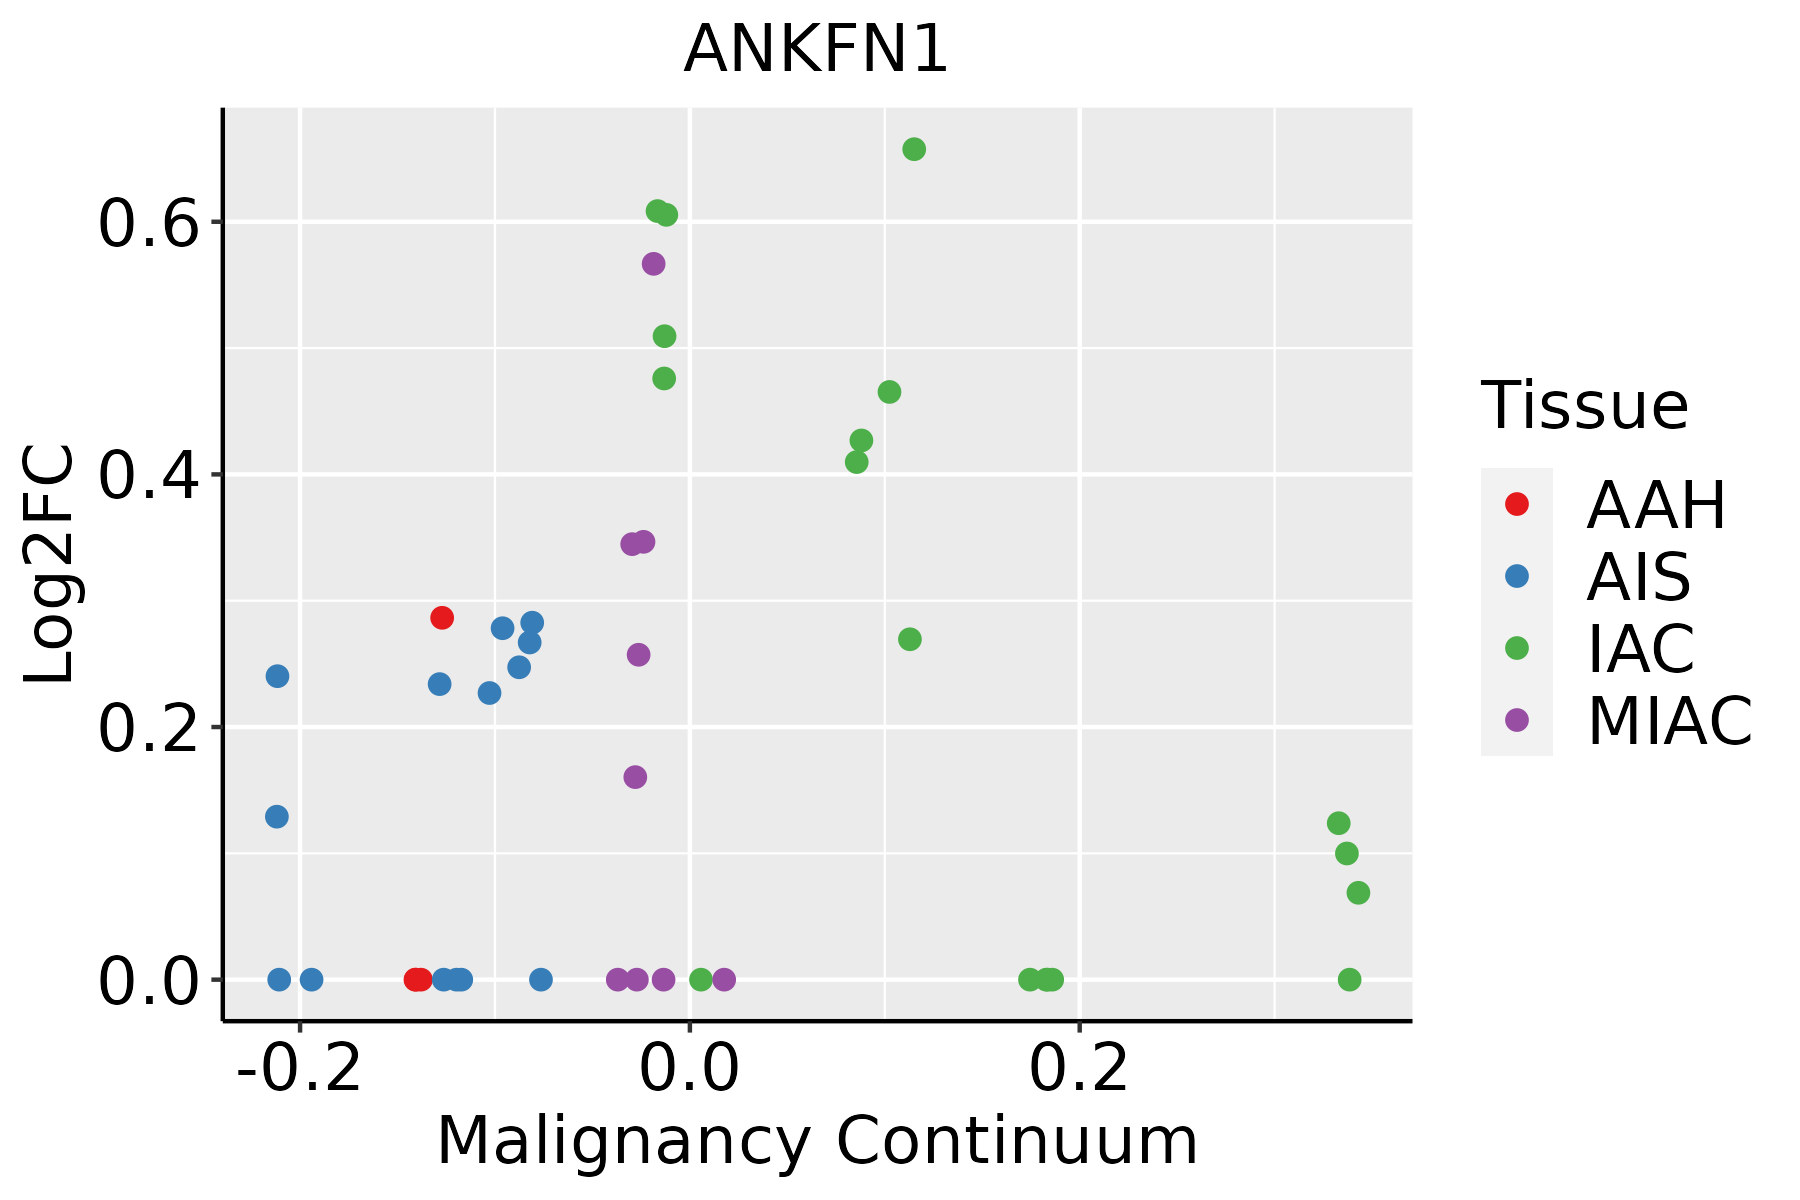 | AAH: Atypical adenomatous hyperplasia |
| AIS: Adenocarcinoma in situ | ||
| IAC: Invasive lung adenocarcinoma | ||
| MIA: Minimally invasive adenocarcinoma |
| ∗log2FC in expression of this searched gene in stem-like cells from each diseased tissue sample relative to stem-like cells in normal samples in each tissue plotted against the malignancy continuum. Samples are colored based on if they are from different disease stage. |
Top |
Malignant transformation related pathway analysis |
| Find out the enriched GO biological processes and KEGG pathways involved in transition from healthy to precancer to cancer |
| Tissue | Disease Stage | Enriched GO biological Processes |
| Colorectum | AD |  |
| Colorectum | SER |  |
| Colorectum | MSS |  |
| Colorectum | MSI-H |  |
| Colorectum | FAP |  |
| ∗Top 15 enriched GO BP terms are showed in the bar plot of each disease state in each tissue. Each row represents a significant GO biological process which is colored according to the -log10(p.adjust). |
| Page: 1 2 3 4 5 6 7 8 9 |
| GO ID | Tissue | Disease Stage | Description | Gene Ratio | Bg Ratio | pvalue | p.adjust | Count |
| GO:0051656 | Colorectum | AD | establishment of organelle localization | 131/3918 | 390/18723 | 3.00e-09 | 2.06e-07 | 131 |
| GO:0007163 | Colorectum | AD | establishment or maintenance of cell polarity | 77/3918 | 218/18723 | 5.72e-07 | 2.08e-05 | 77 |
| GO:0030010 | Colorectum | AD | establishment of cell polarity | 50/3918 | 143/18723 | 6.90e-05 | 1.11e-03 | 50 |
| GO:1902850 | Colorectum | AD | microtubule cytoskeleton organization involved in mitosis | 48/3918 | 147/18723 | 5.87e-04 | 6.21e-03 | 48 |
| GO:0032878 | Colorectum | AD | regulation of establishment or maintenance of cell polarity | 12/3918 | 25/18723 | 2.30e-03 | 1.80e-02 | 12 |
| GO:2000114 | Colorectum | AD | regulation of establishment of cell polarity | 11/3918 | 22/18723 | 2.32e-03 | 1.80e-02 | 11 |
| GO:00516561 | Colorectum | SER | establishment of organelle localization | 100/2897 | 390/18723 | 1.11e-07 | 6.79e-06 | 100 |
| GO:00071631 | Colorectum | SER | establishment or maintenance of cell polarity | 60/2897 | 218/18723 | 3.45e-06 | 1.33e-04 | 60 |
| GO:00328781 | Colorectum | SER | regulation of establishment or maintenance of cell polarity | 11/2897 | 25/18723 | 6.43e-04 | 8.67e-03 | 11 |
| GO:20001141 | Colorectum | SER | regulation of establishment of cell polarity | 10/2897 | 22/18723 | 8.31e-04 | 1.02e-02 | 10 |
| GO:00300101 | Colorectum | SER | establishment of cell polarity | 37/2897 | 143/18723 | 8.72e-04 | 1.06e-02 | 37 |
| GO:00516562 | Colorectum | MSS | establishment of organelle localization | 115/3467 | 390/18723 | 7.30e-08 | 3.67e-06 | 115 |
| GO:00071632 | Colorectum | MSS | establishment or maintenance of cell polarity | 72/3467 | 218/18723 | 1.90e-07 | 8.30e-06 | 72 |
| GO:00300102 | Colorectum | MSS | establishment of cell polarity | 47/3467 | 143/18723 | 2.74e-05 | 5.58e-04 | 47 |
| GO:19028501 | Colorectum | MSS | microtubule cytoskeleton organization involved in mitosis | 44/3467 | 147/18723 | 5.17e-04 | 5.98e-03 | 44 |
| GO:20001142 | Colorectum | MSS | regulation of establishment of cell polarity | 10/3467 | 22/18723 | 3.42e-03 | 2.56e-02 | 10 |
| GO:000716310 | Endometrium | AEH | establishment or maintenance of cell polarity | 54/2100 | 218/18723 | 1.30e-08 | 8.47e-07 | 54 |
| GO:00516568 | Endometrium | AEH | establishment of organelle localization | 77/2100 | 390/18723 | 4.89e-07 | 1.94e-05 | 77 |
| GO:00300109 | Endometrium | AEH | establishment of cell polarity | 36/2100 | 143/18723 | 2.19e-06 | 6.49e-05 | 36 |
| GO:00328787 | Endometrium | AEH | regulation of establishment or maintenance of cell polarity | 10/2100 | 25/18723 | 2.05e-04 | 2.54e-03 | 10 |
| Page: 1 2 |
| Pathway ID | Tissue | Disease Stage | Description | Gene Ratio | Bg Ratio | pvalue | p.adjust | qvalue | Count |
| Page: 1 |
Top |
Cell-cell communication analysis |
| Identification of potential cell-cell interactions between two cell types and their ligand-receptor pairs for different disease states |
| Ligand | Receptor | LRpair | Pathway | Tissue | Disease Stage |
| Page: 1 |
Top |
Single-cell gene regulatory network inference analysis |
| Find out the significant the regulons (TFs) and the target genes of each regulon across cell types for different disease states |
| TF | Cell Type | Tissue | Disease Stage | Target Gene | RSS | Regulon Activity |
| ∗The dot plots of a searched regulon are shown for all cell subpopulations in each disease state of each tissue based on the regulon specific score inferred using pySCENIC and by calculating the average expression. |
| Page: 1 |
Top |
Somatic mutation of malignant transformation related genes |
| Annotation of somatic variants for genes involved in malignant transformation |
| Hugo Symbol | Variant Class | Variant Classification | dbSNP RS | HGVSc | HGVSp | HGVSp Short | SWISSPROT | BIOTYPE | SIFT | PolyPhen | Tumor Sample Barcode | Tissue | Histology | Sex | Age | Stage | Therapy Types | Drugs | Outcome |
| ANKFN1 | SNV | Missense_Mutation | novel | c.310N>G | p.Ser104Ala | p.S104A | Q8N957 | protein_coding | deleterious(0) | probably_damaging(0.97) | TCGA-A2-A4S1-01 | Breast | breast invasive carcinoma | Female | >=65 | I/II | Unknown | Unknown | SD |
| ANKFN1 | SNV | Missense_Mutation | rs763573020 | c.800N>G | p.His267Arg | p.H267R | Q8N957 | protein_coding | deleterious(0) | possibly_damaging(0.795) | TCGA-A8-A09A-01 | Breast | breast invasive carcinoma | Female | <65 | I/II | Hormone Therapy | tamoxiphen | SD |
| ANKFN1 | SNV | Missense_Mutation | c.2150N>C | p.Asn717Thr | p.N717T | Q8N957 | protein_coding | tolerated(0.06) | benign(0.236) | TCGA-A8-A09M-01 | Breast | breast invasive carcinoma | Female | >=65 | III/IV | Chemotherapy | paclitaxel | CR | |
| ANKFN1 | SNV | Missense_Mutation | c.216N>A | p.Met72Ile | p.M72I | Q8N957 | protein_coding | deleterious_low_confidence(0.01) | benign(0.204) | TCGA-AC-A23H-01 | Breast | breast invasive carcinoma | Female | >=65 | I/II | Unknown | Unknown | PD | |
| ANKFN1 | SNV | Missense_Mutation | c.1056N>A | p.Met352Ile | p.M352I | Q8N957 | protein_coding | deleterious(0.05) | probably_damaging(0.949) | TCGA-AC-A23H-01 | Breast | breast invasive carcinoma | Female | >=65 | I/II | Unknown | Unknown | PD | |
| ANKFN1 | SNV | Missense_Mutation | c.1123N>A | p.Asp375Asn | p.D375N | Q8N957 | protein_coding | deleterious(0.03) | benign(0.36) | TCGA-D8-A1XQ-01 | Breast | breast invasive carcinoma | Female | >=65 | I/II | Unknown | Unknown | SD | |
| ANKFN1 | SNV | Missense_Mutation | rs139388119 | c.2185N>A | p.Asp729Asn | p.D729N | Q8N957 | protein_coding | deleterious(0.01) | possibly_damaging(0.734) | TCGA-D8-A1XV-01 | Breast | breast invasive carcinoma | Female | >=65 | I/II | Unknown | Unknown | SD |
| ANKFN1 | SNV | Missense_Mutation | rs201192117 | c.1130G>A | p.Arg377Lys | p.R377K | Q8N957 | protein_coding | tolerated(0.33) | benign(0.084) | TCGA-D8-A27G-01 | Breast | breast invasive carcinoma | Female | >=65 | I/II | Unknown | Unknown | SD |
| ANKFN1 | SNV | Missense_Mutation | c.182N>G | p.Ser61Trp | p.S61W | Q8N957 | protein_coding | deleterious_low_confidence(0.01) | possibly_damaging(0.466) | TCGA-GM-A2DO-01 | Breast | breast invasive carcinoma | Female | <65 | I/II | Hormone Therapy | tamoxiphen | CR | |
| ANKFN1 | SNV | Missense_Mutation | novel | c.188N>A | p.Ser63Asn | p.S63N | Q8N957 | protein_coding | tolerated_low_confidence(0.22) | benign(0) | TCGA-LL-A73Y-01 | Breast | breast invasive carcinoma | Female | >=65 | I/II | Chemotherapy | taxotere | SD |
| Page: 1 2 3 4 5 6 7 8 9 10 11 12 13 14 15 |
Top |
Related drugs of malignant transformation related genes |
| Identification of chemicals and drugs interact with genes involved in malignant transfromation |
| (DGIdb 4.0) |
| Entrez ID | Symbol | Category | Interaction Types | Drug Claim Name | Drug Name | PMIDs |
| 162282 | ANKFN1 | NA | hydrochlorothiazide | HYDROCHLOROTHIAZIDE |
| Page: 1 |

Copyright 2023-Present -The University of Texas Health Science Center at Houston |