
|
|||||
|
 | |
| |
| |
| |
| |
| |
|
Gene: ANKEF1 |
Gene summary for ANKEF1 |
| Gene information | Species | Human | Gene symbol | ANKEF1 | Gene ID | 63926 |
| Gene name | ankyrin repeat and EF-hand domain containing 1 | |
| Gene Alias | ANKRD5 | |
| Cytomap | 20p12.2 | |
| Gene Type | protein-coding | GO ID | GO:0003674 | UniProtAcc | Q9NU02 |
Top |
Malignant transformation analysis |
| Identification of the aberrant gene expression in precancerous and cancerous lesions by comparing the gene expression of stem-like cells in diseased tissues with normal stem cells |
| Entrez ID | Symbol | Replicates | Species | Organ | Tissue | Adj P-value | Log2FC | Malignancy |
| 63926 | ANKEF1 | LZE4T | Human | Esophagus | ESCC | 9.66e-09 | 2.45e-01 | 0.0811 |
| 63926 | ANKEF1 | LZE20T | Human | Esophagus | ESCC | 3.16e-03 | 1.14e-01 | 0.0662 |
| 63926 | ANKEF1 | LZE22T | Human | Esophagus | ESCC | 1.57e-02 | 1.76e-01 | 0.068 |
| 63926 | ANKEF1 | LZE24T | Human | Esophagus | ESCC | 3.17e-06 | 1.75e-01 | 0.0596 |
| 63926 | ANKEF1 | LZE6T | Human | Esophagus | ESCC | 9.61e-05 | 1.88e-01 | 0.0845 |
| 63926 | ANKEF1 | P1T-E | Human | Esophagus | ESCC | 5.20e-08 | 2.61e-01 | 0.0875 |
| 63926 | ANKEF1 | P2T-E | Human | Esophagus | ESCC | 2.86e-20 | 3.36e-01 | 0.1177 |
| 63926 | ANKEF1 | P4T-E | Human | Esophagus | ESCC | 4.27e-09 | 2.06e-01 | 0.1323 |
| 63926 | ANKEF1 | P5T-E | Human | Esophagus | ESCC | 1.66e-02 | 1.07e-01 | 0.1327 |
| 63926 | ANKEF1 | P8T-E | Human | Esophagus | ESCC | 3.50e-02 | 1.17e-01 | 0.0889 |
| 63926 | ANKEF1 | P9T-E | Human | Esophagus | ESCC | 3.05e-07 | 1.66e-01 | 0.1131 |
| 63926 | ANKEF1 | P10T-E | Human | Esophagus | ESCC | 4.12e-11 | 1.94e-01 | 0.116 |
| 63926 | ANKEF1 | P11T-E | Human | Esophagus | ESCC | 2.94e-14 | 5.22e-01 | 0.1426 |
| 63926 | ANKEF1 | P12T-E | Human | Esophagus | ESCC | 3.75e-03 | 1.03e-01 | 0.1122 |
| 63926 | ANKEF1 | P15T-E | Human | Esophagus | ESCC | 7.99e-08 | 1.64e-01 | 0.1149 |
| 63926 | ANKEF1 | P16T-E | Human | Esophagus | ESCC | 4.40e-09 | 1.87e-01 | 0.1153 |
| 63926 | ANKEF1 | P17T-E | Human | Esophagus | ESCC | 7.64e-08 | 3.42e-01 | 0.1278 |
| 63926 | ANKEF1 | P20T-E | Human | Esophagus | ESCC | 2.16e-09 | 2.10e-01 | 0.1124 |
| 63926 | ANKEF1 | P21T-E | Human | Esophagus | ESCC | 3.95e-30 | 5.57e-01 | 0.1617 |
| 63926 | ANKEF1 | P22T-E | Human | Esophagus | ESCC | 2.02e-06 | 1.41e-01 | 0.1236 |
| Page: 1 2 3 |
| Tissue | Expression Dynamics | Abbreviation |
| Esophagus | 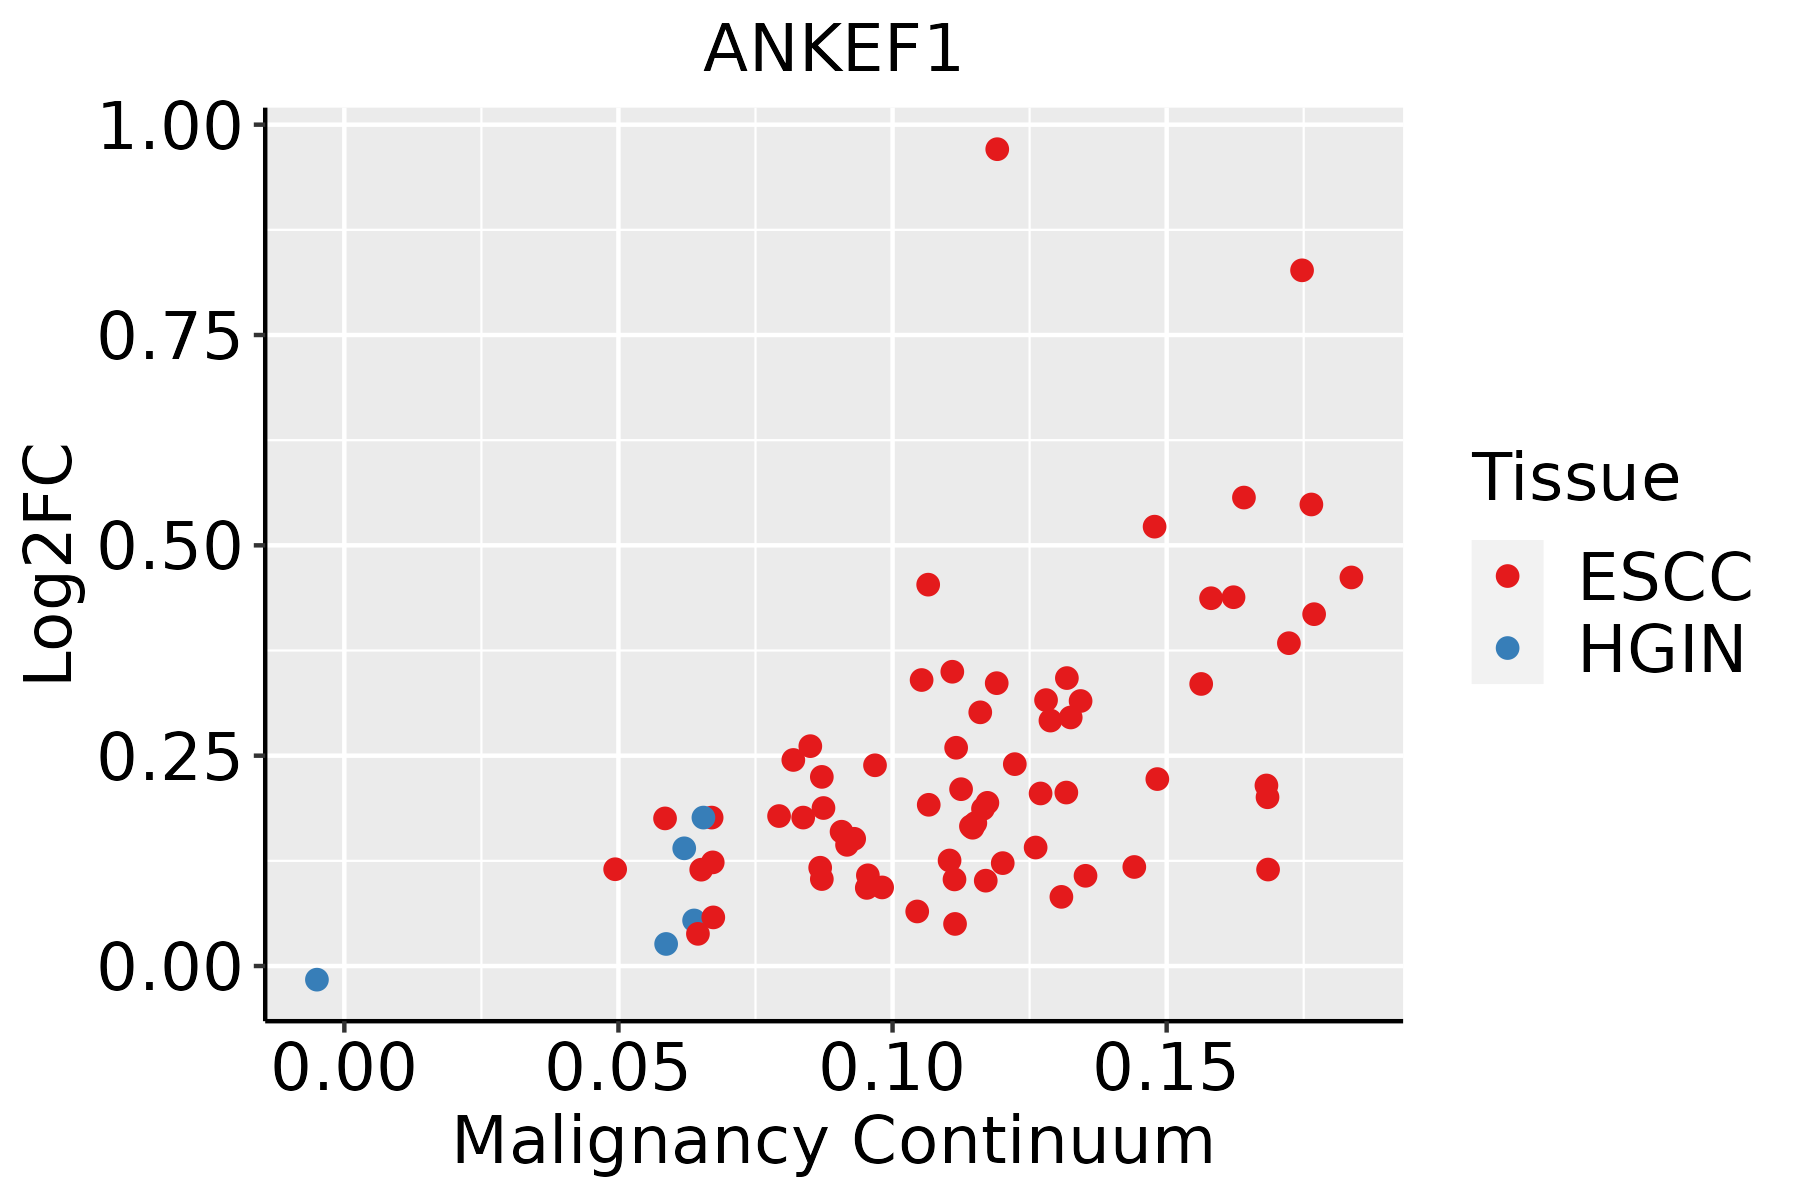 | ESCC: Esophageal squamous cell carcinoma |
| HGIN: High-grade intraepithelial neoplasias | ||
| LGIN: Low-grade intraepithelial neoplasias |
| ∗log2FC in expression of this searched gene in stem-like cells from each diseased tissue sample relative to stem-like cells in normal samples in each tissue plotted against the malignancy continuum. Samples are colored based on if they are from different disease stage. |
Top |
Malignant transformation related pathway analysis |
| Find out the enriched GO biological processes and KEGG pathways involved in transition from healthy to precancer to cancer |
| Tissue | Disease Stage | Enriched GO biological Processes |
| Colorectum | AD |  |
| Colorectum | SER |  |
| Colorectum | MSS |  |
| Colorectum | MSI-H |  |
| Colorectum | FAP |  |
| ∗Top 15 enriched GO BP terms are showed in the bar plot of each disease state in each tissue. Each row represents a significant GO biological process which is colored according to the -log10(p.adjust). |
| Page: 1 2 3 4 5 6 7 8 9 |
| GO ID | Tissue | Disease Stage | Description | Gene Ratio | Bg Ratio | pvalue | p.adjust | Count |
| Page: 1 |
| Pathway ID | Tissue | Disease Stage | Description | Gene Ratio | Bg Ratio | pvalue | p.adjust | qvalue | Count |
| Page: 1 |
Top |
Cell-cell communication analysis |
| Identification of potential cell-cell interactions between two cell types and their ligand-receptor pairs for different disease states |
| Ligand | Receptor | LRpair | Pathway | Tissue | Disease Stage |
| Page: 1 |
Top |
Single-cell gene regulatory network inference analysis |
| Find out the significant the regulons (TFs) and the target genes of each regulon across cell types for different disease states |
| TF | Cell Type | Tissue | Disease Stage | Target Gene | RSS | Regulon Activity |
| ∗The dot plots of a searched regulon are shown for all cell subpopulations in each disease state of each tissue based on the regulon specific score inferred using pySCENIC and by calculating the average expression. |
| Page: 1 |
Top |
Somatic mutation of malignant transformation related genes |
| Annotation of somatic variants for genes involved in malignant transformation |
| Hugo Symbol | Variant Class | Variant Classification | dbSNP RS | HGVSc | HGVSp | HGVSp Short | SWISSPROT | BIOTYPE | SIFT | PolyPhen | Tumor Sample Barcode | Tissue | Histology | Sex | Age | Stage | Therapy Types | Drugs | Outcome |
| ANKEF1 | SNV | Missense_Mutation | c.199C>T | p.Leu67Phe | p.L67F | Q9NU02 | protein_coding | deleterious(0.02) | probably_damaging(0.999) | TCGA-AC-A23H-01 | Breast | breast invasive carcinoma | Female | >=65 | I/II | Unknown | Unknown | PD | |
| ANKEF1 | SNV | Missense_Mutation | rs139485632 | c.61N>T | p.Arg21Trp | p.R21W | Q9NU02 | protein_coding | deleterious(0) | probably_damaging(0.977) | TCGA-AN-A046-01 | Breast | breast invasive carcinoma | Female | >=65 | I/II | Unknown | Unknown | SD |
| ANKEF1 | SNV | Missense_Mutation | novel | c.208N>T | p.Leu70Phe | p.L70F | Q9NU02 | protein_coding | tolerated(0.64) | possibly_damaging(0.549) | TCGA-BH-A0BJ-01 | Breast | breast invasive carcinoma | Female | <65 | I/II | Chemotherapy | doxorubicin | SD |
| ANKEF1 | SNV | Missense_Mutation | novel | c.595N>A | p.Glu199Lys | p.E199K | Q9NU02 | protein_coding | tolerated(0.1) | possibly_damaging(0.824) | TCGA-C8-A26V-01 | Breast | breast invasive carcinoma | Female | <65 | III/IV | Hormone Therapy | tamoxiphen | CR |
| ANKEF1 | SNV | Missense_Mutation | c.587N>A | p.Gly196Glu | p.G196E | Q9NU02 | protein_coding | deleterious(0) | probably_damaging(1) | TCGA-E2-A1LE-01 | Breast | breast invasive carcinoma | Female | >=65 | III/IV | Chemotherapy | herceptin | PD | |
| ANKEF1 | insertion | Nonsense_Mutation | novel | c.518_519insCAGTCACAACCACATATGAT | p.Lys173AsnfsTer7 | p.K173Nfs*7 | Q9NU02 | protein_coding | TCGA-AR-A0U0-01 | Breast | breast invasive carcinoma | Female | >=65 | I/II | Unknown | Unknown | SD | ||
| ANKEF1 | SNV | Missense_Mutation | novel | c.2009N>C | p.Glu670Ala | p.E670A | Q9NU02 | protein_coding | tolerated(0.47) | benign(0.006) | TCGA-2W-A8YY-01 | Cervix | cervical & endocervical cancer | Female | <65 | I/II | Chemotherapy | cisplatin | CR |
| ANKEF1 | SNV | Missense_Mutation | rs145101692 | c.743N>T | p.Ser248Leu | p.S248L | Q9NU02 | protein_coding | tolerated(0.05) | benign(0.025) | TCGA-AA-3510-01 | Colorectum | colon adenocarcinoma | Male | >=65 | I/II | Unknown | Unknown | SD |
| ANKEF1 | SNV | Missense_Mutation | c.1594N>T | p.Ala532Ser | p.A532S | Q9NU02 | protein_coding | deleterious(0) | probably_damaging(0.999) | TCGA-AA-3860-01 | Colorectum | colon adenocarcinoma | Female | <65 | III/IV | Chemotherapy | folinic | CR | |
| ANKEF1 | SNV | Missense_Mutation | rs145101692 | c.743C>T | p.Ser248Leu | p.S248L | Q9NU02 | protein_coding | tolerated(0.05) | benign(0.025) | TCGA-AA-3984-01 | Colorectum | colon adenocarcinoma | Female | <65 | I/II | Unknown | Unknown | SD |
| Page: 1 2 3 4 5 6 7 8 9 |
Top |
Related drugs of malignant transformation related genes |
| Identification of chemicals and drugs interact with genes involved in malignant transfromation |
| (DGIdb 4.0) |
| Entrez ID | Symbol | Category | Interaction Types | Drug Claim Name | Drug Name | PMIDs |
| Page: 1 |

Copyright 2023-Present -The University of Texas Health Science Center at Houston |