
|
|||||
|
 | |
| |
| |
| |
| |
| |
|
Gene: ANGPTL8 |
Gene summary for ANGPTL8 |
| Gene information | Species | Human | Gene symbol | ANGPTL8 | Gene ID | 55908 |
| Gene name | angiopoietin like 8 | |
| Gene Alias | C19orf80 | |
| Cytomap | 19p13.2 | |
| Gene Type | protein-coding | GO ID | GO:0006508 | UniProtAcc | Q6UXH0 |
Top |
Malignant transformation analysis |
| Identification of the aberrant gene expression in precancerous and cancerous lesions by comparing the gene expression of stem-like cells in diseased tissues with normal stem cells |
| Entrez ID | Symbol | Replicates | Species | Organ | Tissue | Adj P-value | Log2FC | Malignancy |
| 55908 | ANGPTL8 | NAFLD1 | Human | Liver | NAFLD | 3.48e-06 | 5.26e-01 | -0.04 |
| 55908 | ANGPTL8 | HCC1_Meng | Human | Liver | HCC | 2.29e-104 | 1.08e+00 | 0.0246 |
| 55908 | ANGPTL8 | S029 | Human | Liver | HCC | 3.88e-02 | 2.79e-01 | 0.2581 |
| Page: 1 |
| Tissue | Expression Dynamics | Abbreviation |
| Liver | 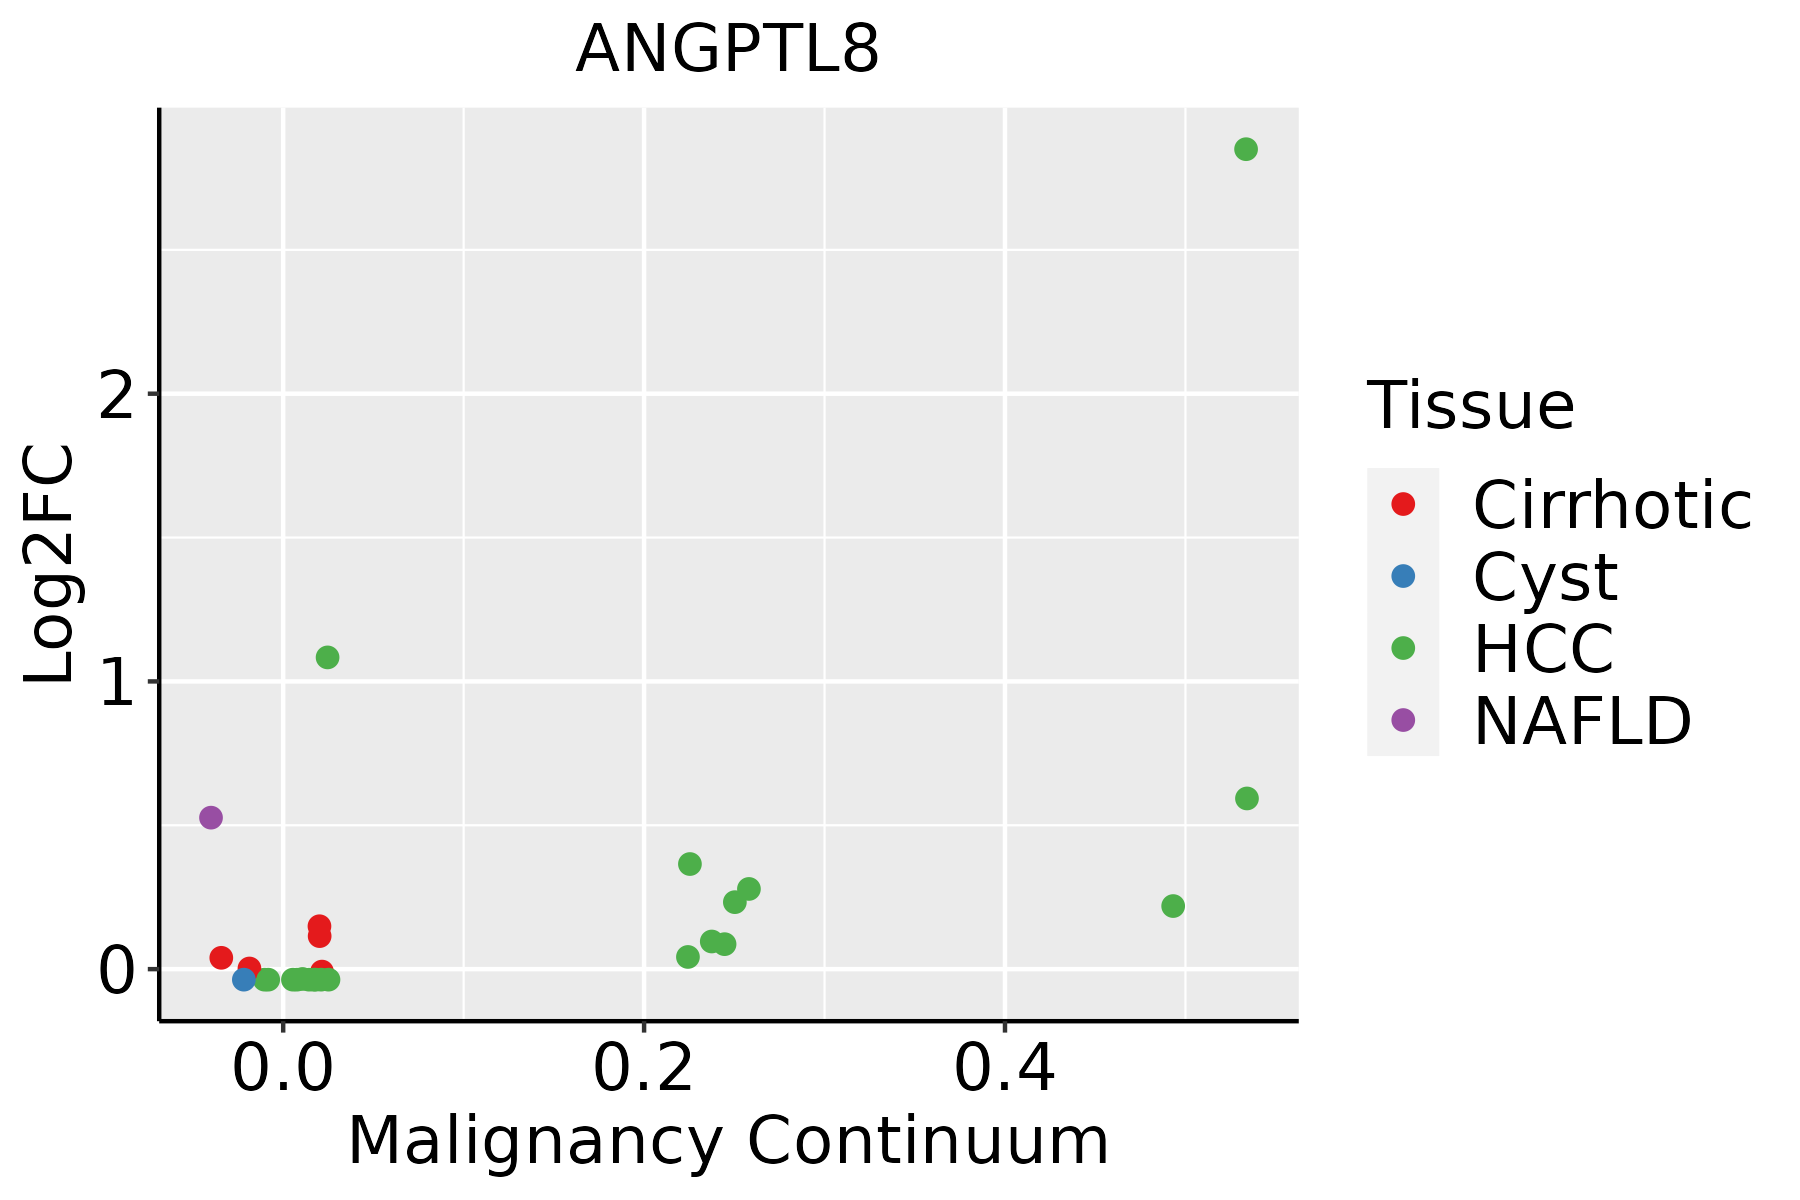 | HCC: Hepatocellular carcinoma |
| NAFLD: Non-alcoholic fatty liver disease |
| ∗log2FC in expression of this searched gene in stem-like cells from each diseased tissue sample relative to stem-like cells in normal samples in each tissue plotted against the malignancy continuum. Samples are colored based on if they are from different disease stage. |
Top |
Malignant transformation related pathway analysis |
| Find out the enriched GO biological processes and KEGG pathways involved in transition from healthy to precancer to cancer |
| Tissue | Disease Stage | Enriched GO biological Processes |
| Colorectum | AD |  |
| Colorectum | SER |  |
| Colorectum | MSS |  |
| Colorectum | MSI-H |  |
| Colorectum | FAP |  |
| ∗Top 15 enriched GO BP terms are showed in the bar plot of each disease state in each tissue. Each row represents a significant GO biological process which is colored according to the -log10(p.adjust). |
| Page: 1 2 3 4 5 6 7 8 9 |
| GO ID | Tissue | Disease Stage | Description | Gene Ratio | Bg Ratio | pvalue | p.adjust | Count |
| GO:00550883 | Liver | NAFLD | lipid homeostasis | 44/1882 | 167/18723 | 1.48e-09 | 2.54e-07 | 44 |
| GO:0055090 | Liver | NAFLD | acylglycerol homeostasis | 17/1882 | 42/18723 | 2.22e-07 | 1.53e-05 | 17 |
| GO:0070328 | Liver | NAFLD | triglyceride homeostasis | 17/1882 | 42/18723 | 2.22e-07 | 1.53e-05 | 17 |
| GO:00192163 | Liver | NAFLD | regulation of lipid metabolic process | 61/1882 | 331/18723 | 2.18e-06 | 9.24e-05 | 61 |
| GO:00458627 | Liver | NAFLD | positive regulation of proteolysis | 65/1882 | 372/18723 | 6.58e-06 | 2.29e-04 | 65 |
| GO:004586222 | Liver | HCC | positive regulation of proteolysis | 232/7958 | 372/18723 | 5.66e-15 | 3.98e-13 | 232 |
| GO:005160412 | Liver | HCC | protein maturation | 171/7958 | 294/18723 | 3.80e-08 | 8.30e-07 | 171 |
| GO:00550882 | Liver | HCC | lipid homeostasis | 103/7958 | 167/18723 | 4.27e-07 | 7.18e-06 | 103 |
| GO:00421571 | Liver | HCC | lipoprotein metabolic process | 86/7958 | 135/18723 | 5.21e-07 | 8.38e-06 | 86 |
| GO:00192162 | Liver | HCC | regulation of lipid metabolic process | 181/7958 | 331/18723 | 4.58e-06 | 5.79e-05 | 181 |
| GO:001648511 | Liver | HCC | protein processing | 121/7958 | 225/18723 | 4.01e-04 | 2.71e-03 | 121 |
| GO:00454441 | Liver | HCC | fat cell differentiation | 120/7958 | 229/18723 | 1.52e-03 | 8.05e-03 | 120 |
| GO:00550902 | Liver | HCC | acylglycerol homeostasis | 27/7958 | 42/18723 | 3.60e-03 | 1.60e-02 | 27 |
| GO:00703282 | Liver | HCC | triglyceride homeostasis | 27/7958 | 42/18723 | 3.60e-03 | 1.60e-02 | 27 |
| GO:19033171 | Liver | HCC | regulation of protein maturation | 39/7958 | 67/18723 | 6.84e-03 | 2.74e-02 | 39 |
| GO:00706131 | Liver | HCC | regulation of protein processing | 37/7958 | 65/18723 | 1.33e-02 | 4.77e-02 | 37 |
| Page: 1 |
| Pathway ID | Tissue | Disease Stage | Description | Gene Ratio | Bg Ratio | pvalue | p.adjust | qvalue | Count |
| hsa049796 | Liver | NAFLD | Cholesterol metabolism | 20/1043 | 51/8465 | 9.73e-07 | 4.56e-05 | 3.67e-05 | 20 |
| hsa0497911 | Liver | NAFLD | Cholesterol metabolism | 20/1043 | 51/8465 | 9.73e-07 | 4.56e-05 | 3.67e-05 | 20 |
| hsa049794 | Liver | HCC | Cholesterol metabolism | 41/4020 | 51/8465 | 1.33e-06 | 1.35e-05 | 7.49e-06 | 41 |
| hsa049795 | Liver | HCC | Cholesterol metabolism | 41/4020 | 51/8465 | 1.33e-06 | 1.35e-05 | 7.49e-06 | 41 |
| Page: 1 |
Top |
Cell-cell communication analysis |
| Identification of potential cell-cell interactions between two cell types and their ligand-receptor pairs for different disease states |
| Ligand | Receptor | LRpair | Pathway | Tissue | Disease Stage |
| Page: 1 |
Top |
Single-cell gene regulatory network inference analysis |
| Find out the significant the regulons (TFs) and the target genes of each regulon across cell types for different disease states |
| TF | Cell Type | Tissue | Disease Stage | Target Gene | RSS | Regulon Activity |
| ∗The dot plots of a searched regulon are shown for all cell subpopulations in each disease state of each tissue based on the regulon specific score inferred using pySCENIC and by calculating the average expression. |
| Page: 1 |
Top |
Somatic mutation of malignant transformation related genes |
| Annotation of somatic variants for genes involved in malignant transformation |
| Hugo Symbol | Variant Class | Variant Classification | dbSNP RS | HGVSc | HGVSp | HGVSp Short | SWISSPROT | BIOTYPE | SIFT | PolyPhen | Tumor Sample Barcode | Tissue | Histology | Sex | Age | Stage | Therapy Types | Drugs | Outcome |
| ANGPTL8 | SNV | Missense_Mutation | novel | c.37N>T | p.Ala13Ser | p.A13S | Q6UXH0 | protein_coding | tolerated(0.13) | benign(0.125) | TCGA-VS-A9UV-01 | Cervix | cervical & endocervical cancer | Female | >=65 | I/II | Unknown | Unknown | PD |
| ANGPTL8 | SNV | Missense_Mutation | rs536232063 | c.253N>T | p.Arg85Trp | p.R85W | Q6UXH0 | protein_coding | tolerated(0.06) | benign(0.003) | TCGA-D5-6932-01 | Colorectum | colon adenocarcinoma | Male | >=65 | I/II | Unknown | Unknown | SD |
| ANGPTL8 | SNV | Missense_Mutation | c.68N>T | p.Pro23Leu | p.P23L | Q6UXH0 | protein_coding | deleterious(0) | possibly_damaging(0.801) | TCGA-G4-6320-01 | Colorectum | colon adenocarcinoma | Male | >=65 | III/IV | Chemotherapy | oxaliplatin | SD | |
| ANGPTL8 | SNV | Missense_Mutation | novel | c.200T>C | p.Leu67Pro | p.L67P | Q6UXH0 | protein_coding | deleterious(0) | probably_damaging(0.943) | TCGA-AP-A1DK-01 | Endometrium | uterine corpus endometrioid carcinoma | Female | <65 | I/II | Unknown | Unknown | SD |
| ANGPTL8 | SNV | Missense_Mutation | novel | c.233G>A | p.Gly78Glu | p.G78E | Q6UXH0 | protein_coding | tolerated(0.13) | benign(0.027) | TCGA-AX-A06F-01 | Endometrium | uterine corpus endometrioid carcinoma | Female | <65 | III/IV | Chemotherapy | carboplatin | SD |
| ANGPTL8 | SNV | Missense_Mutation | rs79566395 | c.388N>A | p.Val130Met | p.V130M | Q6UXH0 | protein_coding | tolerated(0.22) | benign(0.133) | TCGA-B5-A11Y-01 | Endometrium | uterine corpus endometrioid carcinoma | Female | <65 | I/II | Unknown | Unknown | SD |
| ANGPTL8 | SNV | Missense_Mutation | c.30G>T | p.Trp10Cys | p.W10C | Q6UXH0 | protein_coding | tolerated(0.21) | benign(0) | TCGA-D1-A17A-01 | Endometrium | uterine corpus endometrioid carcinoma | Female | <65 | I/II | Unknown | Unknown | SD | |
| ANGPTL8 | SNV | Missense_Mutation | c.386N>T | p.Ser129Ile | p.S129I | Q6UXH0 | protein_coding | tolerated(0.07) | benign(0.112) | TCGA-BC-A10R-01 | Liver | liver hepatocellular carcinoma | Female | >=65 | III/IV | Other, specify in noteschemoembolization | unknown | PD | |
| ANGPTL8 | SNV | Missense_Mutation | novel | c.545A>G | p.His182Arg | p.H182R | Q6UXH0 | protein_coding | tolerated(0.16) | benign(0.001) | TCGA-CC-A8HT-01 | Liver | liver hepatocellular carcinoma | Male | >=65 | III/IV | Unknown | Unknown | PD |
| ANGPTL8 | SNV | Missense_Mutation | c.496C>T | p.Leu166Phe | p.L166F | Q6UXH0 | protein_coding | deleterious(0) | probably_damaging(0.998) | TCGA-ES-A2HT-01 | Liver | liver hepatocellular carcinoma | Male | <65 | I/II | Unknown | Unknown | SD |
| Page: 1 2 |
Top |
Related drugs of malignant transformation related genes |
| Identification of chemicals and drugs interact with genes involved in malignant transfromation |
| (DGIdb 4.0) |
| Entrez ID | Symbol | Category | Interaction Types | Drug Claim Name | Drug Name | PMIDs |
| Page: 1 |

Copyright 2023-Present -The University of Texas Health Science Center at Houston |