
|
|||||
|
 | |
| |
| |
| |
| |
| |
|
Gene: ANGPTL4 |
Gene summary for ANGPTL4 |
| Gene information | Species | Human | Gene symbol | ANGPTL4 | Gene ID | 51129 |
| Gene name | angiopoietin like 4 | |
| Gene Alias | ARP4 | |
| Cytomap | 19p13.2 | |
| Gene Type | protein-coding | GO ID | GO:0001525 | UniProtAcc | Q9BY76 |
Top |
Malignant transformation analysis |
| Identification of the aberrant gene expression in precancerous and cancerous lesions by comparing the gene expression of stem-like cells in diseased tissues with normal stem cells |
| Entrez ID | Symbol | Replicates | Species | Organ | Tissue | Adj P-value | Log2FC | Malignancy |
| 51129 | ANGPTL4 | GSM4909282 | Human | Breast | IDC | 1.71e-12 | -3.55e-01 | -0.0288 |
| 51129 | ANGPTL4 | GSM4909285 | Human | Breast | IDC | 3.10e-02 | -2.76e-01 | 0.21 |
| 51129 | ANGPTL4 | GSM4909286 | Human | Breast | IDC | 3.04e-04 | -2.85e-01 | 0.1081 |
| 51129 | ANGPTL4 | GSM4909287 | Human | Breast | IDC | 1.68e-04 | -2.61e-01 | 0.2057 |
| 51129 | ANGPTL4 | GSM4909290 | Human | Breast | IDC | 2.99e-11 | -3.65e-01 | 0.2096 |
| 51129 | ANGPTL4 | GSM4909293 | Human | Breast | IDC | 7.02e-15 | -3.56e-01 | 0.1581 |
| 51129 | ANGPTL4 | GSM4909294 | Human | Breast | IDC | 1.01e-13 | -3.51e-01 | 0.2022 |
| 51129 | ANGPTL4 | GSM4909296 | Human | Breast | IDC | 1.16e-13 | -3.30e-01 | 0.1524 |
| 51129 | ANGPTL4 | GSM4909297 | Human | Breast | IDC | 3.41e-10 | -3.14e-01 | 0.1517 |
| 51129 | ANGPTL4 | GSM4909298 | Human | Breast | IDC | 6.43e-07 | -3.11e-01 | 0.1551 |
| 51129 | ANGPTL4 | GSM4909299 | Human | Breast | IDC | 4.89e-05 | -3.01e-01 | 0.035 |
| 51129 | ANGPTL4 | GSM4909301 | Human | Breast | IDC | 2.01e-12 | -3.45e-01 | 0.1577 |
| 51129 | ANGPTL4 | GSM4909304 | Human | Breast | IDC | 2.12e-16 | -3.60e-01 | 0.1636 |
| 51129 | ANGPTL4 | GSM4909306 | Human | Breast | IDC | 6.80e-08 | -3.25e-01 | 0.1564 |
| 51129 | ANGPTL4 | GSM4909307 | Human | Breast | IDC | 3.98e-14 | -3.57e-01 | 0.1569 |
| 51129 | ANGPTL4 | GSM4909308 | Human | Breast | IDC | 3.04e-07 | -3.33e-01 | 0.158 |
| 51129 | ANGPTL4 | GSM4909309 | Human | Breast | IDC | 4.29e-10 | -3.47e-01 | 0.0483 |
| 51129 | ANGPTL4 | GSM4909311 | Human | Breast | IDC | 1.87e-15 | -3.40e-01 | 0.1534 |
| 51129 | ANGPTL4 | GSM4909312 | Human | Breast | IDC | 8.59e-15 | -3.42e-01 | 0.1552 |
| 51129 | ANGPTL4 | GSM4909313 | Human | Breast | IDC | 2.03e-05 | -3.06e-01 | 0.0391 |
| Page: 1 2 3 4 5 6 7 |
| Tissue | Expression Dynamics | Abbreviation |
| Breast | 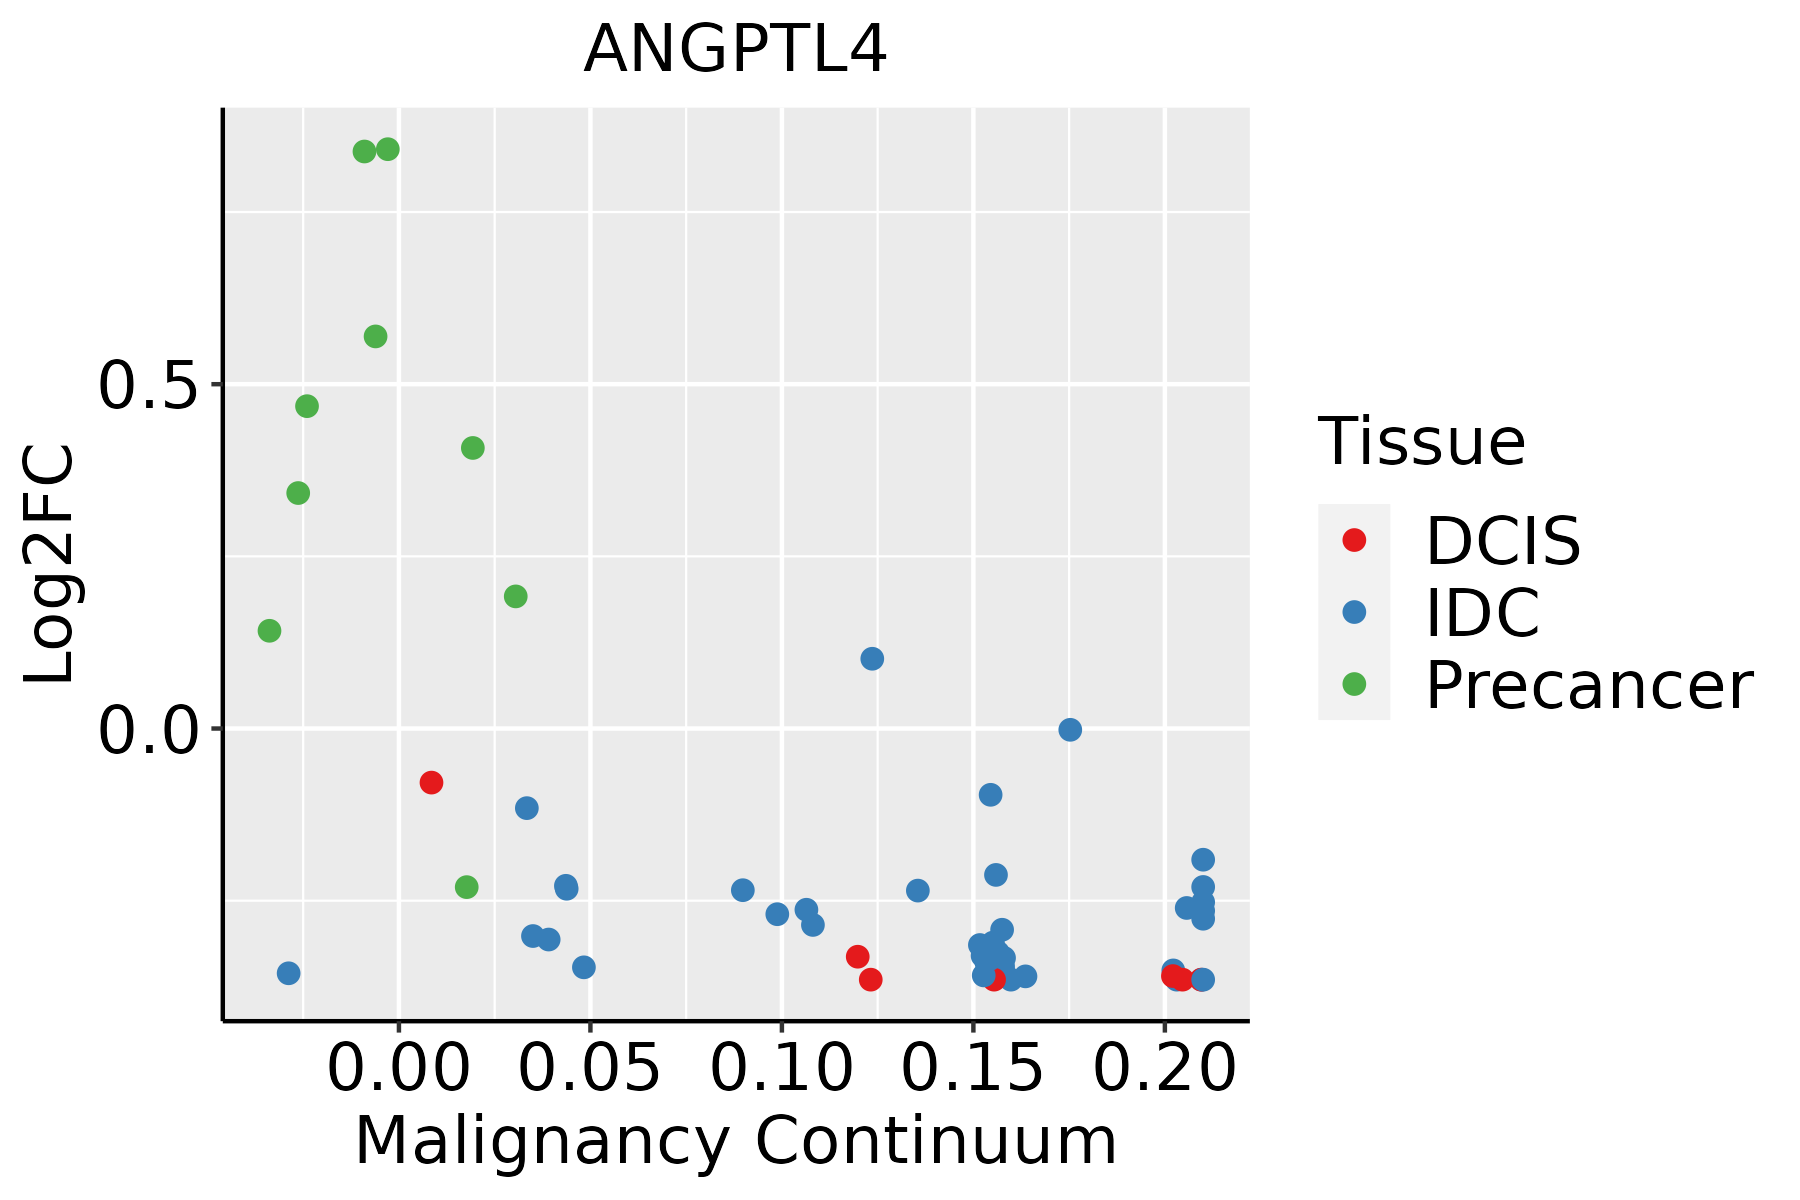 | IDC: Invasive ductal carcinoma |
| DCIS: Ductal carcinoma in situ | ||
| Precancer(BRCA1-mut): Precancerous lesion from BRCA1 mutation carriers | ||
| Cervix | 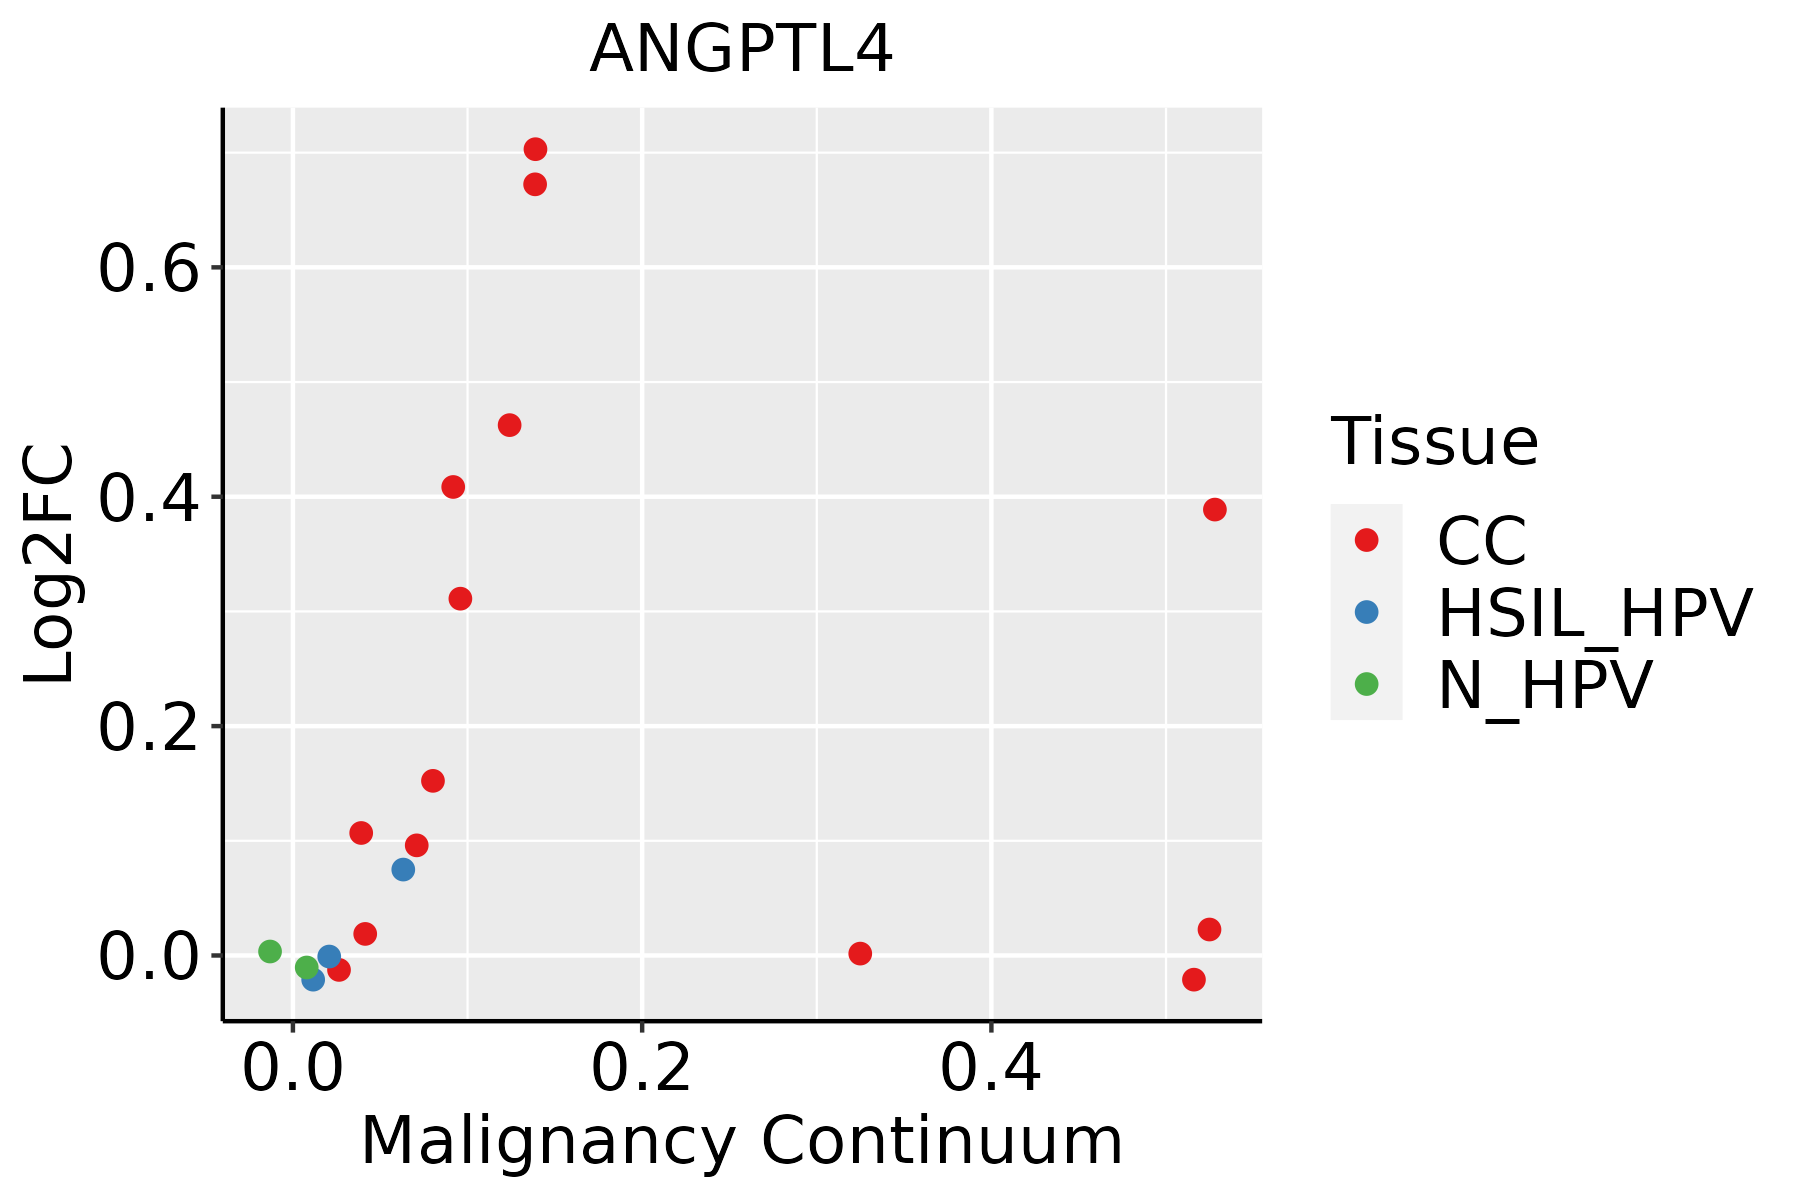 | CC: Cervix cancer |
| HSIL_HPV: HPV-infected high-grade squamous intraepithelial lesions | ||
| N_HPV: HPV-infected normal cervix | ||
| Endometrium | 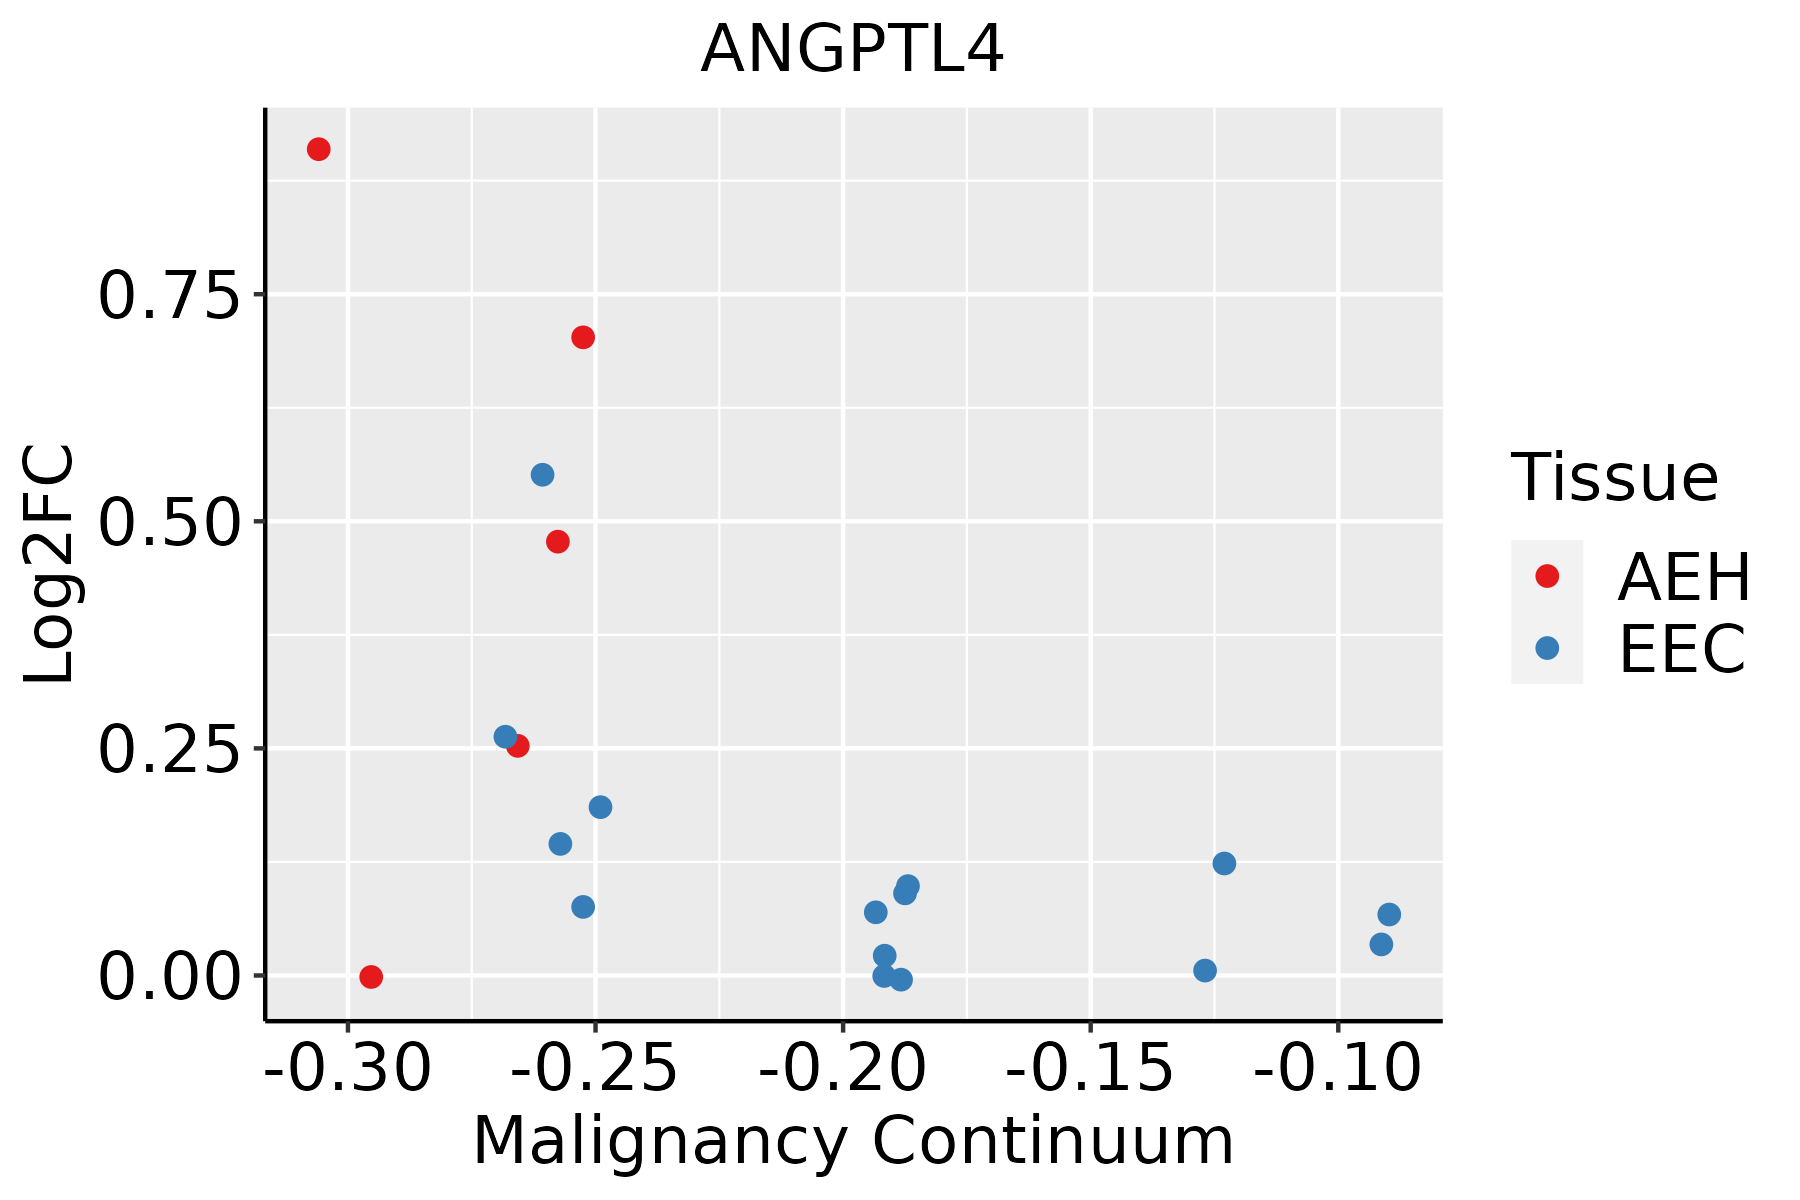 | AEH: Atypical endometrial hyperplasia |
| EEC: Endometrioid Cancer | ||
| Esophagus | 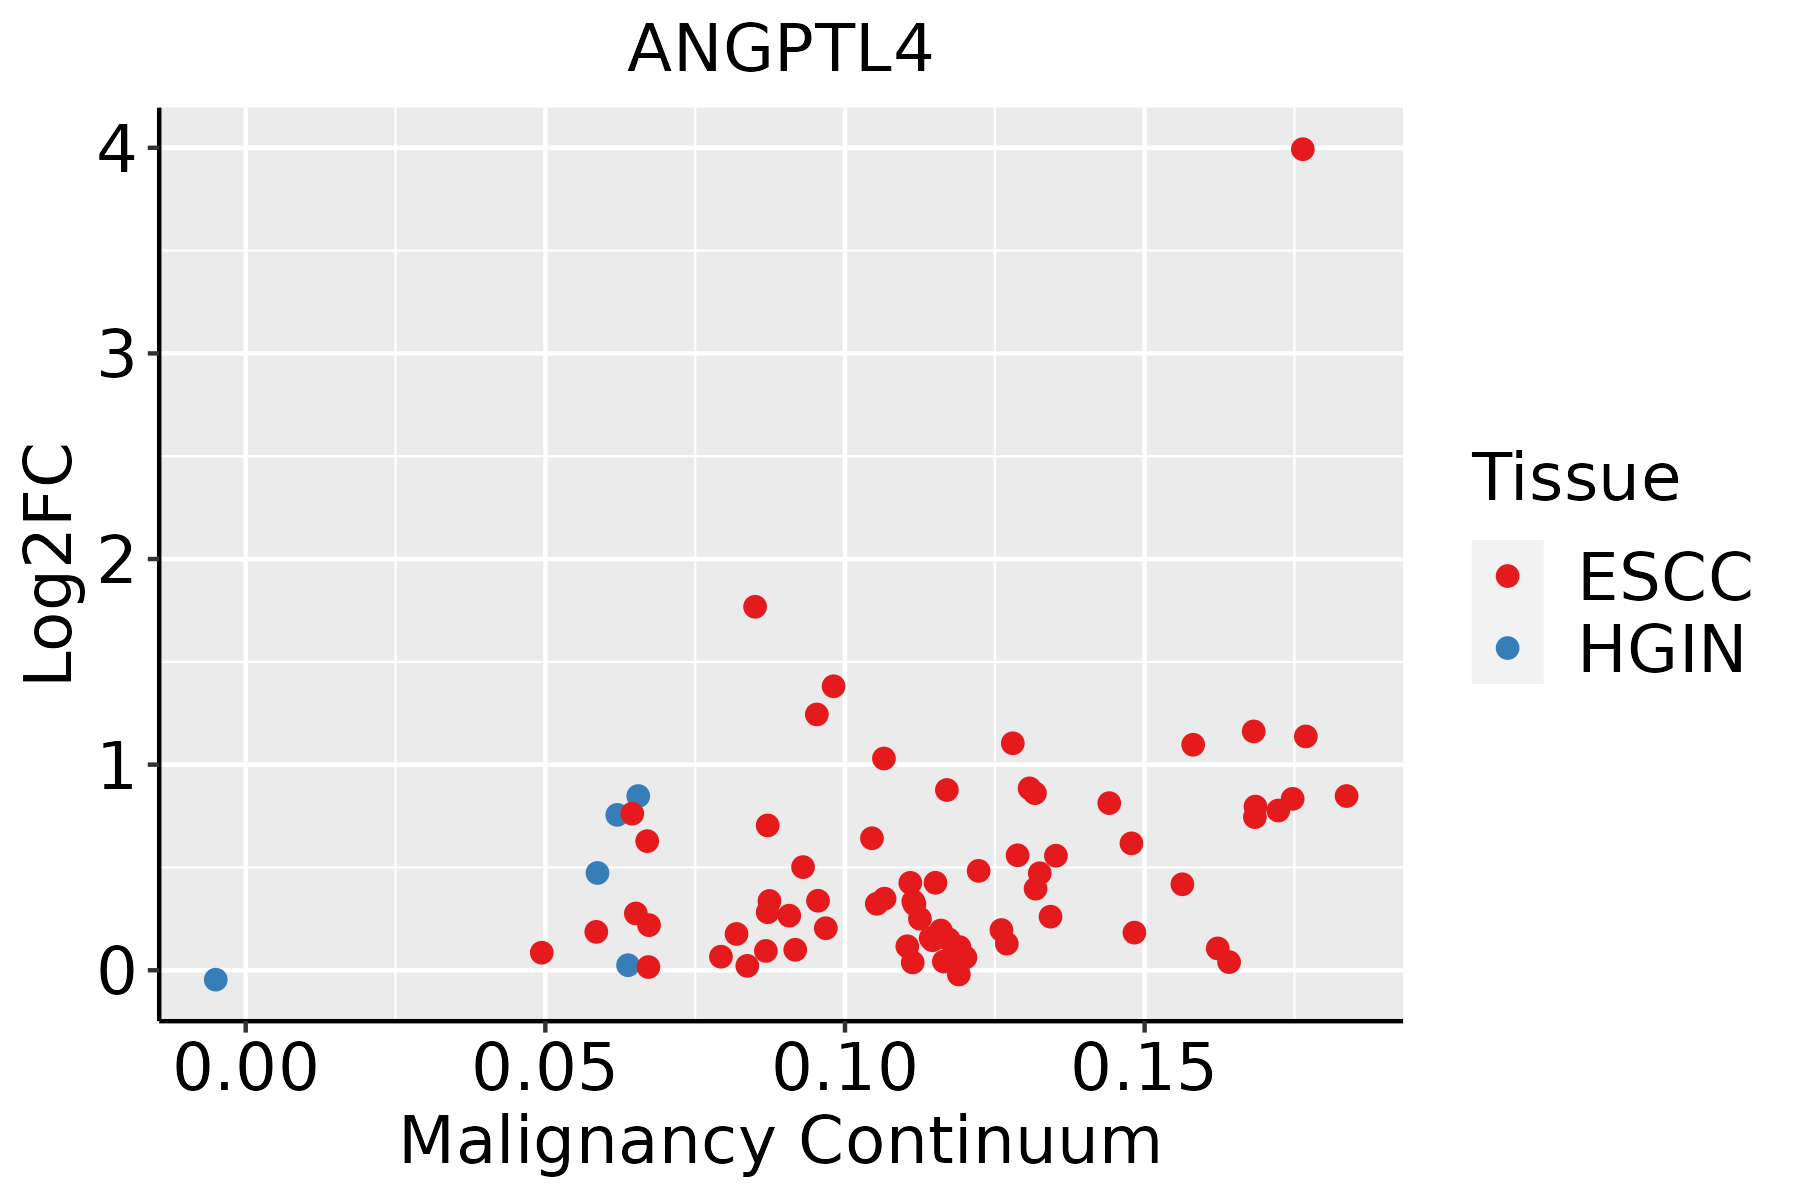 | ESCC: Esophageal squamous cell carcinoma |
| HGIN: High-grade intraepithelial neoplasias | ||
| LGIN: Low-grade intraepithelial neoplasias | ||
| GC | 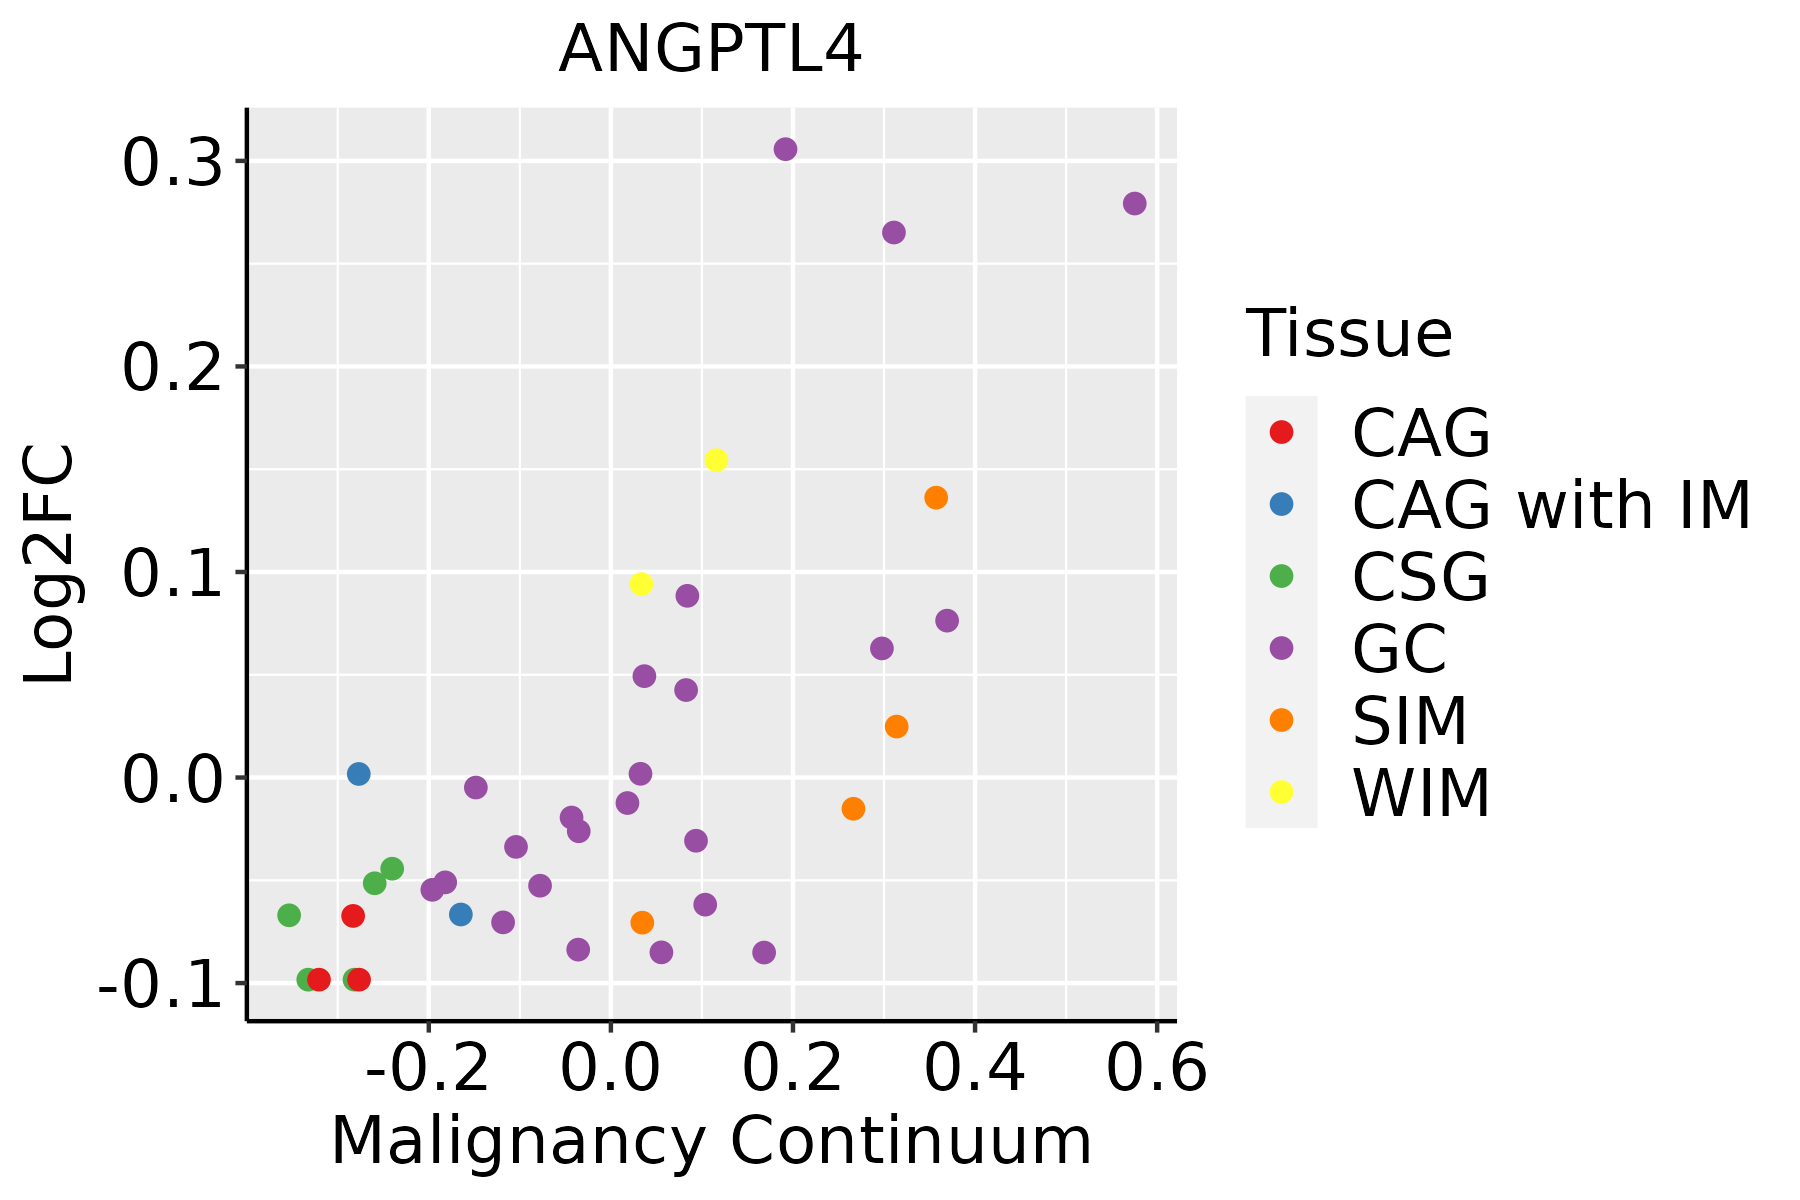 | CAG: Chronic atrophic gastritis |
| CAG with IM: Chronic atrophic gastritis with intestinal metaplasia | ||
| CSG: Chronic superficial gastritis | ||
| GC: Gastric cancer | ||
| SIM: Severe intestinal metaplasia | ||
| WIM: Wild intestinal metaplasia | ||
| Liver |  | HCC: Hepatocellular carcinoma |
| NAFLD: Non-alcoholic fatty liver disease | ||
| Oral Cavity | 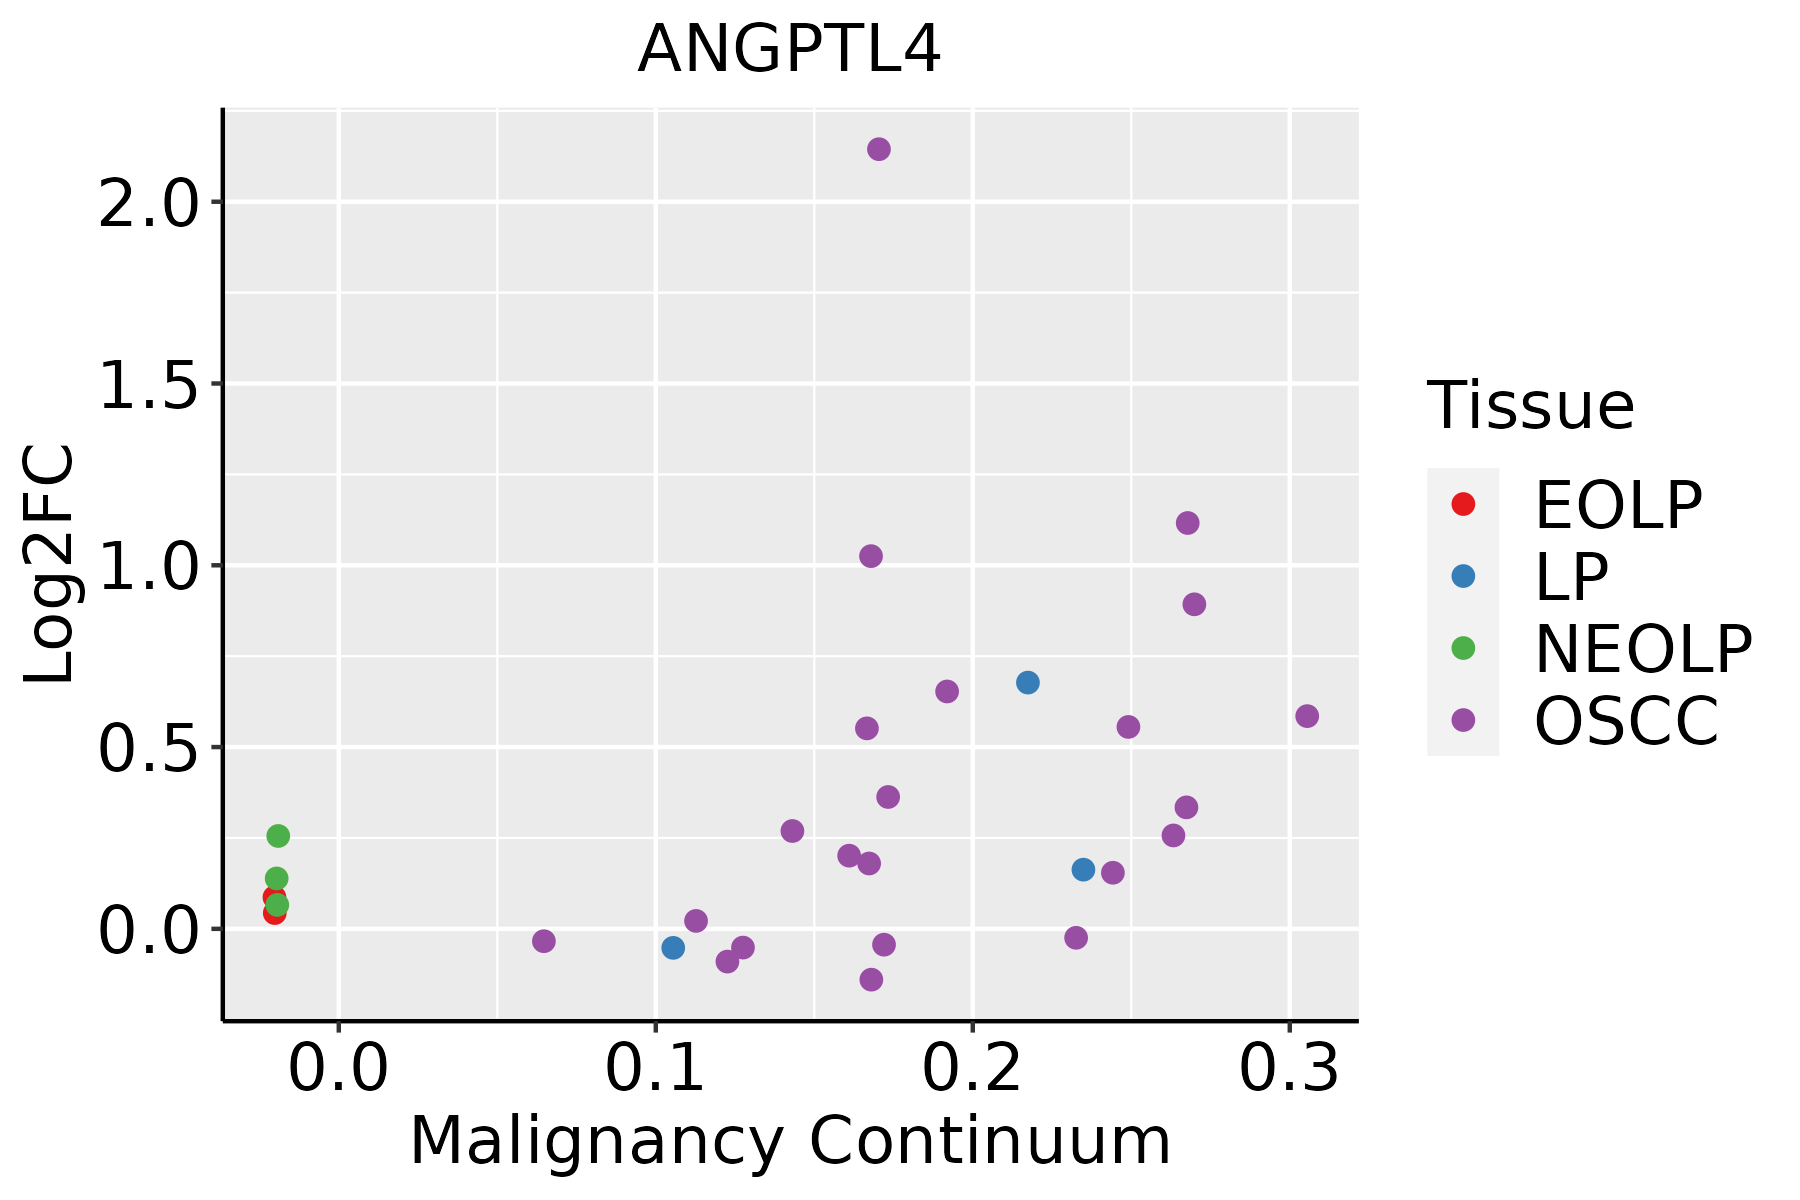 | EOLP: Erosive Oral lichen planus |
| LP: leukoplakia | ||
| NEOLP: Non-erosive oral lichen planus | ||
| OSCC: Oral squamous cell carcinoma | ||
| Skin |  | AK: Actinic keratosis |
| cSCC: Cutaneous squamous cell carcinoma | ||
| SCCIS:squamous cell carcinoma in situ | ||
| Thyroid | 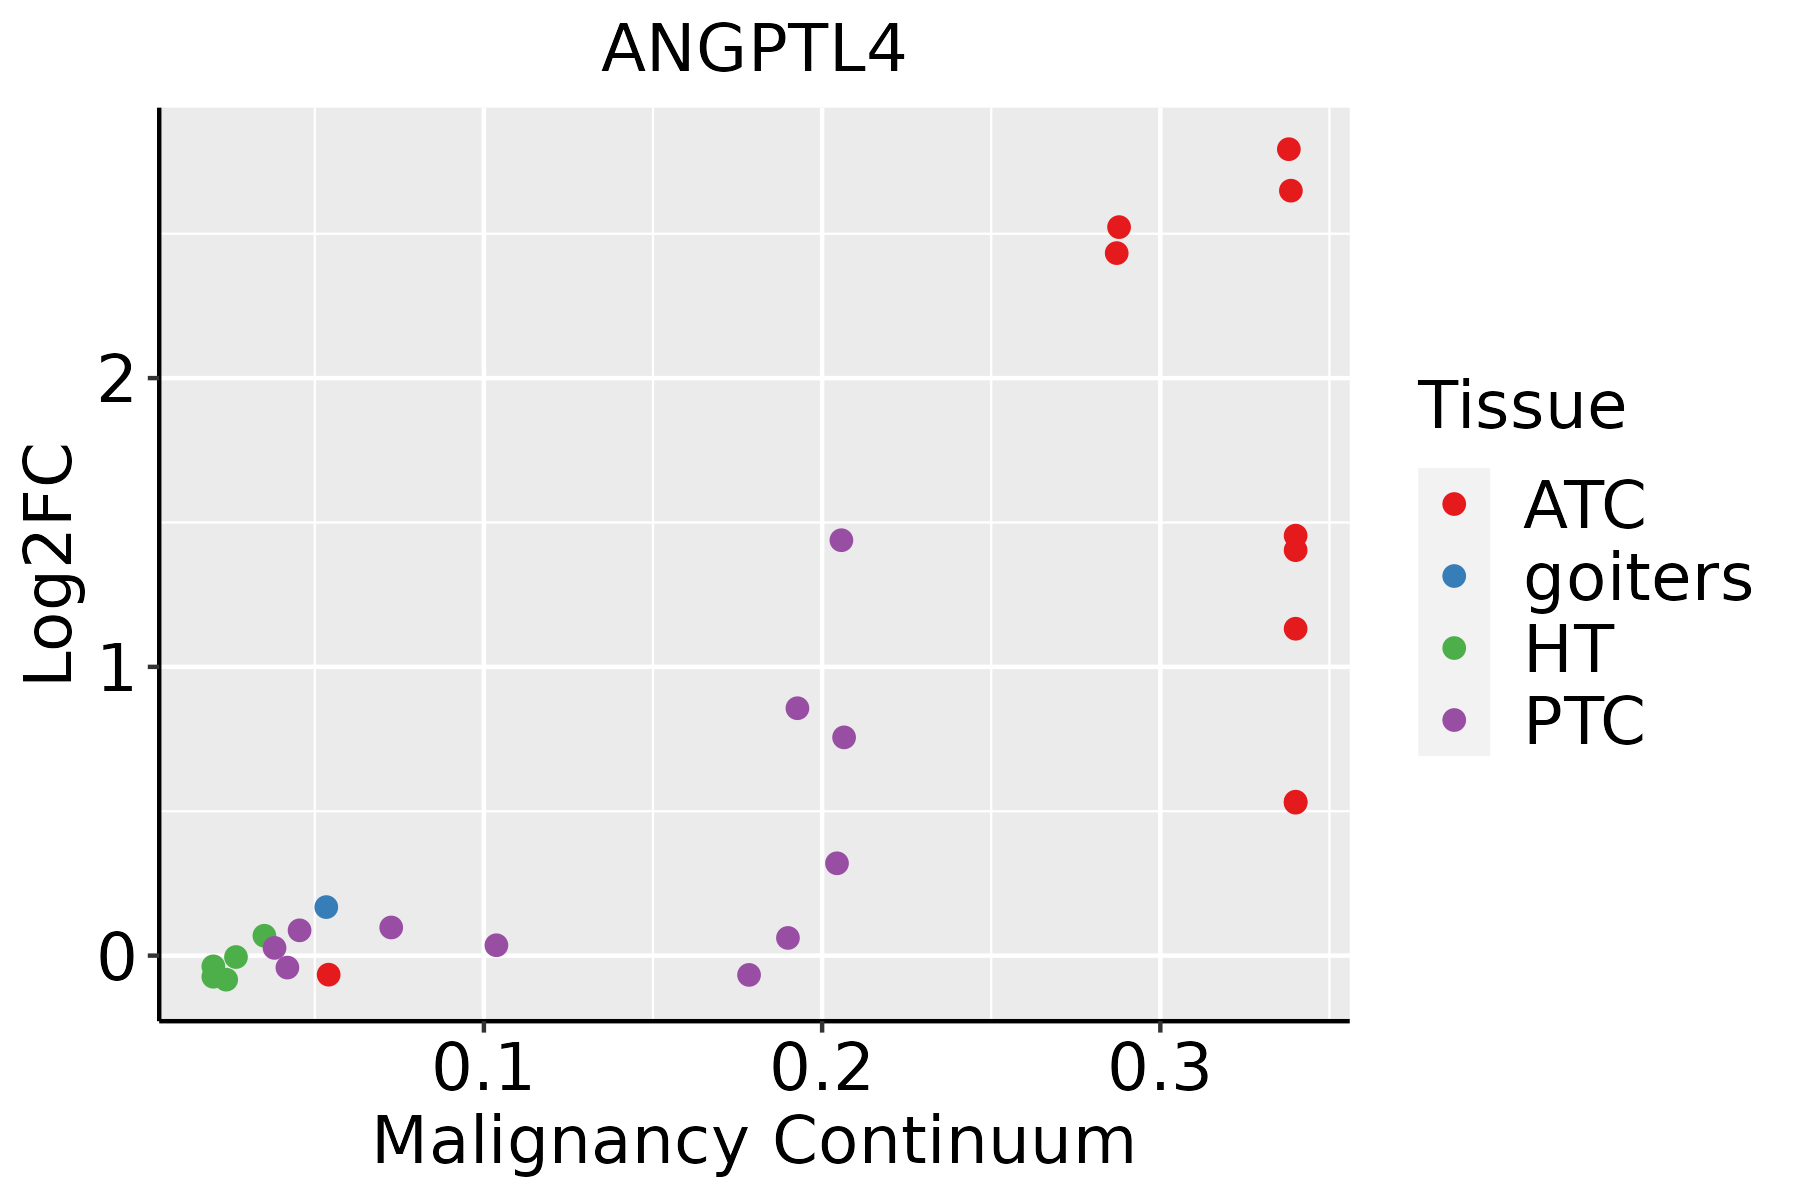 | ATC: Anaplastic thyroid cancer |
| HT: Hashimoto's thyroiditis | ||
| PTC: Papillary thyroid cancer |
| ∗log2FC in expression of this searched gene in stem-like cells from each diseased tissue sample relative to stem-like cells in normal samples in each tissue plotted against the malignancy continuum. Samples are colored based on if they are from different disease stage. |
Top |
Malignant transformation related pathway analysis |
| Find out the enriched GO biological processes and KEGG pathways involved in transition from healthy to precancer to cancer |
| Tissue | Disease Stage | Enriched GO biological Processes |
| Colorectum | AD |  |
| Colorectum | SER |  |
| Colorectum | MSS |  |
| Colorectum | MSI-H |  |
| Colorectum | FAP |  |
| ∗Top 15 enriched GO BP terms are showed in the bar plot of each disease state in each tissue. Each row represents a significant GO biological process which is colored according to the -log10(p.adjust). |
| Page: 1 2 3 4 5 6 7 8 9 |
| GO ID | Tissue | Disease Stage | Description | Gene Ratio | Bg Ratio | pvalue | p.adjust | Count |
| GO:00362939 | Breast | Precancer | response to decreased oxygen levels | 53/1080 | 322/18723 | 4.09e-12 | 6.84e-10 | 53 |
| GO:00016669 | Breast | Precancer | response to hypoxia | 51/1080 | 307/18723 | 7.33e-12 | 1.11e-09 | 51 |
| GO:00704829 | Breast | Precancer | response to oxygen levels | 55/1080 | 347/18723 | 7.47e-12 | 1.11e-09 | 55 |
| GO:00513468 | Breast | Precancer | negative regulation of hydrolase activity | 50/1080 | 379/18723 | 3.85e-08 | 2.34e-06 | 50 |
| GO:0045766 | Breast | Precancer | positive regulation of angiogenesis | 23/1080 | 181/18723 | 3.09e-04 | 4.43e-03 | 23 |
| GO:1904018 | Breast | Precancer | positive regulation of vasculature development | 23/1080 | 181/18723 | 3.09e-04 | 4.43e-03 | 23 |
| GO:19040193 | Breast | Precancer | epithelial cell apoptotic process | 17/1080 | 121/18723 | 5.76e-04 | 7.28e-03 | 17 |
| GO:0045765 | Breast | Precancer | regulation of angiogenesis | 35/1080 | 342/18723 | 7.35e-04 | 8.80e-03 | 35 |
| GO:1901342 | Breast | Precancer | regulation of vasculature development | 35/1080 | 348/18723 | 1.00e-03 | 1.12e-02 | 35 |
| GO:19040351 | Breast | Precancer | regulation of epithelial cell apoptotic process | 14/1080 | 96/18723 | 1.18e-03 | 1.28e-02 | 14 |
| GO:005134613 | Breast | IDC | negative regulation of hydrolase activity | 71/1434 | 379/18723 | 1.33e-12 | 2.90e-10 | 71 |
| GO:007048214 | Breast | IDC | response to oxygen levels | 64/1434 | 347/18723 | 3.45e-11 | 5.57e-09 | 64 |
| GO:003629314 | Breast | IDC | response to decreased oxygen levels | 60/1434 | 322/18723 | 9.26e-11 | 1.25e-08 | 60 |
| GO:000166614 | Breast | IDC | response to hypoxia | 58/1434 | 307/18723 | 1.09e-10 | 1.38e-08 | 58 |
| GO:00457651 | Breast | IDC | regulation of angiogenesis | 45/1434 | 342/18723 | 2.57e-04 | 3.98e-03 | 45 |
| GO:19013421 | Breast | IDC | regulation of vasculature development | 45/1434 | 348/18723 | 3.78e-04 | 5.38e-03 | 45 |
| GO:00457661 | Breast | IDC | positive regulation of angiogenesis | 26/1434 | 181/18723 | 1.39e-03 | 1.43e-02 | 26 |
| GO:19040181 | Breast | IDC | positive regulation of vasculature development | 26/1434 | 181/18723 | 1.39e-03 | 1.43e-02 | 26 |
| GO:003629323 | Breast | DCIS | response to decreased oxygen levels | 60/1390 | 322/18723 | 2.64e-11 | 4.56e-09 | 60 |
| GO:007048223 | Breast | DCIS | response to oxygen levels | 63/1390 | 347/18723 | 2.66e-11 | 4.56e-09 | 63 |
| Page: 1 2 3 4 5 6 |
| Pathway ID | Tissue | Disease Stage | Description | Gene Ratio | Bg Ratio | pvalue | p.adjust | qvalue | Count |
| hsa049796 | Liver | NAFLD | Cholesterol metabolism | 20/1043 | 51/8465 | 9.73e-07 | 4.56e-05 | 3.67e-05 | 20 |
| hsa033206 | Liver | NAFLD | PPAR signaling pathway | 25/1043 | 75/8465 | 1.61e-06 | 6.62e-05 | 5.33e-05 | 25 |
| hsa0497911 | Liver | NAFLD | Cholesterol metabolism | 20/1043 | 51/8465 | 9.73e-07 | 4.56e-05 | 3.67e-05 | 20 |
| hsa0332011 | Liver | NAFLD | PPAR signaling pathway | 25/1043 | 75/8465 | 1.61e-06 | 6.62e-05 | 5.33e-05 | 25 |
| hsa049794 | Liver | HCC | Cholesterol metabolism | 41/4020 | 51/8465 | 1.33e-06 | 1.35e-05 | 7.49e-06 | 41 |
| hsa033204 | Liver | HCC | PPAR signaling pathway | 48/4020 | 75/8465 | 2.83e-03 | 9.37e-03 | 5.21e-03 | 48 |
| hsa049795 | Liver | HCC | Cholesterol metabolism | 41/4020 | 51/8465 | 1.33e-06 | 1.35e-05 | 7.49e-06 | 41 |
| hsa033205 | Liver | HCC | PPAR signaling pathway | 48/4020 | 75/8465 | 2.83e-03 | 9.37e-03 | 5.21e-03 | 48 |
| hsa03320 | Stomach | GC | PPAR signaling pathway | 18/708 | 75/8465 | 3.26e-05 | 4.01e-04 | 2.82e-04 | 18 |
| hsa033201 | Stomach | GC | PPAR signaling pathway | 18/708 | 75/8465 | 3.26e-05 | 4.01e-04 | 2.82e-04 | 18 |
| Page: 1 |
Top |
Cell-cell communication analysis |
| Identification of potential cell-cell interactions between two cell types and their ligand-receptor pairs for different disease states |
| Ligand | Receptor | LRpair | Pathway | Tissue | Disease Stage |
| ANGPTL4 | ITGA5_ITGB1 | ANGPTL4_ITGA5_ITGB1 | ANGPTL | Breast | ADJ |
| ANGPTL4 | CDH5 | ANGPTL4_CDH5 | ANGPTL | Breast | ADJ |
| ANGPTL4 | SDC2 | ANGPTL4_SDC2 | ANGPTL | Breast | ADJ |
| ANGPTL4 | SDC4 | ANGPTL4_SDC4 | ANGPTL | Breast | ADJ |
| ANGPTL4 | ITGA5_ITGB1 | ANGPTL4_ITGA5_ITGB1 | ANGPTL | Breast | DCIS |
| ANGPTL4 | CDH5 | ANGPTL4_CDH5 | ANGPTL | Breast | DCIS |
| ANGPTL4 | CDH11 | ANGPTL4_CDH11 | ANGPTL | Breast | DCIS |
| ANGPTL4 | SDC1 | ANGPTL4_SDC1 | ANGPTL | Breast | DCIS |
| ANGPTL4 | SDC2 | ANGPTL4_SDC2 | ANGPTL | Breast | DCIS |
| ANGPTL4 | SDC3 | ANGPTL4_SDC3 | ANGPTL | Breast | DCIS |
| ANGPTL4 | SDC4 | ANGPTL4_SDC4 | ANGPTL | Breast | DCIS |
| ANGPTL4 | ITGA5_ITGB1 | ANGPTL4_ITGA5_ITGB1 | ANGPTL | Breast | Healthy |
| ANGPTL4 | CDH5 | ANGPTL4_CDH5 | ANGPTL | Breast | Healthy |
| ANGPTL4 | CDH11 | ANGPTL4_CDH11 | ANGPTL | Breast | Healthy |
| ANGPTL4 | SDC1 | ANGPTL4_SDC1 | ANGPTL | Breast | Healthy |
| ANGPTL4 | SDC2 | ANGPTL4_SDC2 | ANGPTL | Breast | Healthy |
| ANGPTL4 | SDC4 | ANGPTL4_SDC4 | ANGPTL | Breast | Healthy |
| ANGPTL4 | ITGA5_ITGB1 | ANGPTL4_ITGA5_ITGB1 | ANGPTL | Breast | IDC |
| ANGPTL4 | CDH5 | ANGPTL4_CDH5 | ANGPTL | Breast | IDC |
| ANGPTL4 | CDH11 | ANGPTL4_CDH11 | ANGPTL | Breast | IDC |
| Page: 1 2 3 4 5 6 |
Top |
Single-cell gene regulatory network inference analysis |
| Find out the significant the regulons (TFs) and the target genes of each regulon across cell types for different disease states |
| TF | Cell Type | Tissue | Disease Stage | Target Gene | RSS | Regulon Activity |
| ∗The dot plots of a searched regulon are shown for all cell subpopulations in each disease state of each tissue based on the regulon specific score inferred using pySCENIC and by calculating the average expression. |
| Page: 1 |
Top |
Somatic mutation of malignant transformation related genes |
| Annotation of somatic variants for genes involved in malignant transformation |
| Hugo Symbol | Variant Class | Variant Classification | dbSNP RS | HGVSc | HGVSp | HGVSp Short | SWISSPROT | BIOTYPE | SIFT | PolyPhen | Tumor Sample Barcode | Tissue | Histology | Sex | Age | Stage | Therapy Types | Drugs | Outcome |
| ANGPTL4 | SNV | Missense_Mutation | novel | c.762N>C | p.Glu254Asp | p.E254D | Q9BY76 | protein_coding | tolerated(0.16) | possibly_damaging(0.889) | TCGA-AC-A3W5-01 | Breast | breast invasive carcinoma | Female | >=65 | I/II | Chemotherapy | docetaxel | CR |
| ANGPTL4 | SNV | Missense_Mutation | novel | c.890N>G | p.Asp297Gly | p.D297G | Q9BY76 | protein_coding | tolerated(0.06) | probably_damaging(0.912) | TCGA-D8-A1XK-01 | Breast | breast invasive carcinoma | Female | <65 | I/II | Chemotherapy | doxorubicine+cyclophosphamide | SD |
| ANGPTL4 | SNV | Missense_Mutation | c.629N>T | p.Pro210Leu | p.P210L | Q9BY76 | protein_coding | tolerated(0.17) | benign(0.01) | TCGA-CA-6716-01 | Colorectum | colon adenocarcinoma | Male | >=65 | I/II | Chemotherapy | oxaliplatin | CR | |
| ANGPTL4 | SNV | Missense_Mutation | rs771783684 | c.1087T>C | p.Tyr363His | p.Y363H | Q9BY76 | protein_coding | deleterious(0) | probably_damaging(0.999) | TCGA-CA-6717-01 | Colorectum | colon adenocarcinoma | Male | <65 | I/II | Chemotherapy | oxaliplatin | CR |
| ANGPTL4 | SNV | Missense_Mutation | novel | c.341G>T | p.Ser114Ile | p.S114I | Q9BY76 | protein_coding | tolerated(0.09) | benign(0.344) | TCGA-A5-A0G2-01 | Endometrium | uterine corpus endometrioid carcinoma | Female | <65 | III/IV | Unknown | Unknown | SD |
| ANGPTL4 | SNV | Missense_Mutation | rs774924877 | c.815G>A | p.Arg272His | p.R272H | Q9BY76 | protein_coding | tolerated(0.57) | benign(0.025) | TCGA-A5-A0VP-01 | Endometrium | uterine corpus endometrioid carcinoma | Female | >=65 | I/II | Unknown | Unknown | SD |
| ANGPTL4 | SNV | Missense_Mutation | novel | c.940N>A | p.Ala314Thr | p.A314T | Q9BY76 | protein_coding | tolerated(0.15) | benign(0.034) | TCGA-AJ-A3NE-01 | Endometrium | uterine corpus endometrioid carcinoma | Female | <65 | I/II | Unknown | Unknown | SD |
| ANGPTL4 | SNV | Missense_Mutation | novel | c.400C>T | p.His134Tyr | p.H134Y | Q9BY76 | protein_coding | deleterious(0.01) | benign(0.242) | TCGA-B5-A3FA-01 | Endometrium | uterine corpus endometrioid carcinoma | Female | >=65 | I/II | Unknown | Unknown | SD |
| ANGPTL4 | SNV | Missense_Mutation | rs557133449 | c.407G>A | p.Arg136Gln | p.R136Q | Q9BY76 | protein_coding | tolerated(0.42) | benign(0.029) | TCGA-BK-A6W3-01 | Endometrium | uterine corpus endometrioid carcinoma | Female | <65 | I/II | Unknown | Unknown | SD |
| ANGPTL4 | SNV | Missense_Mutation | rs557133449 | c.407N>A | p.Arg136Gln | p.R136Q | Q9BY76 | protein_coding | tolerated(0.42) | benign(0.029) | TCGA-BS-A0V4-01 | Endometrium | uterine corpus endometrioid carcinoma | Female | <65 | I/II | Unknown | Unknown | SD |
| Page: 1 2 3 |
Top |
Related drugs of malignant transformation related genes |
| Identification of chemicals and drugs interact with genes involved in malignant transfromation |
| (DGIdb 4.0) |
| Entrez ID | Symbol | Category | Interaction Types | Drug Claim Name | Drug Name | PMIDs |
| Page: 1 |

Copyright 2023-Present -The University of Texas Health Science Center at Houston |