
|
|||||
|
 | |
| |
| |
| |
| |
| |
|
Gene: ANGPTL3 |
Gene summary for ANGPTL3 |
| Gene information | Species | Human | Gene symbol | ANGPTL3 | Gene ID | 27329 |
| Gene name | angiopoietin like 3 | |
| Gene Alias | ANG-5 | |
| Cytomap | 1p31.3 | |
| Gene Type | protein-coding | GO ID | GO:0001525 | UniProtAcc | Q9Y5C1 |
Top |
Malignant transformation analysis |
| Identification of the aberrant gene expression in precancerous and cancerous lesions by comparing the gene expression of stem-like cells in diseased tissues with normal stem cells |
| Entrez ID | Symbol | Replicates | Species | Organ | Tissue | Adj P-value | Log2FC | Malignancy |
| 27329 | ANGPTL3 | NAFLD1 | Human | Liver | NAFLD | 6.37e-09 | 6.29e-01 | -0.04 |
| 27329 | ANGPTL3 | S41 | Human | Liver | Cirrhotic | 4.37e-04 | 4.27e-01 | -0.0343 |
| 27329 | ANGPTL3 | S43 | Human | Liver | Cirrhotic | 2.96e-02 | 1.67e-01 | -0.0187 |
| 27329 | ANGPTL3 | HCC1_Meng | Human | Liver | HCC | 2.33e-86 | 8.85e-01 | 0.0246 |
| 27329 | ANGPTL3 | HCC2_Meng | Human | Liver | HCC | 2.05e-03 | -1.66e-01 | 0.0107 |
| 27329 | ANGPTL3 | HCC1 | Human | Liver | HCC | 2.04e-37 | 5.55e+00 | 0.5336 |
| 27329 | ANGPTL3 | HCC2 | Human | Liver | HCC | 4.95e-24 | 3.30e+00 | 0.5341 |
| 27329 | ANGPTL3 | HCC5 | Human | Liver | HCC | 5.29e-05 | 3.28e+00 | 0.4932 |
| 27329 | ANGPTL3 | Pt13.a | Human | Liver | HCC | 3.30e-33 | 7.44e-01 | 0.021 |
| 27329 | ANGPTL3 | Pt13.b | Human | Liver | HCC | 2.35e-61 | 6.54e-01 | 0.0251 |
| 27329 | ANGPTL3 | Pt13.c | Human | Liver | HCC | 6.54e-03 | 4.20e-01 | 0.0076 |
| 27329 | ANGPTL3 | Pt14.a | Human | Liver | HCC | 4.25e-07 | 4.45e-01 | 0.0169 |
| 27329 | ANGPTL3 | Pt14.b | Human | Liver | HCC | 2.52e-19 | 7.03e-01 | 0.018 |
| 27329 | ANGPTL3 | Pt14.d | Human | Liver | HCC | 2.21e-06 | 3.09e-01 | 0.0143 |
| Page: 1 |
| Tissue | Expression Dynamics | Abbreviation |
| Liver | 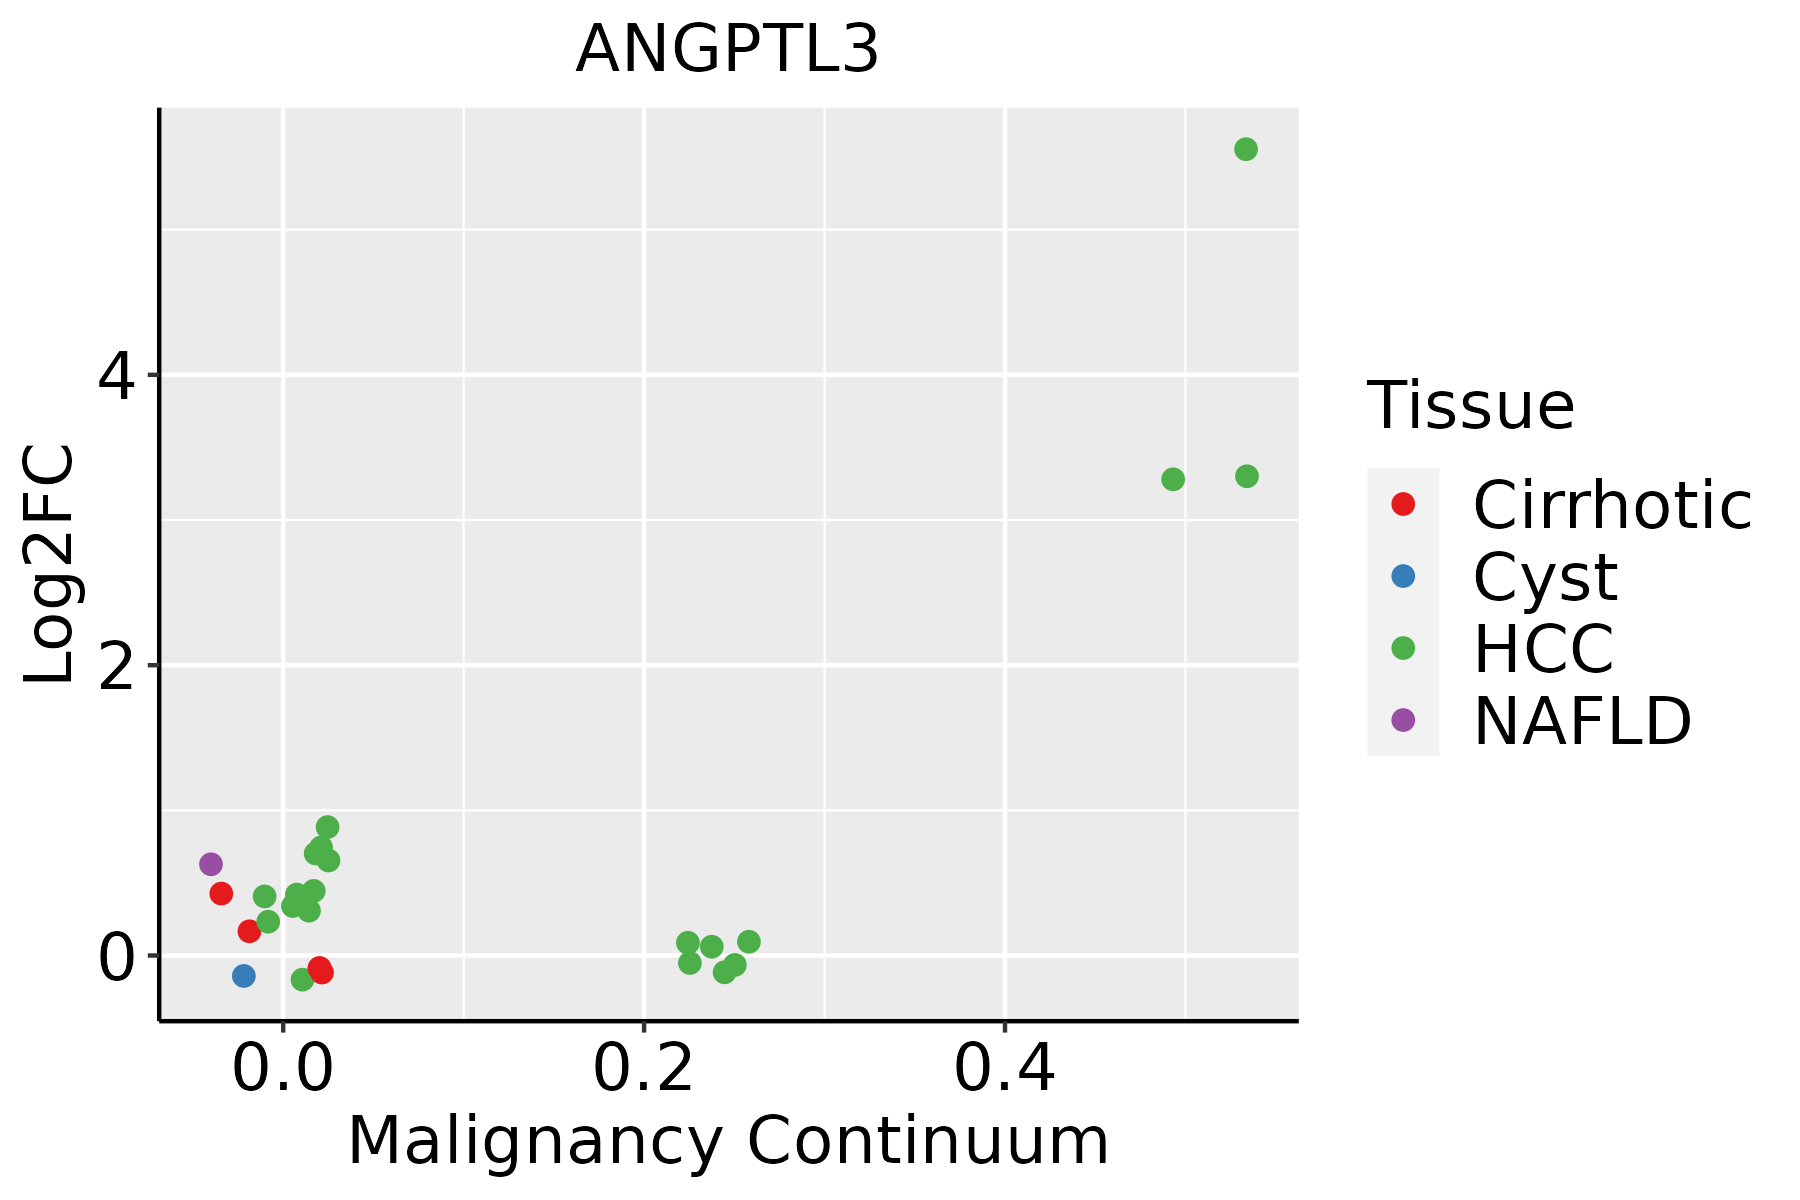 | HCC: Hepatocellular carcinoma |
| NAFLD: Non-alcoholic fatty liver disease |
| ∗log2FC in expression of this searched gene in stem-like cells from each diseased tissue sample relative to stem-like cells in normal samples in each tissue plotted against the malignancy continuum. Samples are colored based on if they are from different disease stage. |
Top |
Malignant transformation related pathway analysis |
| Find out the enriched GO biological processes and KEGG pathways involved in transition from healthy to precancer to cancer |
| Tissue | Disease Stage | Enriched GO biological Processes |
| Colorectum | AD |  |
| Colorectum | SER |  |
| Colorectum | MSS |  |
| Colorectum | MSI-H |  |
| Colorectum | FAP |  |
| ∗Top 15 enriched GO BP terms are showed in the bar plot of each disease state in each tissue. Each row represents a significant GO biological process which is colored according to the -log10(p.adjust). |
| Page: 1 2 3 4 5 6 7 8 9 |
| GO ID | Tissue | Disease Stage | Description | Gene Ratio | Bg Ratio | pvalue | p.adjust | Count |
| GO:00098967 | Liver | NAFLD | positive regulation of catabolic process | 108/1882 | 492/18723 | 2.68e-15 | 3.14e-12 | 108 |
| GO:00066316 | Liver | NAFLD | fatty acid metabolic process | 92/1882 | 390/18723 | 3.38e-15 | 3.29e-12 | 92 |
| GO:00082023 | Liver | NAFLD | steroid metabolic process | 69/1882 | 319/18723 | 5.90e-10 | 1.28e-07 | 69 |
| GO:00442425 | Liver | NAFLD | cellular lipid catabolic process | 52/1882 | 214/18723 | 1.15e-09 | 2.17e-07 | 52 |
| GO:00550883 | Liver | NAFLD | lipid homeostasis | 44/1882 | 167/18723 | 1.48e-09 | 2.54e-07 | 44 |
| GO:00160426 | Liver | NAFLD | lipid catabolic process | 63/1882 | 320/18723 | 1.35e-07 | 1.02e-05 | 63 |
| GO:0055090 | Liver | NAFLD | acylglycerol homeostasis | 17/1882 | 42/18723 | 2.22e-07 | 1.53e-05 | 17 |
| GO:0070328 | Liver | NAFLD | triglyceride homeostasis | 17/1882 | 42/18723 | 2.22e-07 | 1.53e-05 | 17 |
| GO:00071606 | Liver | NAFLD | cell-matrix adhesion | 49/1882 | 233/18723 | 4.36e-07 | 2.74e-05 | 49 |
| GO:00108765 | Liver | NAFLD | lipid localization | 79/1882 | 448/18723 | 4.75e-07 | 2.92e-05 | 79 |
| GO:00442623 | Liver | NAFLD | cellular carbohydrate metabolic process | 55/1882 | 283/18723 | 1.27e-06 | 6.01e-05 | 55 |
| GO:00426323 | Liver | NAFLD | cholesterol homeostasis | 26/1882 | 96/18723 | 1.83e-06 | 7.86e-05 | 26 |
| GO:00192163 | Liver | NAFLD | regulation of lipid metabolic process | 61/1882 | 331/18723 | 2.18e-06 | 9.24e-05 | 61 |
| GO:00550923 | Liver | NAFLD | sterol homeostasis | 26/1882 | 97/18723 | 2.26e-06 | 9.51e-05 | 26 |
| GO:00315896 | Liver | NAFLD | cell-substrate adhesion | 65/1882 | 363/18723 | 2.84e-06 | 1.18e-04 | 65 |
| GO:0008203 | Liver | NAFLD | cholesterol metabolic process | 32/1882 | 137/18723 | 4.28e-06 | 1.66e-04 | 32 |
| GO:0016125 | Liver | NAFLD | sterol metabolic process | 34/1882 | 152/18723 | 6.02e-06 | 2.11e-04 | 34 |
| GO:1902652 | Liver | NAFLD | secondary alcohol metabolic process | 33/1882 | 147/18723 | 7.57e-06 | 2.56e-04 | 33 |
| GO:00060666 | Liver | NAFLD | alcohol metabolic process | 62/1882 | 353/18723 | 9.01e-06 | 2.96e-04 | 62 |
| GO:00513467 | Liver | NAFLD | negative regulation of hydrolase activity | 62/1882 | 379/18723 | 8.11e-05 | 1.66e-03 | 62 |
| Page: 1 2 3 4 5 |
| Pathway ID | Tissue | Disease Stage | Description | Gene Ratio | Bg Ratio | pvalue | p.adjust | qvalue | Count |
| hsa049796 | Liver | NAFLD | Cholesterol metabolism | 20/1043 | 51/8465 | 9.73e-07 | 4.56e-05 | 3.67e-05 | 20 |
| hsa0497911 | Liver | NAFLD | Cholesterol metabolism | 20/1043 | 51/8465 | 9.73e-07 | 4.56e-05 | 3.67e-05 | 20 |
| hsa049792 | Liver | Cirrhotic | Cholesterol metabolism | 30/2530 | 51/8465 | 1.59e-05 | 1.39e-04 | 8.60e-05 | 30 |
| hsa049793 | Liver | Cirrhotic | Cholesterol metabolism | 30/2530 | 51/8465 | 1.59e-05 | 1.39e-04 | 8.60e-05 | 30 |
| hsa049794 | Liver | HCC | Cholesterol metabolism | 41/4020 | 51/8465 | 1.33e-06 | 1.35e-05 | 7.49e-06 | 41 |
| hsa049795 | Liver | HCC | Cholesterol metabolism | 41/4020 | 51/8465 | 1.33e-06 | 1.35e-05 | 7.49e-06 | 41 |
| Page: 1 |
Top |
Cell-cell communication analysis |
| Identification of potential cell-cell interactions between two cell types and their ligand-receptor pairs for different disease states |
| Ligand | Receptor | LRpair | Pathway | Tissue | Disease Stage |
| Page: 1 |
Top |
Single-cell gene regulatory network inference analysis |
| Find out the significant the regulons (TFs) and the target genes of each regulon across cell types for different disease states |
| TF | Cell Type | Tissue | Disease Stage | Target Gene | RSS | Regulon Activity |
| ∗The dot plots of a searched regulon are shown for all cell subpopulations in each disease state of each tissue based on the regulon specific score inferred using pySCENIC and by calculating the average expression. |
| Page: 1 |
Top |
Somatic mutation of malignant transformation related genes |
| Annotation of somatic variants for genes involved in malignant transformation |
| Hugo Symbol | Variant Class | Variant Classification | dbSNP RS | HGVSc | HGVSp | HGVSp Short | SWISSPROT | BIOTYPE | SIFT | PolyPhen | Tumor Sample Barcode | Tissue | Histology | Sex | Age | Stage | Therapy Types | Drugs | Outcome |
| ANGPTL3 | SNV | Missense_Mutation | novel | c.923G>T | p.Arg308Met | p.R308M | Q9Y5C1 | protein_coding | deleterious(0.02) | possibly_damaging(0.657) | TCGA-A2-A25A-01 | Breast | breast invasive carcinoma | Female | <65 | I/II | Unspecific | Cytoxan | SD |
| ANGPTL3 | SNV | Missense_Mutation | c.500N>C | p.Phe167Ser | p.F167S | Q9Y5C1 | protein_coding | deleterious(0.01) | possibly_damaging(0.447) | TCGA-A8-A06Q-01 | Breast | breast invasive carcinoma | Female | <65 | III/IV | Unknown | Unknown | SD | |
| ANGPTL3 | SNV | Missense_Mutation | c.592G>C | p.Glu198Gln | p.E198Q | Q9Y5C1 | protein_coding | tolerated(0.17) | possibly_damaging(0.608) | TCGA-AC-A23H-01 | Breast | breast invasive carcinoma | Female | >=65 | I/II | Unknown | Unknown | PD | |
| ANGPTL3 | SNV | Missense_Mutation | rs766843384 | c.253C>A | p.Leu85Ile | p.L85I | Q9Y5C1 | protein_coding | tolerated(0.05) | possibly_damaging(0.858) | TCGA-AN-A046-01 | Breast | breast invasive carcinoma | Female | >=65 | I/II | Unknown | Unknown | SD |
| ANGPTL3 | SNV | Missense_Mutation | c.662N>C | p.Arg221Thr | p.R221T | Q9Y5C1 | protein_coding | tolerated(0.35) | benign(0.301) | TCGA-C8-A135-01 | Breast | breast invasive carcinoma | Female | <65 | I/II | Chemotherapy | 5-fluorouracil | CR | |
| ANGPTL3 | SNV | Missense_Mutation | novel | c.302G>T | p.Arg101Ile | p.R101I | Q9Y5C1 | protein_coding | deleterious(0.02) | benign(0) | TCGA-2W-A8YY-01 | Cervix | cervical & endocervical cancer | Female | <65 | I/II | Chemotherapy | cisplatin | CR |
| ANGPTL3 | SNV | Missense_Mutation | novel | c.954G>T | p.Glu318Asp | p.E318D | Q9Y5C1 | protein_coding | tolerated(0.07) | benign(0.388) | TCGA-2W-A8YY-01 | Cervix | cervical & endocervical cancer | Female | <65 | I/II | Chemotherapy | cisplatin | CR |
| ANGPTL3 | SNV | Missense_Mutation | c.693G>C | p.Leu231Phe | p.L231F | Q9Y5C1 | protein_coding | tolerated(0.72) | benign(0.006) | TCGA-FU-A40J-01 | Cervix | cervical & endocervical cancer | Female | <65 | III/IV | Chemotherapy | carboplatin | CR | |
| ANGPTL3 | insertion | In_Frame_Ins | novel | c.1005_1006insTTTAGTCTT | p.Leu335_Glu336insPheSerLeu | p.L335_E336insFSL | Q9Y5C1 | protein_coding | TCGA-AM-5820-01 | Colorectum | colon adenocarcinoma | Female | <65 | I/II | Unknown | Unknown | SD | ||
| ANGPTL3 | SNV | Missense_Mutation | rs375934830 | c.397N>A | p.Leu133Ile | p.L133I | Q9Y5C1 | protein_coding | tolerated(0.19) | benign(0.031) | TCGA-A5-A2K5-01 | Endometrium | uterine corpus endometrioid carcinoma | Female | >=65 | I/II | Unknown | Unknown | SD |
| Page: 1 2 3 4 |
Top |
Related drugs of malignant transformation related genes |
| Identification of chemicals and drugs interact with genes involved in malignant transfromation |
| (DGIdb 4.0) |
| Entrez ID | Symbol | Category | Interaction Types | Drug Claim Name | Drug Name | PMIDs |
| 27329 | ANGPTL3 | DRUGGABLE GENOME, FIBRINOGEN, CELL SURFACE, GROWTH FACTOR | AKCEA-ANGPTL3-LRX | VUPANORSEN | ||
| 27329 | ANGPTL3 | DRUGGABLE GENOME, FIBRINOGEN, CELL SURFACE, GROWTH FACTOR | Evinacumab | EVINACUMAB |
| Page: 1 |

Copyright 2023-Present -The University of Texas Health Science Center at Houston |