
|
|||||
|
 | |
| |
| |
| |
| |
| |
|
Gene: ANGPTL2 |
Gene summary for ANGPTL2 |
| Gene information | Species | Human | Gene symbol | ANGPTL2 | Gene ID | 23452 |
| Gene name | angiopoietin like 2 | |
| Gene Alias | ARP2 | |
| Cytomap | 9q33.3 | |
| Gene Type | protein-coding | GO ID | GO:0007275 | UniProtAcc | A0A024R868 |
Top |
Malignant transformation analysis |
| Identification of the aberrant gene expression in precancerous and cancerous lesions by comparing the gene expression of stem-like cells in diseased tissues with normal stem cells |
| Entrez ID | Symbol | Replicates | Species | Organ | Tissue | Adj P-value | Log2FC | Malignancy |
| 23452 | ANGPTL2 | P2T-E | Human | Esophagus | ESCC | 7.00e-10 | 1.13e-01 | 0.1177 |
| 23452 | ANGPTL2 | P8T-E | Human | Esophagus | ESCC | 8.08e-25 | 8.48e-01 | 0.0889 |
| 23452 | ANGPTL2 | P10T-E | Human | Esophagus | ESCC | 1.03e-06 | 2.30e-01 | 0.116 |
| 23452 | ANGPTL2 | P11T-E | Human | Esophagus | ESCC | 1.40e-05 | 4.78e-01 | 0.1426 |
| 23452 | ANGPTL2 | P12T-E | Human | Esophagus | ESCC | 1.61e-02 | 1.06e-01 | 0.1122 |
| 23452 | ANGPTL2 | P21T-E | Human | Esophagus | ESCC | 8.18e-15 | 4.83e-01 | 0.1617 |
| 23452 | ANGPTL2 | P27T-E | Human | Esophagus | ESCC | 1.32e-05 | 1.24e-01 | 0.1055 |
| 23452 | ANGPTL2 | P44T-E | Human | Esophagus | ESCC | 2.54e-02 | 4.98e-01 | 0.1096 |
| 23452 | ANGPTL2 | P54T-E | Human | Esophagus | ESCC | 7.11e-05 | 7.33e-02 | 0.0975 |
| 23452 | ANGPTL2 | P61T-E | Human | Esophagus | ESCC | 2.92e-04 | 4.89e-02 | 0.099 |
| 23452 | ANGPTL2 | P79T-E | Human | Esophagus | ESCC | 3.44e-02 | 1.32e-01 | 0.1154 |
| 23452 | ANGPTL2 | P128T-E | Human | Esophagus | ESCC | 4.45e-05 | 5.52e-01 | 0.1241 |
| 23452 | ANGPTL2 | S014 | Human | Liver | HCC | 1.78e-14 | 6.18e-01 | 0.2254 |
| 23452 | ANGPTL2 | S015 | Human | Liver | HCC | 8.11e-10 | 6.13e-01 | 0.2375 |
| 23452 | ANGPTL2 | S016 | Human | Liver | HCC | 1.96e-27 | 8.10e-01 | 0.2243 |
| 23452 | ANGPTL2 | male-WTA | Human | Thyroid | PTC | 2.56e-04 | 5.79e-02 | 0.1037 |
| 23452 | ANGPTL2 | PTC06 | Human | Thyroid | PTC | 4.12e-03 | 1.34e-01 | 0.2057 |
| 23452 | ANGPTL2 | ATC09 | Human | Thyroid | ATC | 3.24e-14 | 5.89e-01 | 0.2871 |
| 23452 | ANGPTL2 | ATC12 | Human | Thyroid | ATC | 3.36e-25 | 6.12e-01 | 0.34 |
| 23452 | ANGPTL2 | ATC13 | Human | Thyroid | ATC | 4.57e-72 | 2.10e+00 | 0.34 |
| Page: 1 2 |
| Tissue | Expression Dynamics | Abbreviation |
| Esophagus | 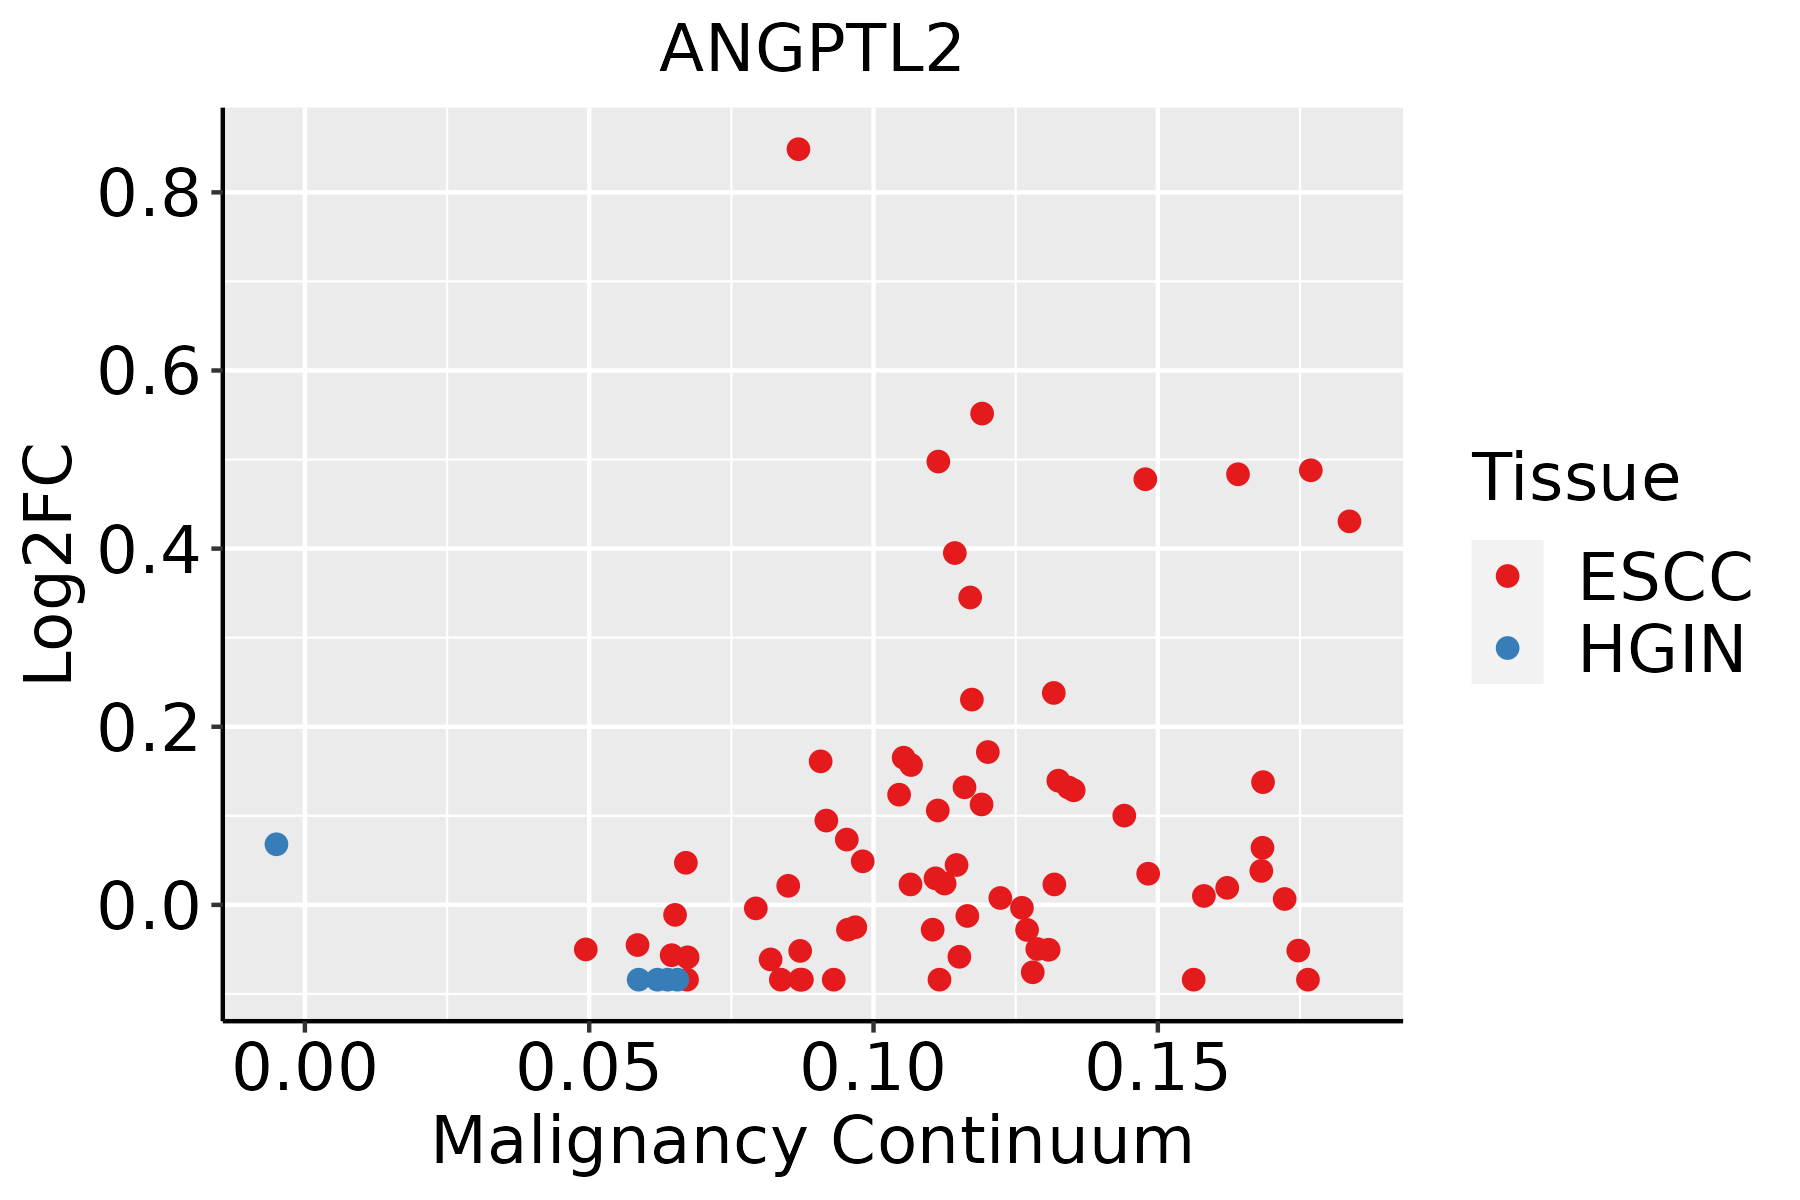 | ESCC: Esophageal squamous cell carcinoma |
| HGIN: High-grade intraepithelial neoplasias | ||
| LGIN: Low-grade intraepithelial neoplasias | ||
| Liver |  | HCC: Hepatocellular carcinoma |
| NAFLD: Non-alcoholic fatty liver disease | ||
| Thyroid | 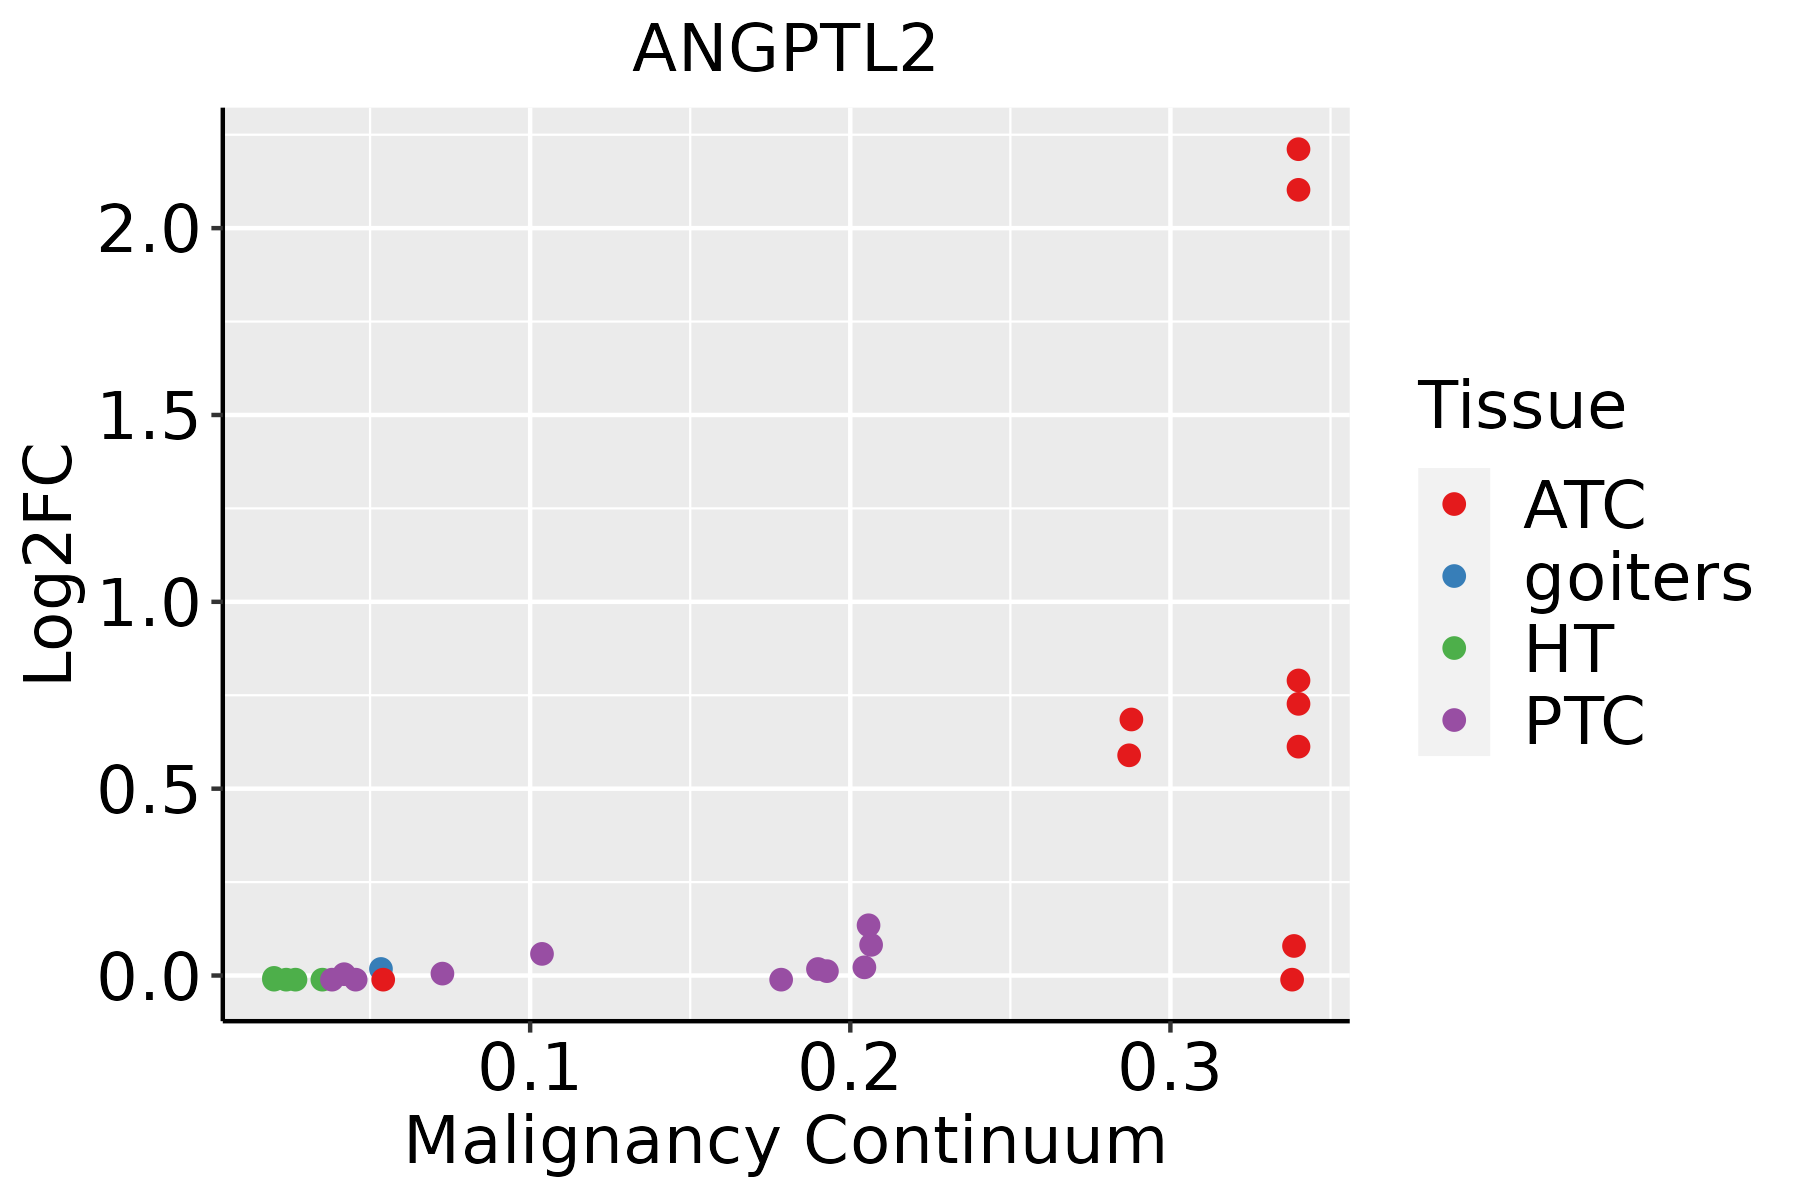 | ATC: Anaplastic thyroid cancer |
| HT: Hashimoto's thyroiditis | ||
| PTC: Papillary thyroid cancer |
| ∗log2FC in expression of this searched gene in stem-like cells from each diseased tissue sample relative to stem-like cells in normal samples in each tissue plotted against the malignancy continuum. Samples are colored based on if they are from different disease stage. |
Top |
Malignant transformation related pathway analysis |
| Find out the enriched GO biological processes and KEGG pathways involved in transition from healthy to precancer to cancer |
| Tissue | Disease Stage | Enriched GO biological Processes |
| Colorectum | AD |  |
| Colorectum | SER |  |
| Colorectum | MSS |  |
| Colorectum | MSI-H |  |
| Colorectum | FAP |  |
| ∗Top 15 enriched GO BP terms are showed in the bar plot of each disease state in each tissue. Each row represents a significant GO biological process which is colored according to the -log10(p.adjust). |
| Page: 1 2 3 4 5 6 7 8 9 |
| GO ID | Tissue | Disease Stage | Description | Gene Ratio | Bg Ratio | pvalue | p.adjust | Count |
| Page: 1 |
| Pathway ID | Tissue | Disease Stage | Description | Gene Ratio | Bg Ratio | pvalue | p.adjust | qvalue | Count |
| Page: 1 |
Top |
Cell-cell communication analysis |
| Identification of potential cell-cell interactions between two cell types and their ligand-receptor pairs for different disease states |
| Ligand | Receptor | LRpair | Pathway | Tissue | Disease Stage |
| ANGPTL2 | ITGA5_ITGB1 | ANGPTL2_ITGA5_ITGB1 | ANGPTL | Breast | ADJ |
| ANGPTL2 | ITGA5_ITGB1 | ANGPTL2_ITGA5_ITGB1 | ANGPTL | Breast | DCIS |
| ANGPTL2 | TLR4 | ANGPTL2_TLR4 | ANGPTL | Breast | DCIS |
| ANGPTL2 | LILRB3 | ANGPTL2_PIRB | ANGPTL | Breast | DCIS |
| ANGPTL2 | ITGA5_ITGB1 | ANGPTL2_ITGA5_ITGB1 | ANGPTL | Breast | Healthy |
| ANGPTL2 | ITGA5_ITGB1 | ANGPTL2_ITGA5_ITGB1 | ANGPTL | Breast | IDC |
| ANGPTL2 | TLR4 | ANGPTL2_TLR4 | ANGPTL | Breast | IDC |
| ANGPTL2 | LILRB3 | ANGPTL2_PIRB | ANGPTL | Breast | IDC |
| ANGPTL2 | ITGA5_ITGB1 | ANGPTL2_ITGA5_ITGB1 | ANGPTL | Breast | Precancer |
| ANGPTL2 | ITGA5_ITGB1 | ANGPTL2_ITGA5_ITGB1 | ANGPTL | Cervix | ADJ |
| ANGPTL2 | TLR4 | ANGPTL2_TLR4 | ANGPTL | Cervix | ADJ |
| ANGPTL2 | ITGA5_ITGB1 | ANGPTL2_ITGA5_ITGB1 | ANGPTL | Cervix | CC |
| ANGPTL2 | TLR4 | ANGPTL2_TLR4 | ANGPTL | Cervix | CC |
| ANGPTL2 | LILRB3 | ANGPTL2_PIRB | ANGPTL | Cervix | CC |
| ANGPTL2 | ITGA5_ITGB1 | ANGPTL2_ITGA5_ITGB1 | ANGPTL | Cervix | Precancer |
| ANGPTL2 | TLR4 | ANGPTL2_TLR4 | ANGPTL | Cervix | Precancer |
| ANGPTL2 | LILRB3 | ANGPTL2_PIRB | ANGPTL | Cervix | Precancer |
| ANGPTL2 | ITGA5_ITGB1 | ANGPTL2_ITGA5_ITGB1 | ANGPTL | CRC | MSI-H |
| ANGPTL2 | ITGA5_ITGB1 | ANGPTL2_ITGA5_ITGB1 | ANGPTL | CRC | MSS |
| ANGPTL2 | ITGA5_ITGB1 | ANGPTL2_ITGA5_ITGB1 | ANGPTL | Endometrium | AEH |
| Page: 1 2 3 |
Top |
Single-cell gene regulatory network inference analysis |
| Find out the significant the regulons (TFs) and the target genes of each regulon across cell types for different disease states |
| TF | Cell Type | Tissue | Disease Stage | Target Gene | RSS | Regulon Activity |
| ∗The dot plots of a searched regulon are shown for all cell subpopulations in each disease state of each tissue based on the regulon specific score inferred using pySCENIC and by calculating the average expression. |
| Page: 1 |
Top |
Somatic mutation of malignant transformation related genes |
| Annotation of somatic variants for genes involved in malignant transformation |
| Hugo Symbol | Variant Class | Variant Classification | dbSNP RS | HGVSc | HGVSp | HGVSp Short | SWISSPROT | BIOTYPE | SIFT | PolyPhen | Tumor Sample Barcode | Tissue | Histology | Sex | Age | Stage | Therapy Types | Drugs | Outcome |
| ANGPTL2 | SNV | Missense_Mutation | novel | c.866G>T | p.Ser289Ile | p.S289I | Q9UKU9 | protein_coding | deleterious(0) | probably_damaging(0.995) | TCGA-A8-A09Z-01 | Breast | breast invasive carcinoma | Female | >=65 | I/II | Unknown | Unknown | SD |
| ANGPTL2 | SNV | Missense_Mutation | rs768957923 | c.355N>A | p.Glu119Lys | p.E119K | Q9UKU9 | protein_coding | deleterious(0.02) | probably_damaging(0.967) | TCGA-D8-A1XG-01 | Breast | breast invasive carcinoma | Female | >=65 | III/IV | Unknown | Unknown | SD |
| ANGPTL2 | insertion | Frame_Shift_Ins | novel | c.1350_1351insAAAACAAGGCCCAACCTTACTGGTCACT | p.Val451LysfsTer29 | p.V451Kfs*29 | Q9UKU9 | protein_coding | TCGA-AN-A049-01 | Breast | breast invasive carcinoma | Female | <65 | I/II | Unknown | Unknown | SD | ||
| ANGPTL2 | insertion | Frame_Shift_Ins | novel | c.682_683insACATTGTAGGGGCTGGGCATGGGAAGGAGTCCTT | p.Pro228HisfsTer29 | p.P228Hfs*29 | Q9UKU9 | protein_coding | TCGA-B6-A0IN-01 | Breast | breast invasive carcinoma | Female | <65 | I/II | Unknown | Unknown | PD | ||
| ANGPTL2 | deletion | Frame_Shift_Del | novel | c.1260delN | p.Asp420GlufsTer63 | p.D420Efs*63 | Q9UKU9 | protein_coding | TCGA-D8-A27V-01 | Breast | breast invasive carcinoma | Female | <65 | I/II | Hormone Therapy | tamoxiphen | SD | ||
| ANGPTL2 | SNV | Missense_Mutation | rs140066485 | c.76N>A | p.Gly26Ser | p.G26S | Q9UKU9 | protein_coding | tolerated_low_confidence(0.54) | benign(0.012) | TCGA-2W-A8YY-01 | Cervix | cervical & endocervical cancer | Female | <65 | I/II | Chemotherapy | cisplatin | CR |
| ANGPTL2 | SNV | Missense_Mutation | rs752232897 | c.1073N>T | p.Thr358Met | p.T358M | Q9UKU9 | protein_coding | deleterious(0) | probably_damaging(0.982) | TCGA-AA-3811-01 | Colorectum | colon adenocarcinoma | Female | >=65 | III/IV | Unknown | Unknown | PD |
| ANGPTL2 | SNV | Missense_Mutation | rs191786568 | c.190C>T | p.Arg64Trp | p.R64W | Q9UKU9 | protein_coding | deleterious(0) | possibly_damaging(0.822) | TCGA-AA-A00N-01 | Colorectum | colon adenocarcinoma | Male | >=65 | I/II | Unknown | Unknown | PD |
| ANGPTL2 | SNV | Missense_Mutation | c.1264G>T | p.Asp422Tyr | p.D422Y | Q9UKU9 | protein_coding | deleterious(0) | probably_damaging(1) | TCGA-AA-A010-01 | Colorectum | colon adenocarcinoma | Female | <65 | I/II | Chemotherapy | folinic | CR | |
| ANGPTL2 | SNV | Missense_Mutation | c.646N>T | p.Pro216Ser | p.P216S | Q9UKU9 | protein_coding | tolerated(0.55) | benign(0.007) | TCGA-AA-A01P-01 | Colorectum | colon adenocarcinoma | Female | >=65 | III/IV | Unknown | Unknown | PD |
| Page: 1 2 3 4 5 6 |
Top |
Related drugs of malignant transformation related genes |
| Identification of chemicals and drugs interact with genes involved in malignant transfromation |
| (DGIdb 4.0) |
| Entrez ID | Symbol | Category | Interaction Types | Drug Claim Name | Drug Name | PMIDs |
| Page: 1 |

Copyright 2023-Present -The University of Texas Health Science Center at Houston |