
|
|||||
|
 | |
| |
| |
| |
| |
| |
|
Gene: ANGPTL1 |
Gene summary for ANGPTL1 |
| Gene information | Species | Human | Gene symbol | ANGPTL1 | Gene ID | 9068 |
| Gene name | angiopoietin like 1 | |
| Gene Alias | ANG3 | |
| Cytomap | 1q25.2 | |
| Gene Type | protein-coding | GO ID | GO:0007154 | UniProtAcc | A0A024R908 |
Top |
Malignant transformation analysis |
| Identification of the aberrant gene expression in precancerous and cancerous lesions by comparing the gene expression of stem-like cells in diseased tissues with normal stem cells |
| Entrez ID | Symbol | Replicates | Species | Organ | Tissue | Adj P-value | Log2FC | Malignancy |
| 9068 | ANGPTL1 | PTCwithHT_6 | Human | Thyroid | HT | 4.82e-02 | -2.11e-01 | 0.02 |
| 9068 | ANGPTL1 | male-WTA | Human | Thyroid | PTC | 2.78e-10 | -6.19e-02 | 0.1037 |
| 9068 | ANGPTL1 | PTC01 | Human | Thyroid | PTC | 5.01e-04 | 2.04e-01 | 0.1899 |
| 9068 | ANGPTL1 | PTC03 | Human | Thyroid | PTC | 1.13e-02 | -8.63e-02 | 0.1784 |
| 9068 | ANGPTL1 | PTC04 | Human | Thyroid | PTC | 1.39e-04 | -1.19e-01 | 0.1927 |
| 9068 | ANGPTL1 | PTC05 | Human | Thyroid | PTC | 1.56e-10 | 4.98e-02 | 0.2065 |
| 9068 | ANGPTL1 | PTC06 | Human | Thyroid | PTC | 1.07e-08 | 4.68e-01 | 0.2057 |
| 9068 | ANGPTL1 | PTC07 | Human | Thyroid | PTC | 1.47e-14 | 1.76e-01 | 0.2044 |
| Page: 1 |
| Tissue | Expression Dynamics | Abbreviation |
| Thyroid | 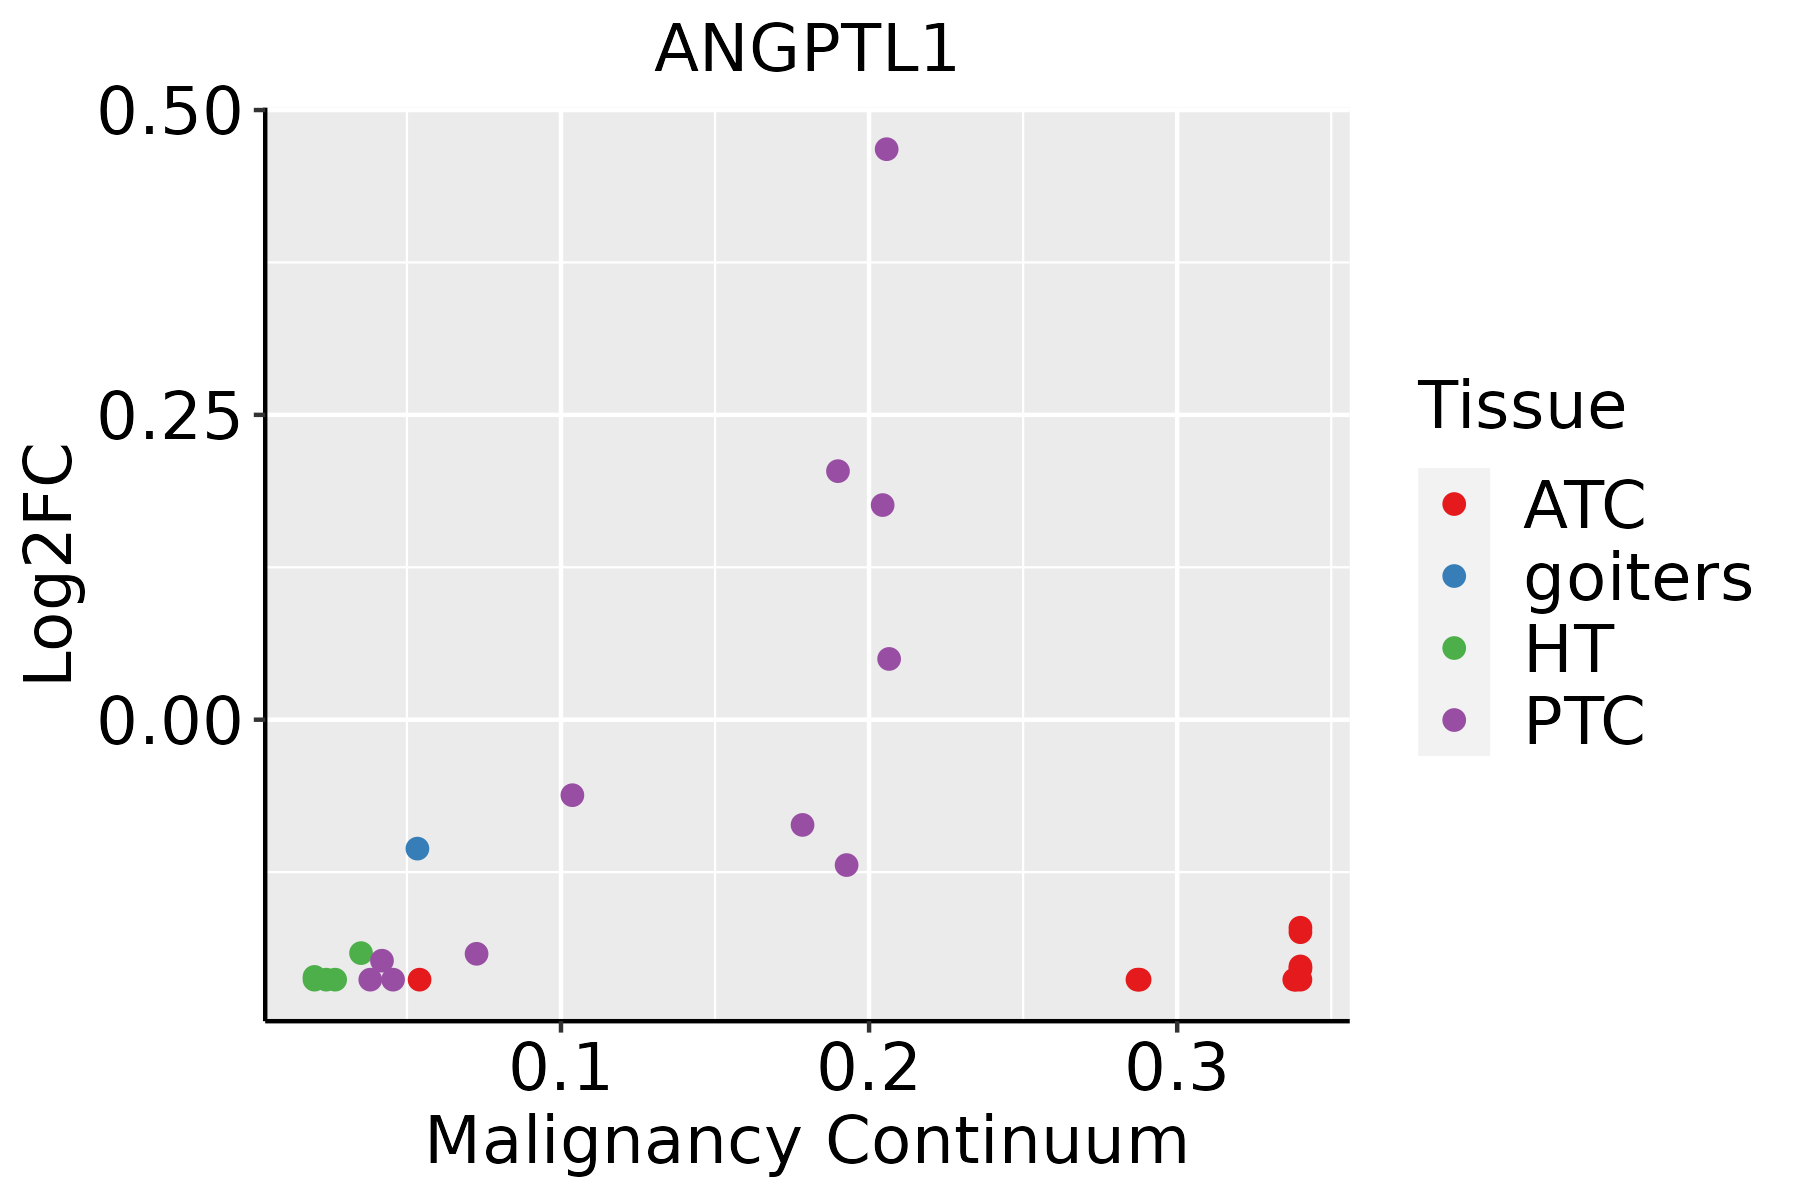 | ATC: Anaplastic thyroid cancer |
| HT: Hashimoto's thyroiditis | ||
| PTC: Papillary thyroid cancer |
| ∗log2FC in expression of this searched gene in stem-like cells from each diseased tissue sample relative to stem-like cells in normal samples in each tissue plotted against the malignancy continuum. Samples are colored based on if they are from different disease stage. |
Top |
Malignant transformation related pathway analysis |
| Find out the enriched GO biological processes and KEGG pathways involved in transition from healthy to precancer to cancer |
| Tissue | Disease Stage | Enriched GO biological Processes |
| Colorectum | AD |  |
| Colorectum | SER |  |
| Colorectum | MSS |  |
| Colorectum | MSI-H |  |
| Colorectum | FAP |  |
| ∗Top 15 enriched GO BP terms are showed in the bar plot of each disease state in each tissue. Each row represents a significant GO biological process which is colored according to the -log10(p.adjust). |
| Page: 1 2 3 4 5 6 7 8 9 |
| GO ID | Tissue | Disease Stage | Description | Gene Ratio | Bg Ratio | pvalue | p.adjust | Count |
| Page: 1 |
| Pathway ID | Tissue | Disease Stage | Description | Gene Ratio | Bg Ratio | pvalue | p.adjust | qvalue | Count |
| Page: 1 |
Top |
Cell-cell communication analysis |
| Identification of potential cell-cell interactions between two cell types and their ligand-receptor pairs for different disease states |
| Ligand | Receptor | LRpair | Pathway | Tissue | Disease Stage |
| ANGPTL1 | ITGA1_ITGB1 | ANGPTL1_ITGA1_ITGB1 | ANGPTL | Breast | DCIS |
| ANGPTL1 | LILRB3 | ANGPTL1_PIRB | ANGPTL | Breast | DCIS |
| ANGPTL1 | ITGA1_ITGB1 | ANGPTL1_ITGA1_ITGB1 | ANGPTL | Breast | Healthy |
| ANGPTL1 | ITGA1_ITGB1 | ANGPTL1_ITGA1_ITGB1 | ANGPTL | Breast | Precancer |
| ANGPTL1 | ITGA1_ITGB1 | ANGPTL1_ITGA1_ITGB1 | ANGPTL | Cervix | ADJ |
| ANGPTL1 | ITGA1_ITGB1 | ANGPTL1_ITGA1_ITGB1 | ANGPTL | Endometrium | Healthy |
| ANGPTL1 | LILRB3 | ANGPTL1_PIRB | ANGPTL | Endometrium | Healthy |
| ANGPTL1 | ITGA1_ITGB1 | ANGPTL1_ITGA1_ITGB1 | ANGPTL | Esophagus | ESCC |
| ANGPTL1 | ITGA1_ITGB1 | ANGPTL1_ITGA1_ITGB1 | ANGPTL | GC | ADJ |
| ANGPTL1 | ITGA1_ITGB1 | ANGPTL1_ITGA1_ITGB1 | ANGPTL | GC | GC |
| ANGPTL1 | ITGA1_ITGB1 | ANGPTL1_ITGA1_ITGB1 | ANGPTL | HNSCC | ADJ |
| ANGPTL1 | LILRB3 | ANGPTL1_PIRB | ANGPTL | HNSCC | ADJ |
| ANGPTL1 | ITGA1_ITGB1 | ANGPTL1_ITGA1_ITGB1 | ANGPTL | HNSCC | OSCC |
| ANGPTL1 | LILRB3 | ANGPTL1_PIRB | ANGPTL | HNSCC | OSCC |
| ANGPTL1 | ITGA1_ITGB1 | ANGPTL1_ITGA1_ITGB1 | ANGPTL | HNSCC | Precancer |
| ANGPTL1 | LILRB3 | ANGPTL1_PIRB | ANGPTL | HNSCC | Precancer |
| ANGPTL1 | ITGA1_ITGB1 | ANGPTL1_ITGA1_ITGB1 | ANGPTL | Liver | Precancer |
| ANGPTL1 | LILRB3 | ANGPTL1_PIRB | ANGPTL | Liver | Precancer |
| ANGPTL1 | ITGA1_ITGB1 | ANGPTL1_ITGA1_ITGB1 | ANGPTL | Lung | AAH |
| ANGPTL1 | LILRB3 | ANGPTL1_PIRB | ANGPTL | Lung | AAH |
| Page: 1 2 3 |
Top |
Single-cell gene regulatory network inference analysis |
| Find out the significant the regulons (TFs) and the target genes of each regulon across cell types for different disease states |
| TF | Cell Type | Tissue | Disease Stage | Target Gene | RSS | Regulon Activity |
| ∗The dot plots of a searched regulon are shown for all cell subpopulations in each disease state of each tissue based on the regulon specific score inferred using pySCENIC and by calculating the average expression. |
| Page: 1 |
Top |
Somatic mutation of malignant transformation related genes |
| Annotation of somatic variants for genes involved in malignant transformation |
| Hugo Symbol | Variant Class | Variant Classification | dbSNP RS | HGVSc | HGVSp | HGVSp Short | SWISSPROT | BIOTYPE | SIFT | PolyPhen | Tumor Sample Barcode | Tissue | Histology | Sex | Age | Stage | Therapy Types | Drugs | Outcome |
| ANGPTL1 | SNV | Missense_Mutation | c.490N>C | p.Glu164Gln | p.E164Q | O95841 | protein_coding | tolerated(0.22) | benign(0.141) | TCGA-A8-A081-01 | Breast | breast invasive carcinoma | Female | >=65 | I/II | Unknown | Unknown | SD | |
| ANGPTL1 | SNV | Missense_Mutation | c.1182N>G | p.Phe394Leu | p.F394L | O95841 | protein_coding | tolerated(0.61) | benign(0.099) | TCGA-AO-A0JC-01 | Breast | breast invasive carcinoma | Female | <65 | I/II | Chemotherapy | fluorouracil | SD | |
| ANGPTL1 | SNV | Missense_Mutation | c.274N>T | p.Leu92Phe | p.L92F | O95841 | protein_coding | deleterious(0.02) | probably_damaging(0.979) | TCGA-AO-A128-01 | Breast | breast invasive carcinoma | Female | <65 | I/II | Chemotherapy | doxorubicin | SD | |
| ANGPTL1 | SNV | Missense_Mutation | c.714G>T | p.Glu238Asp | p.E238D | O95841 | protein_coding | tolerated(0.26) | probably_damaging(0.956) | TCGA-AR-A24H-01 | Breast | breast invasive carcinoma | Female | >=65 | I/II | Hormone Therapy | tamoxiphen | SD | |
| ANGPTL1 | SNV | Missense_Mutation | c.160N>G | p.Leu54Val | p.L54V | O95841 | protein_coding | tolerated(0.73) | benign(0.019) | TCGA-C8-A12Z-01 | Breast | breast invasive carcinoma | Female | <65 | I/II | Chemotherapy | 5-fluorouracil | CR | |
| ANGPTL1 | insertion | Nonsense_Mutation | novel | c.174_175insTGCTCATAATAAATGCTTATTCATTTTGCGATGTTATATATG | p.Gln58_Arg59insCysSerTerTerMetLeuIleHisPheAlaMetLeuTyrMet | p.Q58_R59insCS**MLIHFAMLYM | O95841 | protein_coding | TCGA-A8-A06X-01 | Breast | breast invasive carcinoma | Female | >=65 | I/II | Unknown | Unknown | SD | ||
| ANGPTL1 | SNV | Missense_Mutation | novel | c.751N>T | p.Pro251Ser | p.P251S | O95841 | protein_coding | tolerated(0.21) | benign(0.04) | TCGA-DS-A7WH-01 | Cervix | cervical & endocervical cancer | Female | <65 | I/II | Chemotherapy | cisplatin | CR |
| ANGPTL1 | SNV | Missense_Mutation | novel | c.1010A>C | p.Asn337Thr | p.N337T | O95841 | protein_coding | tolerated(1) | benign(0.01) | TCGA-EA-A3HU-01 | Cervix | cervical & endocervical cancer | Female | <65 | I/II | Unknown | Unknown | SD |
| ANGPTL1 | SNV | Missense_Mutation | rs371498898 | c.377N>C | p.Met126Thr | p.M126T | O95841 | protein_coding | deleterious(0) | possibly_damaging(0.901) | TCGA-5M-AAT6-01 | Colorectum | colon adenocarcinoma | Female | <65 | III/IV | Unknown | Unknown | PD |
| ANGPTL1 | SNV | Missense_Mutation | c.403N>G | p.Met135Val | p.M135V | O95841 | protein_coding | tolerated(0.07) | possibly_damaging(0.81) | TCGA-A6-6780-01 | Colorectum | colon adenocarcinoma | Male | >=65 | I/II | Unknown | Unknown | SD |
| Page: 1 2 3 4 5 6 |
Top |
Related drugs of malignant transformation related genes |
| Identification of chemicals and drugs interact with genes involved in malignant transfromation |
| (DGIdb 4.0) |
| Entrez ID | Symbol | Category | Interaction Types | Drug Claim Name | Drug Name | PMIDs |
| Page: 1 |

Copyright 2023-Present -The University of Texas Health Science Center at Houston |