
|
|||||
|
 | |
| |
| |
| |
| |
| |
|
Gene: ANGPT2 |
Gene summary for ANGPT2 |
| Gene information | Species | Human | Gene symbol | ANGPT2 | Gene ID | 285 |
| Gene name | angiopoietin 2 | |
| Gene Alias | AGPT2 | |
| Cytomap | 8p23.1 | |
| Gene Type | protein-coding | GO ID | GO:0000003 | UniProtAcc | O15123 |
Top |
Malignant transformation analysis |
| Identification of the aberrant gene expression in precancerous and cancerous lesions by comparing the gene expression of stem-like cells in diseased tissues with normal stem cells |
| Entrez ID | Symbol | Replicates | Species | Organ | Tissue | Adj P-value | Log2FC | Malignancy |
| 285 | ANGPT2 | HCC1 | Human | Liver | HCC | 8.34e-06 | 3.23e+00 | 0.5336 |
| 285 | ANGPT2 | HCC2 | Human | Liver | HCC | 3.52e-06 | 5.92e-01 | 0.5341 |
| 285 | ANGPT2 | HCC5 | Human | Liver | HCC | 2.73e-09 | 5.61e-01 | 0.4932 |
| 285 | ANGPT2 | Pt13.b | Human | Liver | HCC | 1.12e-10 | 2.85e-01 | 0.0251 |
| 285 | ANGPT2 | Pt14.b | Human | Liver | HCC | 3.15e-03 | 2.45e-01 | 0.018 |
| Page: 1 |
| Tissue | Expression Dynamics | Abbreviation |
| Liver | 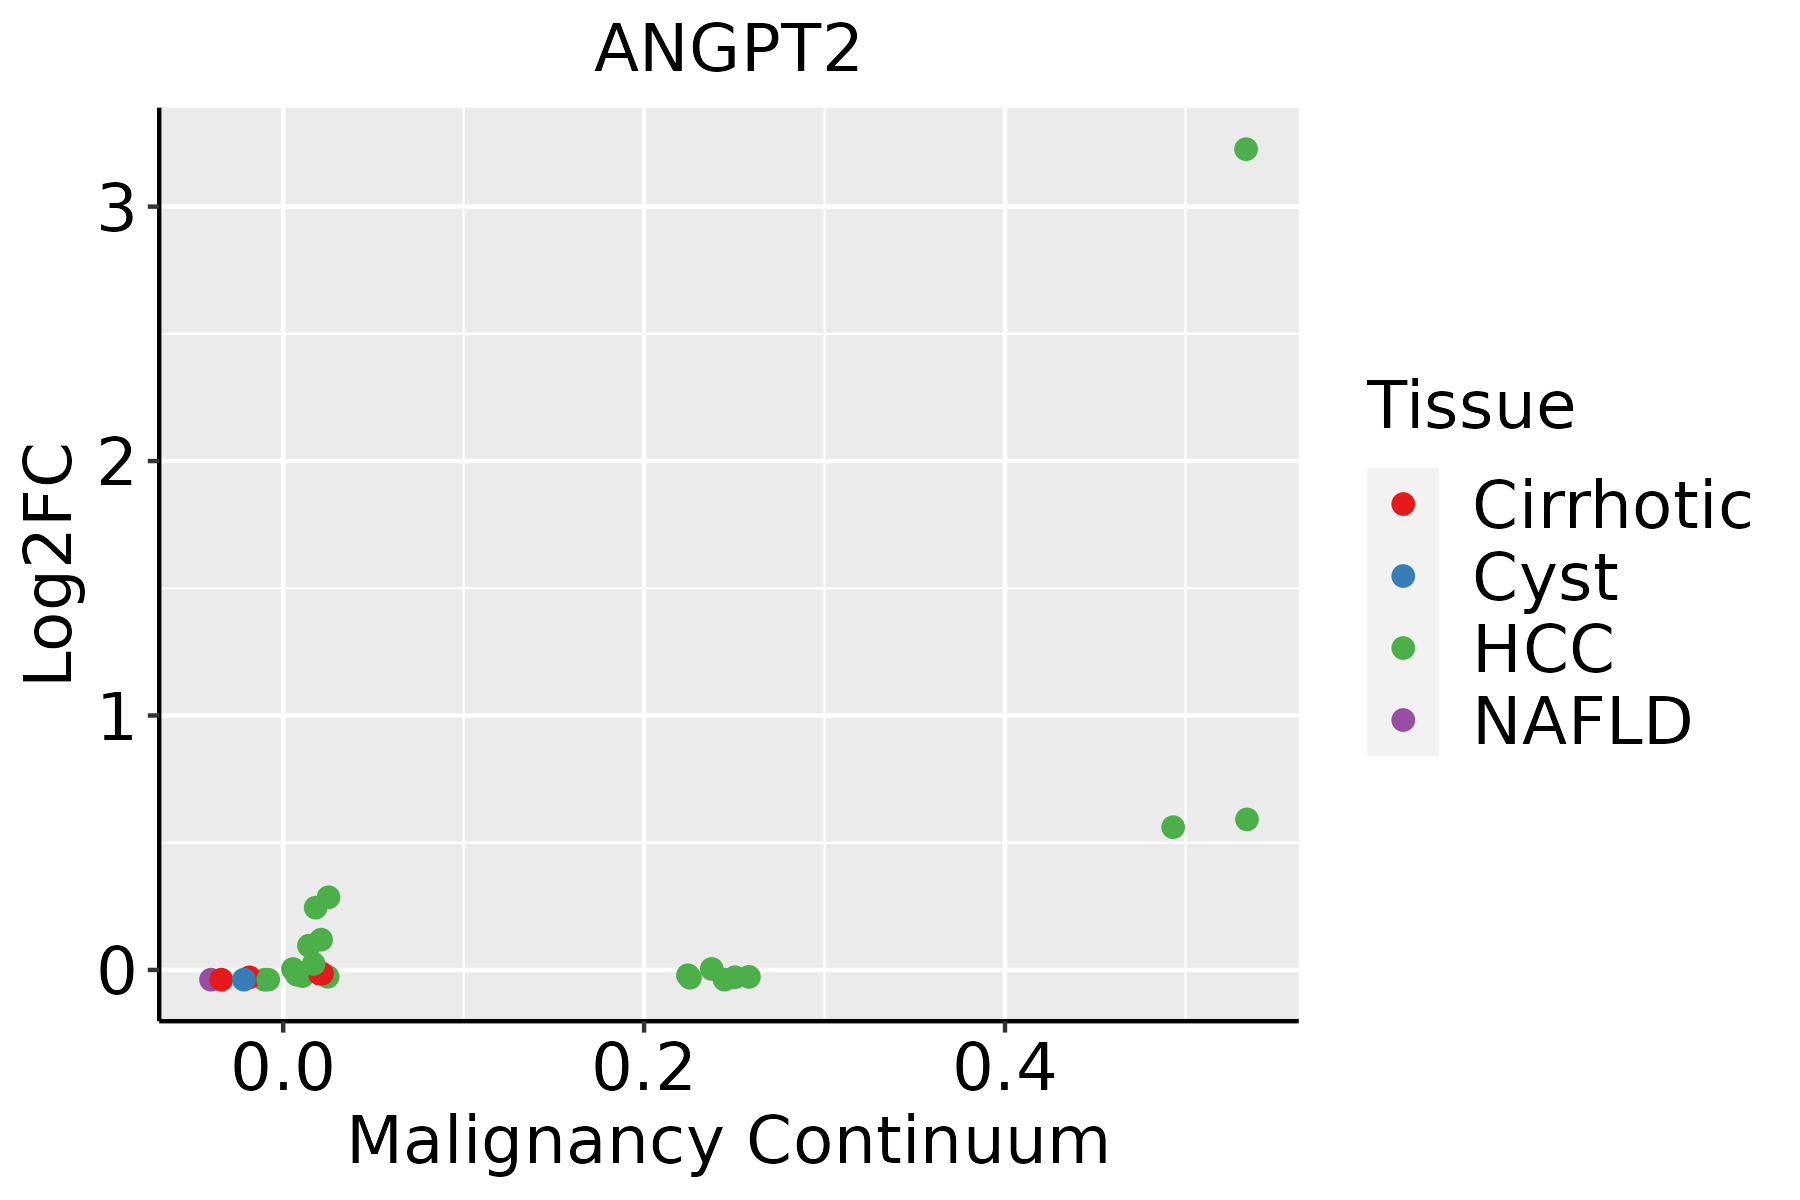 | HCC: Hepatocellular carcinoma |
| NAFLD: Non-alcoholic fatty liver disease |
| ∗log2FC in expression of this searched gene in stem-like cells from each diseased tissue sample relative to stem-like cells in normal samples in each tissue plotted against the malignancy continuum. Samples are colored based on if they are from different disease stage. |
Top |
Malignant transformation related pathway analysis |
| Find out the enriched GO biological processes and KEGG pathways involved in transition from healthy to precancer to cancer |
| Tissue | Disease Stage | Enriched GO biological Processes |
| Colorectum | AD |  |
| Colorectum | SER |  |
| Colorectum | MSS |  |
| Colorectum | MSI-H |  |
| Colorectum | FAP |  |
| ∗Top 15 enriched GO BP terms are showed in the bar plot of each disease state in each tissue. Each row represents a significant GO biological process which is colored according to the -log10(p.adjust). |
| Page: 1 2 3 4 5 6 7 8 9 |
| GO ID | Tissue | Disease Stage | Description | Gene Ratio | Bg Ratio | pvalue | p.adjust | Count |
| GO:000974322 | Liver | HCC | response to carbohydrate | 149/7958 | 253/18723 | 9.55e-08 | 1.89e-06 | 149 |
| GO:003110021 | Liver | HCC | animal organ regeneration | 54/7958 | 76/18723 | 4.31e-07 | 7.22e-06 | 54 |
| GO:000166612 | Liver | HCC | response to hypoxia | 172/7958 | 307/18723 | 1.06e-06 | 1.59e-05 | 172 |
| GO:003629312 | Liver | HCC | response to decreased oxygen levels | 179/7958 | 322/18723 | 1.29e-06 | 1.87e-05 | 179 |
| GO:003428422 | Liver | HCC | response to monosaccharide | 131/7958 | 225/18723 | 1.32e-06 | 1.91e-05 | 131 |
| GO:007048212 | Liver | HCC | response to oxygen levels | 191/7958 | 347/18723 | 1.42e-06 | 2.03e-05 | 191 |
| GO:000974622 | Liver | HCC | response to hexose | 126/7958 | 219/18723 | 4.81e-06 | 6.06e-05 | 126 |
| GO:000974912 | Liver | HCC | response to glucose | 121/7958 | 212/18723 | 1.24e-05 | 1.39e-04 | 121 |
| GO:001081022 | Liver | HCC | regulation of cell-substrate adhesion | 123/7958 | 221/18723 | 5.15e-05 | 4.90e-04 | 123 |
| GO:003158922 | Liver | HCC | cell-substrate adhesion | 188/7958 | 363/18723 | 2.00e-04 | 1.55e-03 | 188 |
| GO:00310992 | Liver | HCC | regeneration | 107/7958 | 198/18723 | 6.67e-04 | 4.12e-03 | 107 |
| GO:00016553 | Liver | HCC | urogenital system development | 170/7958 | 338/18723 | 2.15e-03 | 1.08e-02 | 170 |
| GO:00096124 | Liver | HCC | response to mechanical stimulus | 113/7958 | 216/18723 | 2.20e-03 | 1.10e-02 | 113 |
| GO:00148231 | Liver | HCC | response to activity | 45/7958 | 76/18723 | 2.42e-03 | 1.18e-02 | 45 |
| GO:00093146 | Liver | HCC | response to radiation | 223/7958 | 456/18723 | 3.08e-03 | 1.43e-02 | 223 |
| GO:00018222 | Liver | HCC | kidney development | 148/7958 | 293/18723 | 3.25e-03 | 1.49e-02 | 148 |
| GO:00720012 | Liver | HCC | renal system development | 152/7958 | 302/18723 | 3.45e-03 | 1.56e-02 | 152 |
| GO:00601351 | Liver | HCC | maternal process involved in female pregnancy | 37/7958 | 62/18723 | 4.73e-03 | 2.02e-02 | 37 |
| GO:00075651 | Liver | HCC | female pregnancy | 99/7958 | 193/18723 | 8.24e-03 | 3.23e-02 | 99 |
| GO:000166721 | Liver | HCC | ameboidal-type cell migration | 226/7958 | 475/18723 | 1.35e-02 | 4.81e-02 | 226 |
| Page: 1 |
| Pathway ID | Tissue | Disease Stage | Description | Gene Ratio | Bg Ratio | pvalue | p.adjust | qvalue | Count |
| hsa0406622 | Liver | HCC | HIF-1 signaling pathway | 70/4020 | 109/8465 | 2.96e-04 | 1.36e-03 | 7.57e-04 | 70 |
| hsa0516721 | Liver | HCC | Kaposi sarcoma-associated herpesvirus infection | 111/4020 | 194/8465 | 3.78e-03 | 1.16e-02 | 6.45e-03 | 111 |
| hsa0406632 | Liver | HCC | HIF-1 signaling pathway | 70/4020 | 109/8465 | 2.96e-04 | 1.36e-03 | 7.57e-04 | 70 |
| hsa0516731 | Liver | HCC | Kaposi sarcoma-associated herpesvirus infection | 111/4020 | 194/8465 | 3.78e-03 | 1.16e-02 | 6.45e-03 | 111 |
| Page: 1 |
Top |
Cell-cell communication analysis |
| Identification of potential cell-cell interactions between two cell types and their ligand-receptor pairs for different disease states |
| Ligand | Receptor | LRpair | Pathway | Tissue | Disease Stage |
| ANGPT2 | ITGA5_ITGB1 | ANGPT2_ITGA5_ITGB1 | ANGPT | Breast | ADJ |
| ANGPT2 | ITGA5_ITGB1 | ANGPT2_ITGA5_ITGB1 | ANGPT | Breast | DCIS |
| ANGPT2 | ITGA5_ITGB1 | ANGPT2_ITGA5_ITGB1 | ANGPT | Breast | Healthy |
| ANGPT2 | ITGA5_ITGB1 | ANGPT2_ITGA5_ITGB1 | ANGPT | Breast | IDC |
| ANGPT2 | ITGA5_ITGB1 | ANGPT2_ITGA5_ITGB1 | ANGPT | Breast | Precancer |
| ANGPT2 | TEK | ANGPT2_TEK | ANGPT | Cervix | CC |
| ANGPT2 | ITGA5_ITGB1 | ANGPT2_ITGA5_ITGB1 | ANGPT | Cervix | CC |
| ANGPT2 | TEK | ANGPT2_TEK | ANGPT | CRC | ADJ |
| ANGPT2 | ITGA5_ITGB1 | ANGPT2_ITGA5_ITGB1 | ANGPT | CRC | ADJ |
| ANGPT2 | ITGA5_ITGB1 | ANGPT2_ITGA5_ITGB1 | ANGPT | CRC | MSI-H |
| ANGPT2 | TEK | ANGPT2_TEK | ANGPT | Endometrium | ADJ |
| ANGPT2 | ITGA5_ITGB1 | ANGPT2_ITGA5_ITGB1 | ANGPT | Endometrium | ADJ |
| ANGPT2 | TEK | ANGPT2_TEK | ANGPT | Endometrium | AEH |
| ANGPT2 | ITGA5_ITGB1 | ANGPT2_ITGA5_ITGB1 | ANGPT | Endometrium | AEH |
| ANGPT2 | TEK | ANGPT2_TEK | ANGPT | Endometrium | EEC |
| ANGPT2 | ITGA5_ITGB1 | ANGPT2_ITGA5_ITGB1 | ANGPT | Endometrium | EEC |
| ANGPT2 | TEK | ANGPT2_TEK | ANGPT | Endometrium | Healthy |
| ANGPT2 | ITGA5_ITGB1 | ANGPT2_ITGA5_ITGB1 | ANGPT | Endometrium | Healthy |
| ANGPT2 | TEK | ANGPT2_TEK | ANGPT | Esophagus | ESCC |
| ANGPT2 | ITGA5_ITGB1 | ANGPT2_ITGA5_ITGB1 | ANGPT | Esophagus | ESCC |
| Page: 1 2 3 |
Top |
Single-cell gene regulatory network inference analysis |
| Find out the significant the regulons (TFs) and the target genes of each regulon across cell types for different disease states |
| TF | Cell Type | Tissue | Disease Stage | Target Gene | RSS | Regulon Activity |
| ∗The dot plots of a searched regulon are shown for all cell subpopulations in each disease state of each tissue based on the regulon specific score inferred using pySCENIC and by calculating the average expression. |
| Page: 1 |
Top |
Somatic mutation of malignant transformation related genes |
| Annotation of somatic variants for genes involved in malignant transformation |
| Hugo Symbol | Variant Class | Variant Classification | dbSNP RS | HGVSc | HGVSp | HGVSp Short | SWISSPROT | BIOTYPE | SIFT | PolyPhen | Tumor Sample Barcode | Tissue | Histology | Sex | Age | Stage | Therapy Types | Drugs | Outcome |
| ANGPT2 | SNV | Missense_Mutation | c.731N>C | p.Leu244Pro | p.L244P | O15123 | protein_coding | deleterious(0.01) | probably_damaging(0.993) | TCGA-D8-A1XQ-01 | Breast | breast invasive carcinoma | Female | >=65 | I/II | Unknown | Unknown | SD | |
| ANGPT2 | insertion | Frame_Shift_Ins | novel | c.807_808insATTCTAACCTCATCTAACGCAGTCTGGAA | p.Asp270IlefsTer41 | p.D270Ifs*41 | O15123 | protein_coding | TCGA-A2-A0CM-01 | Breast | breast invasive carcinoma | Female | <65 | I/II | Chemotherapy | adriamycin | PD | ||
| ANGPT2 | SNV | Missense_Mutation | novel | c.116G>T | p.Gly39Val | p.G39V | O15123 | protein_coding | deleterious(0) | probably_damaging(0.998) | TCGA-MA-AA42-01 | Cervix | cervical & endocervical cancer | Female | >=65 | I/II | Unknown | Unknown | SD |
| ANGPT2 | SNV | Missense_Mutation | rs142616217 | c.67N>T | p.Arg23Trp | p.R23W | O15123 | protein_coding | deleterious(0.01) | possibly_damaging(0.696) | TCGA-A6-6654-01 | Colorectum | colon adenocarcinoma | Female | >=65 | III/IV | Chemotherapy | oxaliplatin | SD |
| ANGPT2 | SNV | Missense_Mutation | c.205N>A | p.Ala69Thr | p.A69T | O15123 | protein_coding | tolerated(0.14) | benign(0.044) | TCGA-AA-3715-01 | Colorectum | colon adenocarcinoma | Male | >=65 | I/II | Unknown | Unknown | PD | |
| ANGPT2 | SNV | Missense_Mutation | c.490T>C | p.Ser164Pro | p.S164P | O15123 | protein_coding | deleterious(0) | probably_damaging(0.99) | TCGA-AA-3864-01 | Colorectum | colon adenocarcinoma | Male | >=65 | I/II | Unknown | Unknown | SD | |
| ANGPT2 | SNV | Missense_Mutation | novel | c.971T>A | p.Ile324Asn | p.I324N | O15123 | protein_coding | deleterious(0) | possibly_damaging(0.513) | TCGA-AA-3966-01 | Colorectum | colon adenocarcinoma | Female | >=65 | I/II | Unknown | Unknown | SD |
| ANGPT2 | SNV | Missense_Mutation | rs760458544 | c.1102C>T | p.Arg368Cys | p.R368C | O15123 | protein_coding | tolerated(0.05) | benign(0.18) | TCGA-AA-A01K-01 | Colorectum | colon adenocarcinoma | Female | >=65 | III/IV | Chemotherapy | folinic | CR |
| ANGPT2 | SNV | Missense_Mutation | c.94N>G | p.Lys32Glu | p.K32E | O15123 | protein_coding | deleterious(0.02) | benign(0.003) | TCGA-AA-A02R-01 | Colorectum | colon adenocarcinoma | Female | >=65 | I/II | Unknown | Unknown | PD | |
| ANGPT2 | SNV | Missense_Mutation | c.269N>G | p.Asn90Ser | p.N90S | O15123 | protein_coding | tolerated(0.22) | benign(0.125) | TCGA-AD-A5EJ-01 | Colorectum | colon adenocarcinoma | Female | >=65 | I/II | Unknown | Unknown | SD |
| Page: 1 2 3 4 5 6 |
Top |
Related drugs of malignant transformation related genes |
| Identification of chemicals and drugs interact with genes involved in malignant transfromation |
| (DGIdb 4.0) |
| Entrez ID | Symbol | Category | Interaction Types | Drug Claim Name | Drug Name | PMIDs |
| 285 | ANGPT2 | KINASE, FIBRINOGEN, DRUGGABLE GENOME | CVX-060 | |||
| 285 | ANGPT2 | KINASE, FIBRINOGEN, DRUGGABLE GENOME | REGN-910 | NESVACUMAB | ||
| 285 | ANGPT2 | KINASE, FIBRINOGEN, DRUGGABLE GENOME | AMG 386 | |||
| 285 | ANGPT2 | KINASE, FIBRINOGEN, DRUGGABLE GENOME | inhibitor | CHEMBL2108678 | NESVACUMAB | |
| 285 | ANGPT2 | KINASE, FIBRINOGEN, DRUGGABLE GENOME | REGN910 | NESVACUMAB | ||
| 285 | ANGPT2 | KINASE, FIBRINOGEN, DRUGGABLE GENOME | LY3127804 | |||
| 285 | ANGPT2 | KINASE, FIBRINOGEN, DRUGGABLE GENOME | MEDI-3617 | MEDI-3617 | ||
| 285 | ANGPT2 | KINASE, FIBRINOGEN, DRUGGABLE GENOME | RG7221 | |||
| 285 | ANGPT2 | KINASE, FIBRINOGEN, DRUGGABLE GENOME | RIBAVIRIN | RIBAVIRIN | 16104024 | |
| 285 | ANGPT2 | KINASE, FIBRINOGEN, DRUGGABLE GENOME | inhibitor | CHEMBL2108568 | TREBANANIB |
| Page: 1 2 |

Copyright 2023-Present -The University of Texas Health Science Center at Houston |