
|
|||||
|
 | |
| |
| |
| |
| |
| |
|
Gene: ANGPT1 |
Gene summary for ANGPT1 |
| Gene information | Species | Human | Gene symbol | ANGPT1 | Gene ID | 284 |
| Gene name | angiopoietin 1 | |
| Gene Alias | AGP1 | |
| Cytomap | 8q23.1 | |
| Gene Type | protein-coding | GO ID | GO:0000165 | UniProtAcc | Q15389 |
Top |
Malignant transformation analysis |
| Identification of the aberrant gene expression in precancerous and cancerous lesions by comparing the gene expression of stem-like cells in diseased tissues with normal stem cells |
| Entrez ID | Symbol | Replicates | Species | Organ | Tissue | Adj P-value | Log2FC | Malignancy |
| 284 | ANGPT1 | HCC2 | Human | Liver | HCC | 4.04e-02 | 7.08e-01 | 0.5341 |
| 284 | ANGPT1 | Pt13.b | Human | Liver | HCC | 2.27e-02 | 1.42e-01 | 0.0251 |
| 284 | ANGPT1 | S014 | Human | Liver | HCC | 3.32e-17 | 5.15e-01 | 0.2254 |
| 284 | ANGPT1 | S015 | Human | Liver | HCC | 1.65e-13 | 5.07e-01 | 0.2375 |
| 284 | ANGPT1 | S016 | Human | Liver | HCC | 4.67e-23 | 6.71e-01 | 0.2243 |
| 284 | ANGPT1 | GSM5252137_BPH556PrGA2_Fcol | Human | Prostate | BPH | 3.14e-03 | 1.91e-01 | -0.23 |
| 284 | ANGPT1 | 052095_1628-all-cells | Human | Prostate | BPH | 7.12e-07 | 2.41e-01 | 0.1032 |
| 284 | ANGPT1 | Dong_P3 | Human | Prostate | Tumor | 3.49e-10 | 1.95e-01 | 0.0278 |
| 284 | ANGPT1 | GSM5353221_PA_PB2A_Pool_1_3_S25_L001 | Human | Prostate | Tumor | 8.16e-06 | 5.29e-01 | 0.1633 |
| 284 | ANGPT1 | GSM5353222_PA_PB2B_Pool_1_3_S52_L002 | Human | Prostate | Tumor | 2.71e-06 | 4.39e-01 | 0.1608 |
| 284 | ANGPT1 | GSM5353223_PA_PB2B_Pool_2_S26_L001 | Human | Prostate | Tumor | 5.83e-05 | 4.67e-01 | 0.1604 |
| 284 | ANGPT1 | GSM5353236_PA_PR5251_T1_S7_L001 | Human | Prostate | Tumor | 2.31e-02 | 5.19e-01 | 0.1608 |
| Page: 1 |
| Tissue | Expression Dynamics | Abbreviation |
| Liver |  | HCC: Hepatocellular carcinoma |
| NAFLD: Non-alcoholic fatty liver disease | ||
| Prostate | 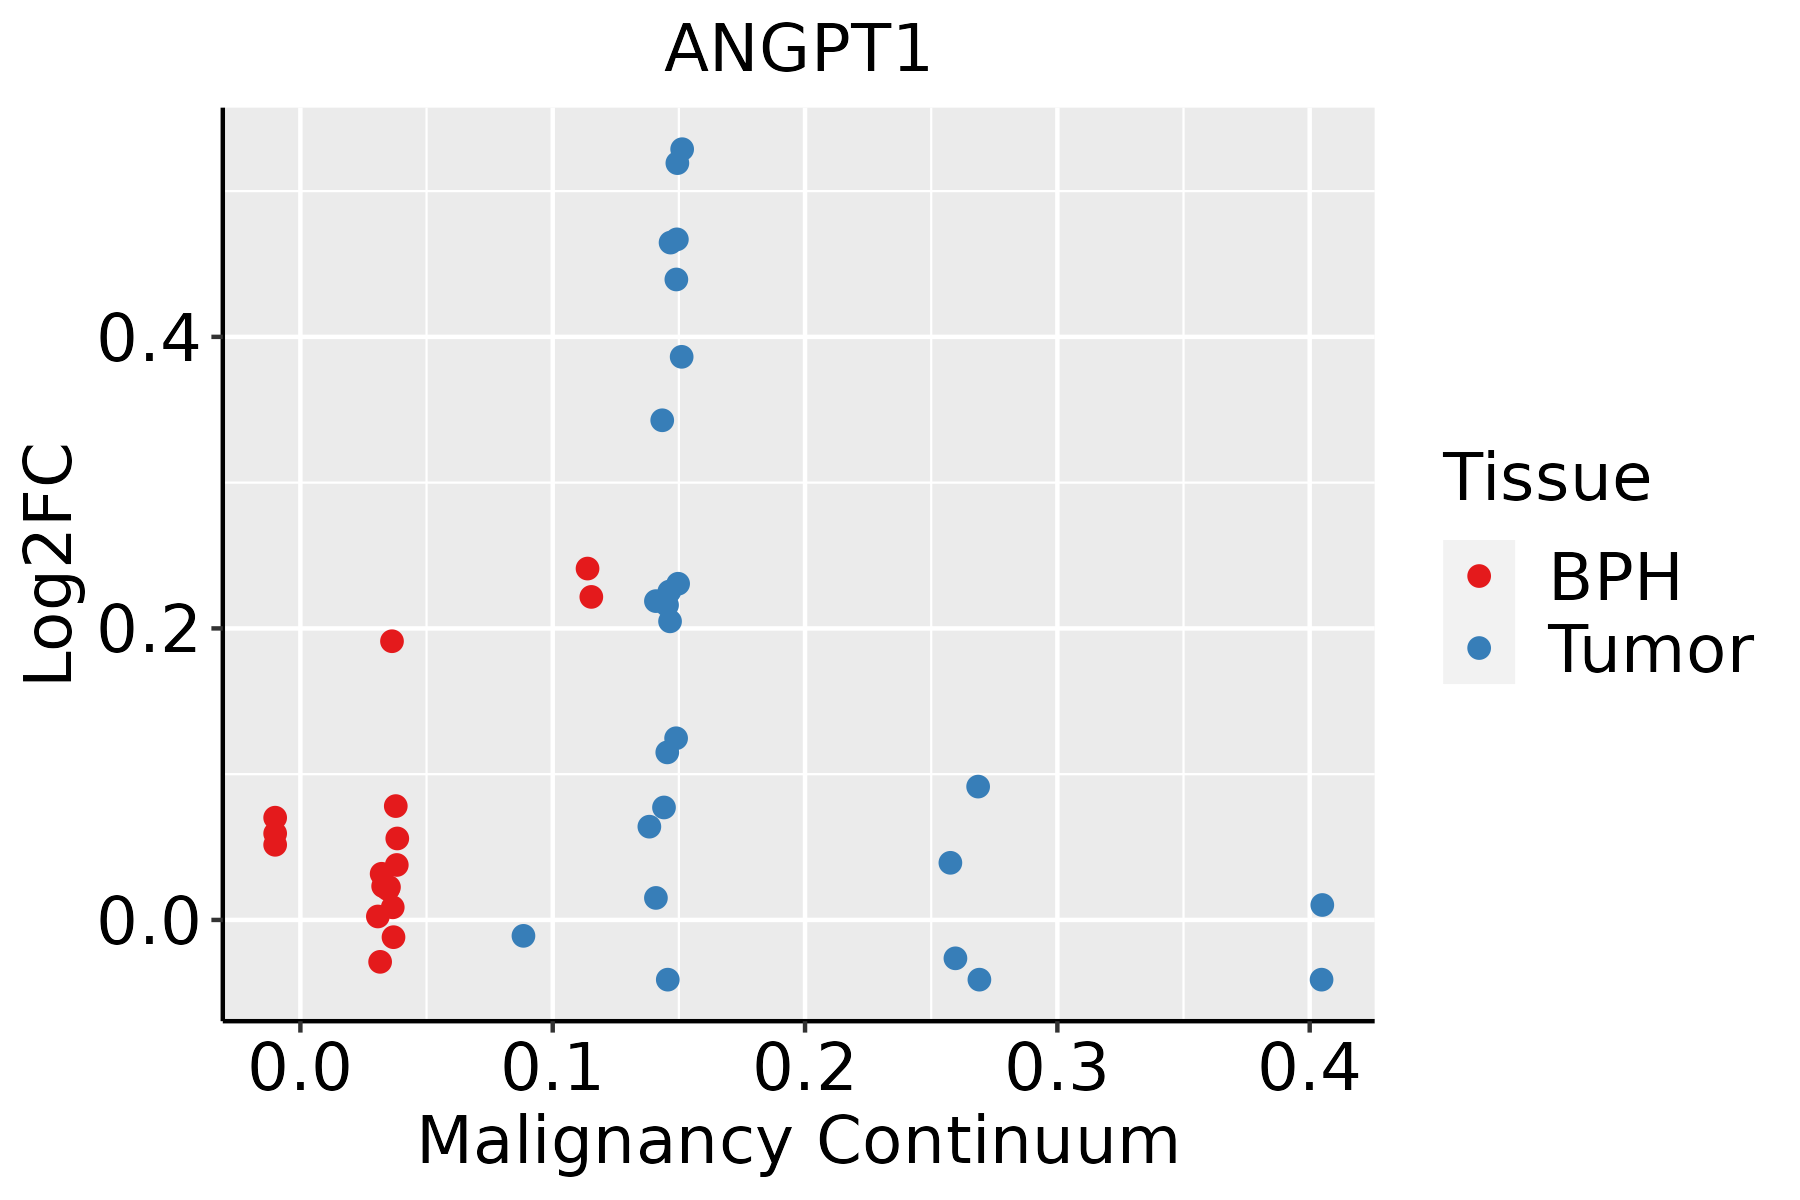 | BPH: Benign Prostatic Hyperplasia |
| ∗log2FC in expression of this searched gene in stem-like cells from each diseased tissue sample relative to stem-like cells in normal samples in each tissue plotted against the malignancy continuum. Samples are colored based on if they are from different disease stage. |
Top |
Malignant transformation related pathway analysis |
| Find out the enriched GO biological processes and KEGG pathways involved in transition from healthy to precancer to cancer |
| Tissue | Disease Stage | Enriched GO biological Processes |
| Colorectum | AD |  |
| Colorectum | SER |  |
| Colorectum | MSS |  |
| Colorectum | MSI-H |  |
| Colorectum | FAP |  |
| ∗Top 15 enriched GO BP terms are showed in the bar plot of each disease state in each tissue. Each row represents a significant GO biological process which is colored according to the -log10(p.adjust). |
| Page: 1 2 3 4 5 6 7 8 9 |
| GO ID | Tissue | Disease Stage | Description | Gene Ratio | Bg Ratio | pvalue | p.adjust | Count |
| GO:007259422 | Liver | HCC | establishment of protein localization to organelle | 299/7958 | 422/18723 | 1.06e-32 | 6.10e-30 | 299 |
| GO:003238621 | Liver | HCC | regulation of intracellular transport | 231/7958 | 337/18723 | 1.99e-22 | 3.40e-20 | 231 |
| GO:000691322 | Liver | HCC | nucleocytoplasmic transport | 208/7958 | 301/18723 | 5.51e-21 | 8.12e-19 | 208 |
| GO:005116922 | Liver | HCC | nuclear transport | 208/7958 | 301/18723 | 5.51e-21 | 8.12e-19 | 208 |
| GO:003315721 | Liver | HCC | regulation of intracellular protein transport | 165/7958 | 229/18723 | 8.37e-20 | 1.15e-17 | 165 |
| GO:003450421 | Liver | HCC | protein localization to nucleus | 194/7958 | 290/18723 | 2.84e-17 | 2.85e-15 | 194 |
| GO:190332022 | Liver | HCC | regulation of protein modification by small protein conjugation or removal | 167/7958 | 242/18723 | 4.99e-17 | 4.72e-15 | 167 |
| GO:005109822 | Liver | HCC | regulation of binding | 225/7958 | 363/18723 | 3.78e-14 | 2.37e-12 | 225 |
| GO:000679021 | Liver | HCC | sulfur compound metabolic process | 212/7958 | 339/18723 | 5.60e-14 | 3.39e-12 | 212 |
| GO:001703811 | Liver | HCC | protein import | 140/7958 | 206/18723 | 1.12e-13 | 6.46e-12 | 140 |
| GO:003139622 | Liver | HCC | regulation of protein ubiquitination | 142/7958 | 210/18723 | 1.39e-13 | 7.81e-12 | 142 |
| GO:004682221 | Liver | HCC | regulation of nucleocytoplasmic transport | 81/7958 | 106/18723 | 1.11e-12 | 5.52e-11 | 81 |
| GO:001056322 | Liver | HCC | negative regulation of phosphorus metabolic process | 259/7958 | 442/18723 | 4.29e-12 | 1.92e-10 | 259 |
| GO:004593622 | Liver | HCC | negative regulation of phosphate metabolic process | 258/7958 | 441/18723 | 6.00e-12 | 2.60e-10 | 258 |
| GO:004339322 | Liver | HCC | regulation of protein binding | 129/7958 | 196/18723 | 3.27e-11 | 1.26e-09 | 129 |
| GO:004232622 | Liver | HCC | negative regulation of phosphorylation | 227/7958 | 385/18723 | 3.98e-11 | 1.52e-09 | 227 |
| GO:190018012 | Liver | HCC | regulation of protein localization to nucleus | 95/7958 | 136/18723 | 9.26e-11 | 3.26e-09 | 95 |
| GO:19033221 | Liver | HCC | positive regulation of protein modification by small protein conjugation or removal | 94/7958 | 138/18723 | 9.87e-10 | 3.01e-08 | 94 |
| GO:000193322 | Liver | HCC | negative regulation of protein phosphorylation | 196/7958 | 342/18723 | 1.95e-08 | 4.63e-07 | 196 |
| GO:005117011 | Liver | HCC | import into nucleus | 102/7958 | 159/18723 | 2.78e-08 | 6.39e-07 | 102 |
| Page: 1 2 3 4 5 6 7 8 9 10 11 12 |
| Pathway ID | Tissue | Disease Stage | Description | Gene Ratio | Bg Ratio | pvalue | p.adjust | qvalue | Count |
| hsa041515 | Prostate | BPH | PI3K-Akt signaling pathway | 104/1718 | 354/8465 | 2.07e-05 | 1.55e-04 | 9.61e-05 | 104 |
| hsa0406625 | Prostate | BPH | HIF-1 signaling pathway | 40/1718 | 109/8465 | 4.97e-05 | 3.35e-04 | 2.07e-04 | 40 |
| hsa0401010 | Prostate | BPH | MAPK signaling pathway | 87/1718 | 302/8465 | 2.05e-04 | 1.13e-03 | 6.98e-04 | 87 |
| hsa0401516 | Prostate | BPH | Rap1 signaling pathway | 61/1718 | 210/8465 | 1.40e-03 | 5.85e-03 | 3.62e-03 | 61 |
| hsa0415112 | Prostate | BPH | PI3K-Akt signaling pathway | 104/1718 | 354/8465 | 2.07e-05 | 1.55e-04 | 9.61e-05 | 104 |
| hsa04066111 | Prostate | BPH | HIF-1 signaling pathway | 40/1718 | 109/8465 | 4.97e-05 | 3.35e-04 | 2.07e-04 | 40 |
| hsa0401013 | Prostate | BPH | MAPK signaling pathway | 87/1718 | 302/8465 | 2.05e-04 | 1.13e-03 | 6.98e-04 | 87 |
| hsa0401517 | Prostate | BPH | Rap1 signaling pathway | 61/1718 | 210/8465 | 1.40e-03 | 5.85e-03 | 3.62e-03 | 61 |
| hsa0415122 | Prostate | Tumor | PI3K-Akt signaling pathway | 105/1791 | 354/8465 | 7.42e-05 | 5.30e-04 | 3.28e-04 | 105 |
| hsa0401022 | Prostate | Tumor | MAPK signaling pathway | 87/1791 | 302/8465 | 8.46e-04 | 3.94e-03 | 2.45e-03 | 87 |
| hsa0401523 | Prostate | Tumor | Rap1 signaling pathway | 60/1791 | 210/8465 | 6.16e-03 | 2.12e-02 | 1.32e-02 | 60 |
| hsa0415132 | Prostate | Tumor | PI3K-Akt signaling pathway | 105/1791 | 354/8465 | 7.42e-05 | 5.30e-04 | 3.28e-04 | 105 |
| hsa0401032 | Prostate | Tumor | MAPK signaling pathway | 87/1791 | 302/8465 | 8.46e-04 | 3.94e-03 | 2.45e-03 | 87 |
| hsa0401533 | Prostate | Tumor | Rap1 signaling pathway | 60/1791 | 210/8465 | 6.16e-03 | 2.12e-02 | 1.32e-02 | 60 |
| Page: 1 |
Top |
Cell-cell communication analysis |
| Identification of potential cell-cell interactions between two cell types and their ligand-receptor pairs for different disease states |
| Ligand | Receptor | LRpair | Pathway | Tissue | Disease Stage |
| ANGPT1 | TEK | ANGPT1_TEK | ANGPT | Cervix | ADJ |
| ANGPT1 | TEK | ANGPT1_TEK | ANGPT | CRC | ADJ |
| ANGPT1 | TEK | ANGPT1_TEK | ANGPT | Endometrium | ADJ |
| ANGPT1 | TEK | ANGPT1_TEK | ANGPT | Endometrium | AEH |
| ANGPT1 | TEK | ANGPT1_TEK | ANGPT | Esophagus | ESCC |
| ANGPT1 | TEK | ANGPT1_TEK | ANGPT | GC | ADJ |
| ANGPT1 | TEK | ANGPT1_TEK | ANGPT | GC | GC |
| ANGPT1 | TEK | ANGPT1_TEK | ANGPT | HNSCC | OSCC |
| ANGPT1 | TEK | ANGPT1_TEK | ANGPT | HNSCC | Precancer |
| ANGPT1 | TEK | ANGPT1_TEK | ANGPT | Liver | HCC |
| ANGPT1 | TEK | ANGPT1_TEK | ANGPT | Liver | Healthy |
| ANGPT1 | TEK | ANGPT1_TEK | ANGPT | Liver | Precancer |
| ANGPT1 | TEK | ANGPT1_TEK | ANGPT | Lung | AAH |
| ANGPT1 | TEK | ANGPT1_TEK | ANGPT | Lung | ADJ |
| ANGPT1 | TEK | ANGPT1_TEK | ANGPT | Lung | AIS |
| ANGPT1 | TEK | ANGPT1_TEK | ANGPT | Lung | IAC |
| ANGPT1 | TEK | ANGPT1_TEK | ANGPT | Lung | MIAC |
| ANGPT1 | TEK | ANGPT1_TEK | ANGPT | Lung | Precancer |
| ANGPT1 | TEK | ANGPT1_TEK | ANGPT | Prostate | ADJ |
| ANGPT1 | TEK | ANGPT1_TEK | ANGPT | Skin | cSCC |
| Page: 1 |
Top |
Single-cell gene regulatory network inference analysis |
| Find out the significant the regulons (TFs) and the target genes of each regulon across cell types for different disease states |
| TF | Cell Type | Tissue | Disease Stage | Target Gene | RSS | Regulon Activity |
| ∗The dot plots of a searched regulon are shown for all cell subpopulations in each disease state of each tissue based on the regulon specific score inferred using pySCENIC and by calculating the average expression. |
| Page: 1 |
Top |
Somatic mutation of malignant transformation related genes |
| Annotation of somatic variants for genes involved in malignant transformation |
| Hugo Symbol | Variant Class | Variant Classification | dbSNP RS | HGVSc | HGVSp | HGVSp Short | SWISSPROT | BIOTYPE | SIFT | PolyPhen | Tumor Sample Barcode | Tissue | Histology | Sex | Age | Stage | Therapy Types | Drugs | Outcome |
| ANGPT1 | SNV | Missense_Mutation | c.1040G>T | p.Gly347Val | p.G347V | Q15389 | protein_coding | deleterious(0.01) | probably_damaging(0.964) | TCGA-A2-A0YC-01 | Breast | breast invasive carcinoma | Female | <65 | I/II | Hormone Therapy | arimidex | PD | |
| ANGPT1 | SNV | Missense_Mutation | c.409N>G | p.Gln137Glu | p.Q137E | Q15389 | protein_coding | deleterious(0.04) | probably_damaging(0.935) | TCGA-A8-A09N-01 | Breast | breast invasive carcinoma | Female | <65 | III/IV | Unknown | Unknown | SD | |
| ANGPT1 | SNV | Missense_Mutation | c.64N>G | p.Gln22Glu | p.Q22E | Q15389 | protein_coding | tolerated(0.17) | benign(0.059) | TCGA-AC-A23H-01 | Breast | breast invasive carcinoma | Female | >=65 | I/II | Unknown | Unknown | PD | |
| ANGPT1 | SNV | Missense_Mutation | c.797N>G | p.Thr266Ser | p.T266S | Q15389 | protein_coding | tolerated(1) | benign(0) | TCGA-AO-A128-01 | Breast | breast invasive carcinoma | Female | <65 | I/II | Chemotherapy | doxorubicin | SD | |
| ANGPT1 | SNV | Missense_Mutation | c.351N>C | p.Gln117His | p.Q117H | Q15389 | protein_coding | tolerated(0.07) | benign(0.087) | TCGA-C8-A1HM-01 | Breast | breast invasive carcinoma | Female | >=65 | I/II | Chemotherapy | doxorubicin | CR | |
| ANGPT1 | SNV | Missense_Mutation | c.790N>G | p.Leu264Val | p.L264V | Q15389 | protein_coding | tolerated(0.19) | benign(0.015) | TCGA-E2-A14R-01 | Breast | breast invasive carcinoma | Female | <65 | I/II | Chemotherapy | doxorubicin | PD | |
| ANGPT1 | SNV | Missense_Mutation | c.532N>G | p.Leu178Val | p.L178V | Q15389 | protein_coding | deleterious(0.01) | benign(0.213) | TCGA-E9-A1R4-01 | Breast | breast invasive carcinoma | Female | >=65 | I/II | Chemotherapy | 5-fluorouracil | SD | |
| ANGPT1 | SNV | Missense_Mutation | novel | c.910A>G | p.Ile304Val | p.I304V | Q15389 | protein_coding | tolerated(0.86) | benign(0.05) | TCGA-OL-A5S0-01 | Breast | breast invasive carcinoma | Female | >=65 | I/II | Chemotherapy | taxol | CR |
| ANGPT1 | SNV | Missense_Mutation | c.234N>G | p.Phe78Leu | p.F78L | Q15389 | protein_coding | tolerated(1) | benign(0.001) | TCGA-IR-A3LA-01 | Cervix | cervical & endocervical cancer | Female | <65 | I/II | Chemotherapy | cisplatin | CR | |
| ANGPT1 | SNV | Missense_Mutation | novel | c.1284N>C | p.Lys428Asn | p.K428N | Q15389 | protein_coding | deleterious(0) | probably_damaging(0.996) | TCGA-MA-AA3X-01 | Cervix | cervical & endocervical cancer | Female | <65 | III/IV | Chemotherapy | cisplatin | CR |
| Page: 1 2 3 4 5 6 7 8 9 |
Top |
Related drugs of malignant transformation related genes |
| Identification of chemicals and drugs interact with genes involved in malignant transfromation |
| (DGIdb 4.0) |
| Entrez ID | Symbol | Category | Interaction Types | Drug Claim Name | Drug Name | PMIDs |
| 284 | ANGPT1 | KINASE, DRUGGABLE GENOME, FIBRINOGEN | TREBANINIB | |||
| 284 | ANGPT1 | KINASE, DRUGGABLE GENOME, FIBRINOGEN | inhibitor | CHEMBL2108568 | TREBANANIB | |
| 284 | ANGPT1 | KINASE, DRUGGABLE GENOME, FIBRINOGEN | AMG 386 | |||
| 284 | ANGPT1 | KINASE, DRUGGABLE GENOME, FIBRINOGEN | AMG 780 |
| Page: 1 |

Copyright 2023-Present -The University of Texas Health Science Center at Houston |