
|
|||||
|
 | |
| |
| |
| |
| |
| |
|
Gene: ANAPC2 |
Gene summary for ANAPC2 |
| Gene information | Species | Human | Gene symbol | ANAPC2 | Gene ID | 29882 |
| Gene name | anaphase promoting complex subunit 2 | |
| Gene Alias | APC2 | |
| Cytomap | 9q34.3 | |
| Gene Type | protein-coding | GO ID | GO:0000209 | UniProtAcc | Q9UJX6 |
Top |
Malignant transformation analysis |
| Identification of the aberrant gene expression in precancerous and cancerous lesions by comparing the gene expression of stem-like cells in diseased tissues with normal stem cells |
| Entrez ID | Symbol | Replicates | Species | Organ | Tissue | Adj P-value | Log2FC | Malignancy |
| 29882 | ANAPC2 | LZE7T | Human | Esophagus | ESCC | 3.27e-08 | 3.83e-01 | 0.0667 |
| 29882 | ANAPC2 | LZE8T | Human | Esophagus | ESCC | 5.90e-04 | 1.80e-01 | 0.067 |
| 29882 | ANAPC2 | LZE20T | Human | Esophagus | ESCC | 1.36e-04 | 1.65e-01 | 0.0662 |
| 29882 | ANAPC2 | LZE24T | Human | Esophagus | ESCC | 6.11e-10 | 2.21e-01 | 0.0596 |
| 29882 | ANAPC2 | LZE21T | Human | Esophagus | ESCC | 1.49e-05 | 3.55e-01 | 0.0655 |
| 29882 | ANAPC2 | LZE6T | Human | Esophagus | ESCC | 1.83e-08 | 2.19e-01 | 0.0845 |
| 29882 | ANAPC2 | P1T-E | Human | Esophagus | ESCC | 1.30e-07 | 2.99e-01 | 0.0875 |
| 29882 | ANAPC2 | P2T-E | Human | Esophagus | ESCC | 2.02e-25 | 3.46e-01 | 0.1177 |
| 29882 | ANAPC2 | P4T-E | Human | Esophagus | ESCC | 6.43e-11 | 1.90e-01 | 0.1323 |
| 29882 | ANAPC2 | P5T-E | Human | Esophagus | ESCC | 2.50e-10 | 9.15e-02 | 0.1327 |
| 29882 | ANAPC2 | P8T-E | Human | Esophagus | ESCC | 4.84e-37 | 5.74e-01 | 0.0889 |
| 29882 | ANAPC2 | P9T-E | Human | Esophagus | ESCC | 5.47e-09 | 2.15e-01 | 0.1131 |
| 29882 | ANAPC2 | P10T-E | Human | Esophagus | ESCC | 3.61e-09 | 2.10e-01 | 0.116 |
| 29882 | ANAPC2 | P11T-E | Human | Esophagus | ESCC | 1.33e-09 | 4.46e-01 | 0.1426 |
| 29882 | ANAPC2 | P12T-E | Human | Esophagus | ESCC | 3.87e-16 | 2.75e-01 | 0.1122 |
| 29882 | ANAPC2 | P15T-E | Human | Esophagus | ESCC | 5.85e-11 | 2.47e-01 | 0.1149 |
| 29882 | ANAPC2 | P16T-E | Human | Esophagus | ESCC | 9.71e-15 | 1.27e-01 | 0.1153 |
| 29882 | ANAPC2 | P17T-E | Human | Esophagus | ESCC | 2.32e-06 | 2.97e-01 | 0.1278 |
| 29882 | ANAPC2 | P19T-E | Human | Esophagus | ESCC | 6.48e-03 | 3.13e-01 | 0.1662 |
| 29882 | ANAPC2 | P20T-E | Human | Esophagus | ESCC | 2.69e-12 | 1.76e-01 | 0.1124 |
| Page: 1 2 3 4 5 |
| Tissue | Expression Dynamics | Abbreviation |
| Esophagus | 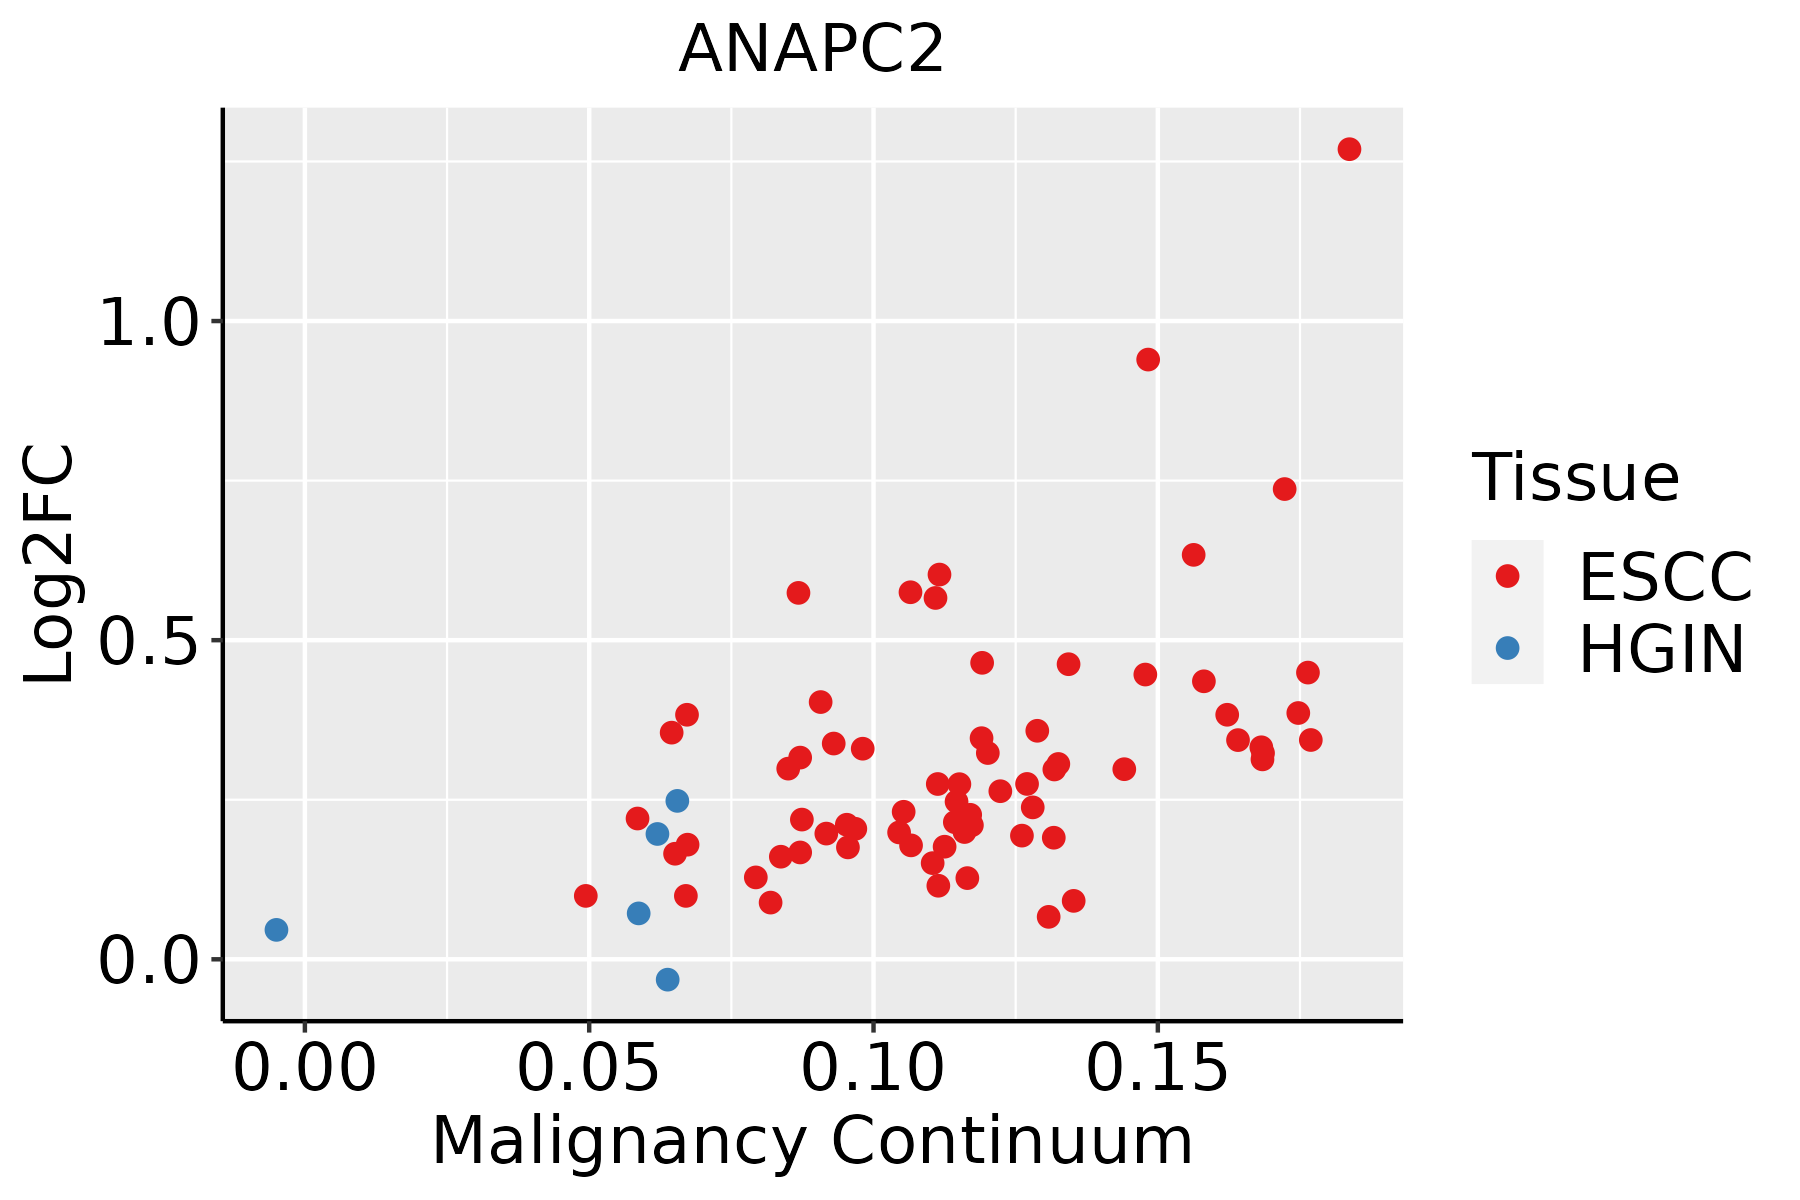 | ESCC: Esophageal squamous cell carcinoma |
| HGIN: High-grade intraepithelial neoplasias | ||
| LGIN: Low-grade intraepithelial neoplasias | ||
| Liver | 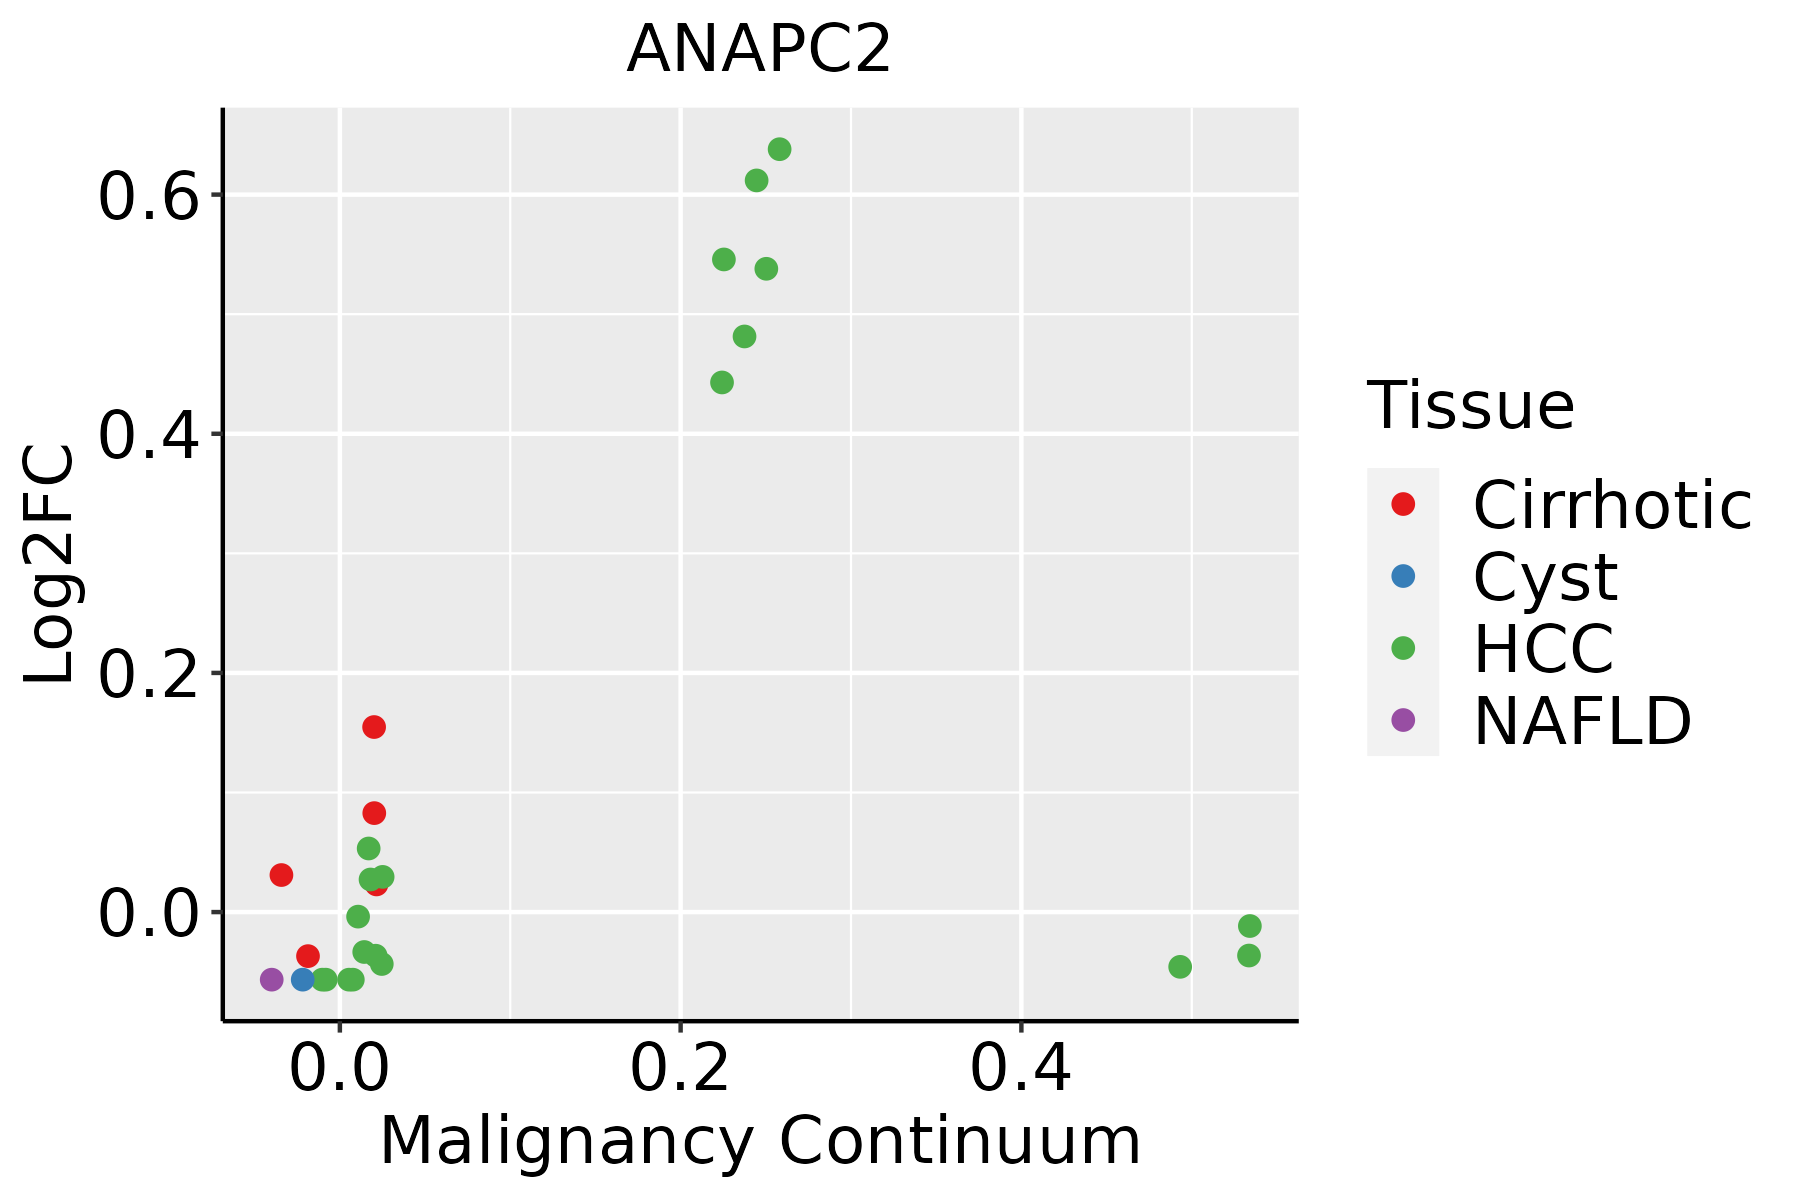 | HCC: Hepatocellular carcinoma |
| NAFLD: Non-alcoholic fatty liver disease | ||
| Oral Cavity | 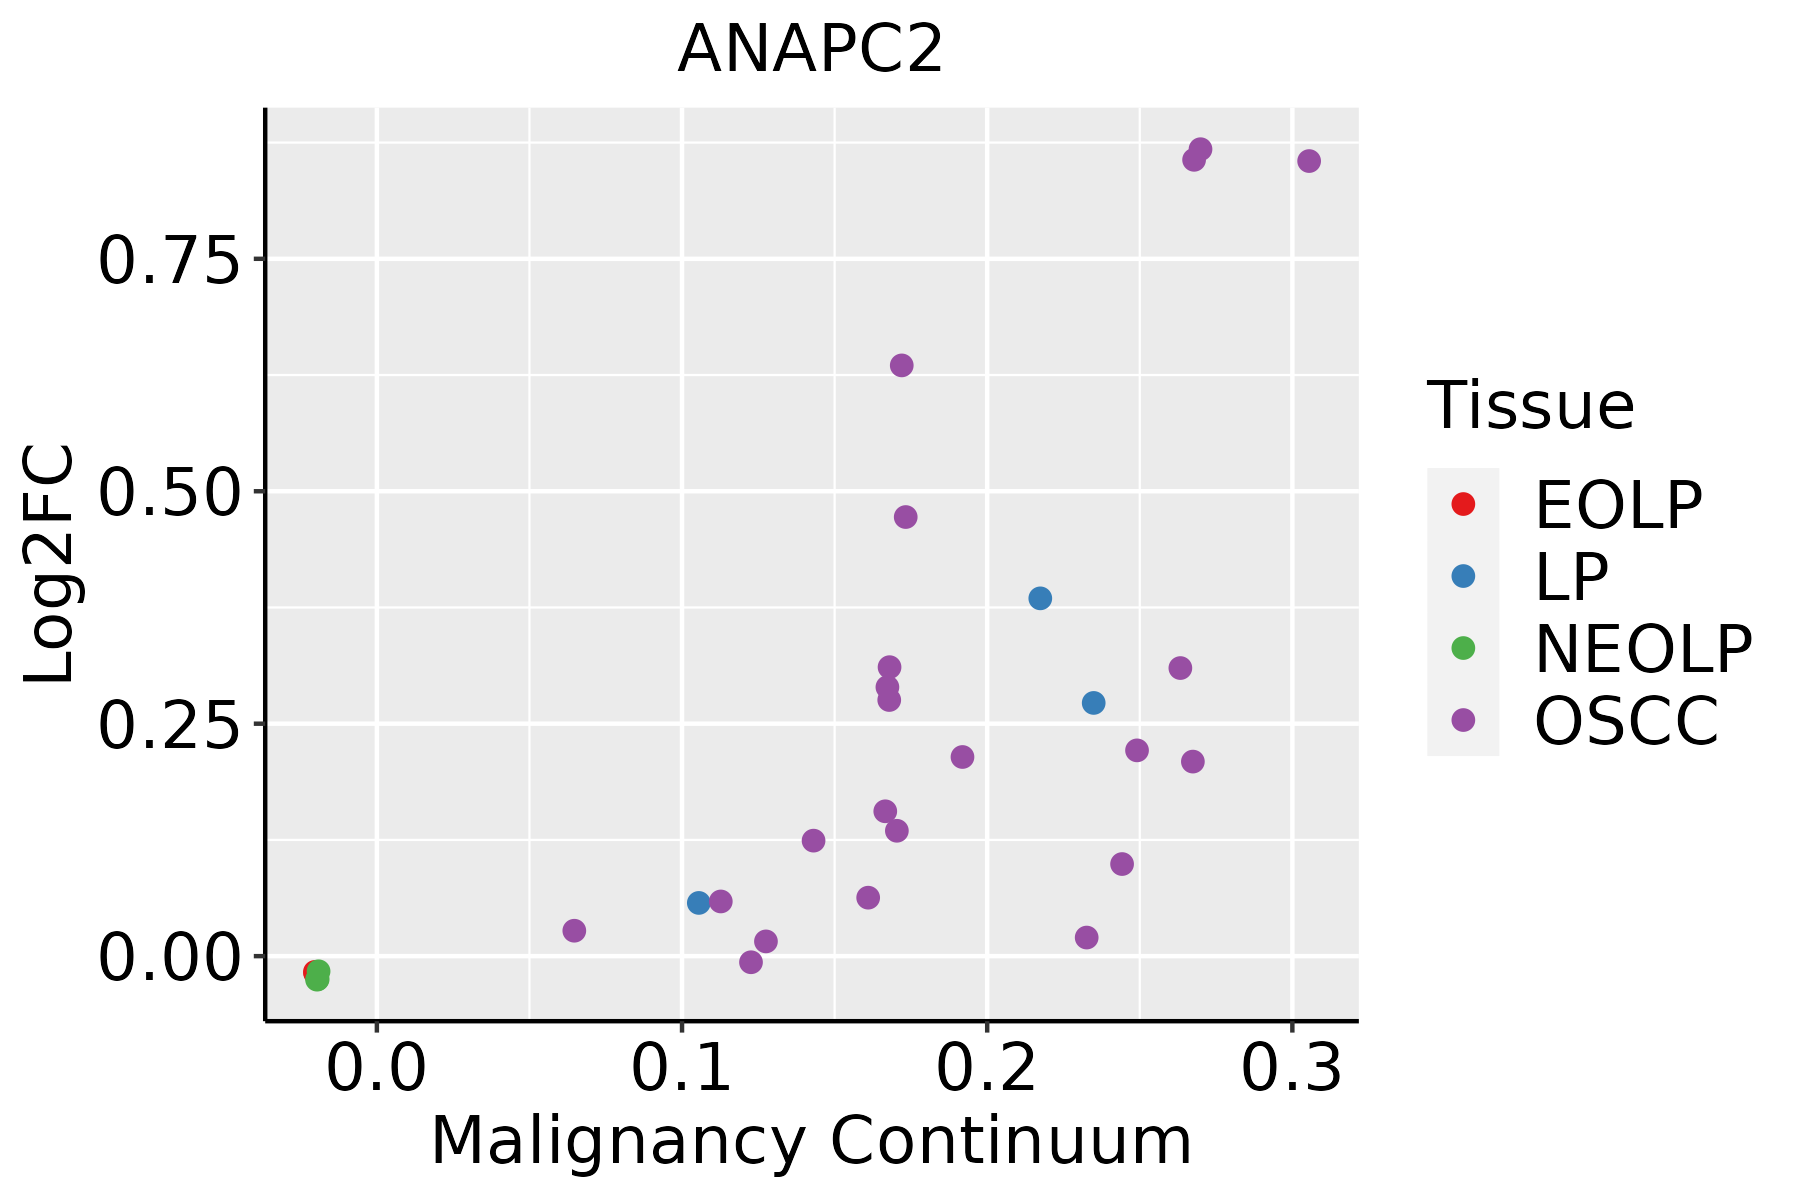 | EOLP: Erosive Oral lichen planus |
| LP: leukoplakia | ||
| NEOLP: Non-erosive oral lichen planus | ||
| OSCC: Oral squamous cell carcinoma |
| ∗log2FC in expression of this searched gene in stem-like cells from each diseased tissue sample relative to stem-like cells in normal samples in each tissue plotted against the malignancy continuum. Samples are colored based on if they are from different disease stage. |
Top |
Malignant transformation related pathway analysis |
| Find out the enriched GO biological processes and KEGG pathways involved in transition from healthy to precancer to cancer |
| Tissue | Disease Stage | Enriched GO biological Processes |
| Colorectum | AD |  |
| Colorectum | SER |  |
| Colorectum | MSS |  |
| Colorectum | MSI-H |  |
| Colorectum | FAP |  |
| ∗Top 15 enriched GO BP terms are showed in the bar plot of each disease state in each tissue. Each row represents a significant GO biological process which is colored according to the -log10(p.adjust). |
| Page: 1 2 3 4 5 6 7 8 9 |
| GO ID | Tissue | Disease Stage | Description | Gene Ratio | Bg Ratio | pvalue | p.adjust | Count |
| GO:000020917 | Esophagus | ESCC | protein polyubiquitination | 170/8552 | 236/18723 | 1.40e-16 | 1.09e-14 | 170 |
| GO:0016049110 | Esophagus | ESCC | cell growth | 289/8552 | 482/18723 | 1.29e-10 | 3.77e-09 | 289 |
| GO:000155819 | Esophagus | ESCC | regulation of cell growth | 248/8552 | 414/18723 | 2.97e-09 | 6.45e-08 | 248 |
| GO:003253520 | Esophagus | ESCC | regulation of cellular component size | 227/8552 | 383/18723 | 4.77e-08 | 8.60e-07 | 227 |
| GO:007097912 | Esophagus | ESCC | protein K11-linked ubiquitination | 27/8552 | 29/18723 | 8.09e-08 | 1.39e-06 | 27 |
| GO:002260420 | Esophagus | ESCC | regulation of cell morphogenesis | 180/8552 | 309/18723 | 5.19e-06 | 5.45e-05 | 180 |
| GO:003134616 | Esophagus | ESCC | positive regulation of cell projection organization | 201/8552 | 353/18723 | 1.19e-05 | 1.11e-04 | 201 |
| GO:001072010 | Esophagus | ESCC | positive regulation of cell development | 172/8552 | 298/18723 | 1.74e-05 | 1.55e-04 | 172 |
| GO:005076710 | Esophagus | ESCC | regulation of neurogenesis | 203/8552 | 364/18723 | 6.10e-05 | 4.68e-04 | 203 |
| GO:00507697 | Esophagus | ESCC | positive regulation of neurogenesis | 131/8552 | 225/18723 | 9.71e-05 | 6.90e-04 | 131 |
| GO:003030710 | Esophagus | ESCC | positive regulation of cell growth | 100/8552 | 166/18723 | 1.07e-04 | 7.55e-04 | 100 |
| GO:00083619 | Esophagus | ESCC | regulation of cell size | 107/8552 | 181/18723 | 1.81e-04 | 1.16e-03 | 107 |
| GO:006156415 | Esophagus | ESCC | axon development | 251/8552 | 467/18723 | 2.41e-04 | 1.49e-03 | 251 |
| GO:001097516 | Esophagus | ESCC | regulation of neuron projection development | 240/8552 | 445/18723 | 2.48e-04 | 1.53e-03 | 240 |
| GO:001076920 | Esophagus | ESCC | regulation of cell morphogenesis involved in differentiation | 61/8552 | 96/18723 | 3.12e-04 | 1.85e-03 | 61 |
| GO:00519606 | Esophagus | ESCC | regulation of nervous system development | 237/8552 | 443/18723 | 5.02e-04 | 2.78e-03 | 237 |
| GO:001077018 | Esophagus | ESCC | positive regulation of cell morphogenesis involved in differentiation | 51/8552 | 79/18723 | 5.48e-04 | 3.00e-03 | 51 |
| GO:006056010 | Esophagus | ESCC | developmental growth involved in morphogenesis | 131/8552 | 234/18723 | 9.28e-04 | 4.73e-03 | 131 |
| GO:00519625 | Esophagus | ESCC | positive regulation of nervous system development | 149/8552 | 272/18723 | 1.50e-03 | 7.06e-03 | 149 |
| GO:00457738 | Esophagus | ESCC | positive regulation of axon extension | 29/8552 | 42/18723 | 1.87e-03 | 8.46e-03 | 29 |
| Page: 1 2 3 4 5 |
| Pathway ID | Tissue | Disease Stage | Description | Gene Ratio | Bg Ratio | pvalue | p.adjust | qvalue | Count |
| hsa0412027 | Esophagus | ESCC | Ubiquitin mediated proteolysis | 122/4205 | 142/8465 | 6.53e-20 | 7.29e-18 | 3.74e-18 | 122 |
| hsa0411023 | Esophagus | ESCC | Cell cycle | 126/4205 | 157/8465 | 1.34e-15 | 5.60e-14 | 2.87e-14 | 126 |
| hsa05166211 | Esophagus | ESCC | Human T-cell leukemia virus 1 infection | 164/4205 | 222/8465 | 8.13e-14 | 2.09e-12 | 1.07e-12 | 164 |
| hsa041146 | Esophagus | ESCC | Oocyte meiosis | 77/4205 | 131/8465 | 2.19e-02 | 4.80e-02 | 2.46e-02 | 77 |
| hsa0412036 | Esophagus | ESCC | Ubiquitin mediated proteolysis | 122/4205 | 142/8465 | 6.53e-20 | 7.29e-18 | 3.74e-18 | 122 |
| hsa0411033 | Esophagus | ESCC | Cell cycle | 126/4205 | 157/8465 | 1.34e-15 | 5.60e-14 | 2.87e-14 | 126 |
| hsa05166310 | Esophagus | ESCC | Human T-cell leukemia virus 1 infection | 164/4205 | 222/8465 | 8.13e-14 | 2.09e-12 | 1.07e-12 | 164 |
| hsa0411411 | Esophagus | ESCC | Oocyte meiosis | 77/4205 | 131/8465 | 2.19e-02 | 4.80e-02 | 2.46e-02 | 77 |
| hsa0412021 | Liver | Cirrhotic | Ubiquitin mediated proteolysis | 72/2530 | 142/8465 | 1.32e-07 | 1.97e-06 | 1.21e-06 | 72 |
| hsa0516614 | Liver | Cirrhotic | Human T-cell leukemia virus 1 infection | 87/2530 | 222/8465 | 1.69e-03 | 8.01e-03 | 4.94e-03 | 87 |
| hsa041104 | Liver | Cirrhotic | Cell cycle | 61/2530 | 157/8465 | 9.53e-03 | 3.21e-02 | 1.98e-02 | 61 |
| hsa0412031 | Liver | Cirrhotic | Ubiquitin mediated proteolysis | 72/2530 | 142/8465 | 1.32e-07 | 1.97e-06 | 1.21e-06 | 72 |
| hsa0516615 | Liver | Cirrhotic | Human T-cell leukemia virus 1 infection | 87/2530 | 222/8465 | 1.69e-03 | 8.01e-03 | 4.94e-03 | 87 |
| hsa0411011 | Liver | Cirrhotic | Cell cycle | 61/2530 | 157/8465 | 9.53e-03 | 3.21e-02 | 1.98e-02 | 61 |
| hsa0412041 | Liver | HCC | Ubiquitin mediated proteolysis | 110/4020 | 142/8465 | 1.67e-13 | 3.74e-12 | 2.08e-12 | 110 |
| hsa041102 | Liver | HCC | Cell cycle | 106/4020 | 157/8465 | 2.54e-07 | 3.04e-06 | 1.69e-06 | 106 |
| hsa0516622 | Liver | HCC | Human T-cell leukemia virus 1 infection | 139/4020 | 222/8465 | 3.17e-06 | 2.79e-05 | 1.55e-05 | 139 |
| hsa0412051 | Liver | HCC | Ubiquitin mediated proteolysis | 110/4020 | 142/8465 | 1.67e-13 | 3.74e-12 | 2.08e-12 | 110 |
| hsa041103 | Liver | HCC | Cell cycle | 106/4020 | 157/8465 | 2.54e-07 | 3.04e-06 | 1.69e-06 | 106 |
| hsa0516632 | Liver | HCC | Human T-cell leukemia virus 1 infection | 139/4020 | 222/8465 | 3.17e-06 | 2.79e-05 | 1.55e-05 | 139 |
| Page: 1 2 |
Top |
Cell-cell communication analysis |
| Identification of potential cell-cell interactions between two cell types and their ligand-receptor pairs for different disease states |
| Ligand | Receptor | LRpair | Pathway | Tissue | Disease Stage |
| Page: 1 |
Top |
Single-cell gene regulatory network inference analysis |
| Find out the significant the regulons (TFs) and the target genes of each regulon across cell types for different disease states |
| TF | Cell Type | Tissue | Disease Stage | Target Gene | RSS | Regulon Activity |
| ∗The dot plots of a searched regulon are shown for all cell subpopulations in each disease state of each tissue based on the regulon specific score inferred using pySCENIC and by calculating the average expression. |
| Page: 1 |
Top |
Somatic mutation of malignant transformation related genes |
| Annotation of somatic variants for genes involved in malignant transformation |
| Hugo Symbol | Variant Class | Variant Classification | dbSNP RS | HGVSc | HGVSp | HGVSp Short | SWISSPROT | BIOTYPE | SIFT | PolyPhen | Tumor Sample Barcode | Tissue | Histology | Sex | Age | Stage | Therapy Types | Drugs | Outcome |
| ANAPC2 | SNV | Missense_Mutation | novel | c.507N>A | p.Phe169Leu | p.F169L | Q9UJX6 | protein_coding | tolerated(0.44) | benign(0.07) | TCGA-DG-A2KK-01 | Cervix | cervical & endocervical cancer | Female | <65 | III/IV | Chemotherapy | cisplatin | SD |
| ANAPC2 | SNV | Missense_Mutation | rs878889078 | c.167N>A | p.Arg56Gln | p.R56Q | Q9UJX6 | protein_coding | tolerated(0.51) | benign(0) | TCGA-EA-A5FO-01 | Cervix | cervical & endocervical cancer | Female | <65 | I/II | Unknown | Unknown | SD |
| ANAPC2 | SNV | Missense_Mutation | novel | c.516G>A | p.Met172Ile | p.M172I | Q9UJX6 | protein_coding | tolerated(1) | benign(0.007) | TCGA-EX-A8YF-01 | Cervix | cervical & endocervical cancer | Female | <65 | I/II | Unknown | Unknown | PD |
| ANAPC2 | SNV | Missense_Mutation | c.500N>A | p.Arg167Lys | p.R167K | Q9UJX6 | protein_coding | tolerated(0.93) | benign(0) | TCGA-IR-A3LH-01 | Cervix | cervical & endocervical cancer | Female | <65 | I/II | Chemotherapy | cisplatin | CR | |
| ANAPC2 | SNV | Missense_Mutation | c.486C>G | p.Phe162Leu | p.F162L | Q9UJX6 | protein_coding | tolerated(0.75) | benign(0.003) | TCGA-LP-A5U2-01 | Cervix | cervical & endocervical cancer | Female | <65 | III/IV | Unknown | Unknown | SD | |
| ANAPC2 | SNV | Missense_Mutation | c.2380G>A | p.Glu794Lys | p.E794K | Q9UJX6 | protein_coding | deleterious(0) | probably_damaging(0.986) | TCGA-LP-A7HU-01 | Cervix | cervical & endocervical cancer | Female | <65 | I/II | Unknown | Unknown | SD | |
| ANAPC2 | SNV | Missense_Mutation | c.244N>A | p.Asp82Asn | p.D82N | Q9UJX6 | protein_coding | tolerated(0.29) | possibly_damaging(0.462) | TCGA-AA-3510-01 | Colorectum | colon adenocarcinoma | Male | >=65 | I/II | Unknown | Unknown | SD | |
| ANAPC2 | SNV | Missense_Mutation | rs768895745 | c.1487N>A | p.Arg496Gln | p.R496Q | Q9UJX6 | protein_coding | tolerated(0.08) | possibly_damaging(0.64) | TCGA-AA-A03F-01 | Colorectum | colon adenocarcinoma | Female | >=65 | III/IV | Unknown | Unknown | PD |
| ANAPC2 | SNV | Missense_Mutation | c.1445N>T | p.Pro482Leu | p.P482L | Q9UJX6 | protein_coding | deleterious(0.03) | probably_damaging(1) | TCGA-AY-6197-01 | Colorectum | colon adenocarcinoma | Male | <65 | I/II | Unknown | Unknown | SD | |
| ANAPC2 | SNV | Missense_Mutation | c.1222N>A | p.Arg408Ser | p.R408S | Q9UJX6 | protein_coding | deleterious(0) | probably_damaging(0.925) | TCGA-AZ-4315-01 | Colorectum | colon adenocarcinoma | Male | <65 | I/II | Unknown | Unknown | SD |
| Page: 1 2 3 4 5 6 7 |
Top |
Related drugs of malignant transformation related genes |
| Identification of chemicals and drugs interact with genes involved in malignant transfromation |
| (DGIdb 4.0) |
| Entrez ID | Symbol | Category | Interaction Types | Drug Claim Name | Drug Name | PMIDs |
| Page: 1 |

Copyright 2023-Present -The University of Texas Health Science Center at Houston |