
|
|||||
|
 | |
| |
| |
| |
| |
| |
|
Gene: ANAPC16 |
Gene summary for ANAPC16 |
| Gene information | Species | Human | Gene symbol | ANAPC16 | Gene ID | 119504 |
| Gene name | anaphase promoting complex subunit 16 | |
| Gene Alias | APC16 | |
| Cytomap | 10q22.1 | |
| Gene Type | protein-coding | GO ID | GO:0006464 | UniProtAcc | C5H3H2 |
Top |
Malignant transformation analysis |
| Identification of the aberrant gene expression in precancerous and cancerous lesions by comparing the gene expression of stem-like cells in diseased tissues with normal stem cells |
| Entrez ID | Symbol | Replicates | Species | Organ | Tissue | Adj P-value | Log2FC | Malignancy |
| 119504 | ANAPC16 | GSM4909282 | Human | Breast | IDC | 6.60e-29 | 5.51e-01 | -0.0288 |
| 119504 | ANAPC16 | GSM4909286 | Human | Breast | IDC | 5.15e-07 | 1.86e-01 | 0.1081 |
| 119504 | ANAPC16 | GSM4909293 | Human | Breast | IDC | 1.94e-74 | 8.27e-01 | 0.1581 |
| 119504 | ANAPC16 | GSM4909294 | Human | Breast | IDC | 2.05e-07 | -6.37e-03 | 0.2022 |
| 119504 | ANAPC16 | GSM4909296 | Human | Breast | IDC | 2.32e-12 | 1.24e-01 | 0.1524 |
| 119504 | ANAPC16 | GSM4909297 | Human | Breast | IDC | 2.87e-18 | -1.26e-01 | 0.1517 |
| 119504 | ANAPC16 | GSM4909301 | Human | Breast | IDC | 3.00e-02 | -1.16e-01 | 0.1577 |
| 119504 | ANAPC16 | GSM4909305 | Human | Breast | IDC | 1.59e-02 | 2.40e-01 | 0.0436 |
| 119504 | ANAPC16 | GSM4909308 | Human | Breast | IDC | 3.42e-05 | 2.73e-01 | 0.158 |
| 119504 | ANAPC16 | GSM4909311 | Human | Breast | IDC | 9.23e-48 | -2.04e-01 | 0.1534 |
| 119504 | ANAPC16 | GSM4909312 | Human | Breast | IDC | 5.06e-20 | 1.48e-01 | 0.1552 |
| 119504 | ANAPC16 | GSM4909313 | Human | Breast | IDC | 1.59e-04 | 6.67e-02 | 0.0391 |
| 119504 | ANAPC16 | GSM4909316 | Human | Breast | IDC | 2.26e-04 | 2.06e-01 | 0.21 |
| 119504 | ANAPC16 | GSM4909318 | Human | Breast | IDC | 4.67e-02 | 9.53e-02 | 0.2031 |
| 119504 | ANAPC16 | GSM4909319 | Human | Breast | IDC | 6.51e-61 | -1.98e-01 | 0.1563 |
| 119504 | ANAPC16 | GSM4909320 | Human | Breast | IDC | 5.89e-09 | -4.45e-03 | 0.1575 |
| 119504 | ANAPC16 | GSM4909321 | Human | Breast | IDC | 5.77e-19 | -1.32e-01 | 0.1559 |
| 119504 | ANAPC16 | brca2 | Human | Breast | Precancer | 8.44e-03 | 1.63e-01 | -0.024 |
| 119504 | ANAPC16 | NCCBC14 | Human | Breast | DCIS | 2.09e-13 | -4.33e-02 | 0.2021 |
| 119504 | ANAPC16 | NCCBC2 | Human | Breast | DCIS | 2.02e-04 | -2.46e-01 | 0.1554 |
| Page: 1 2 3 4 5 6 7 8 9 10 11 |
| Tissue | Expression Dynamics | Abbreviation |
| Breast |  | IDC: Invasive ductal carcinoma |
| DCIS: Ductal carcinoma in situ | ||
| Precancer(BRCA1-mut): Precancerous lesion from BRCA1 mutation carriers | ||
| Colorectum (GSE201348) |  | FAP: Familial adenomatous polyposis |
| CRC: Colorectal cancer | ||
| Colorectum (HTA11) |  | AD: Adenomas |
| SER: Sessile serrated lesions | ||
| MSI-H: Microsatellite-high colorectal cancer | ||
| MSS: Microsatellite stable colorectal cancer | ||
| Endometrium | 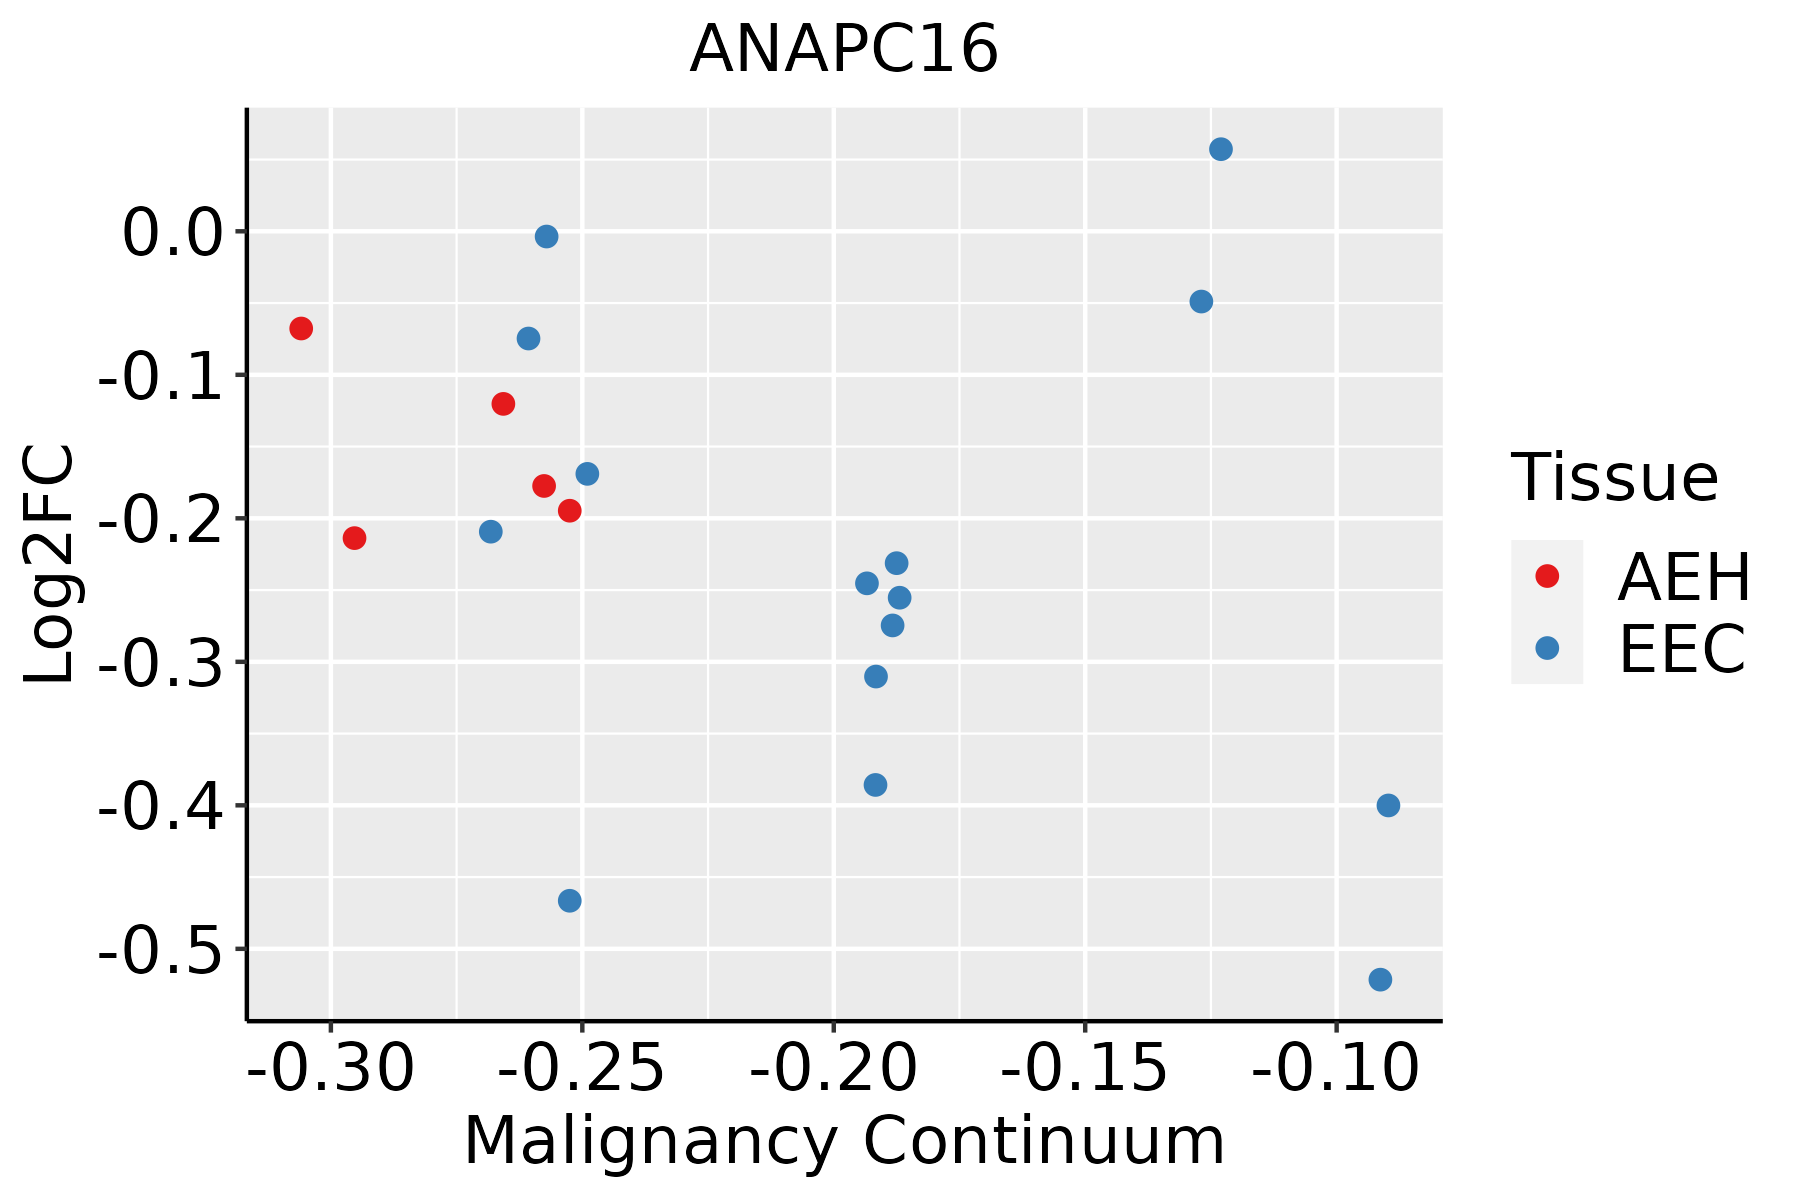 | AEH: Atypical endometrial hyperplasia |
| EEC: Endometrioid Cancer | ||
| Esophagus | 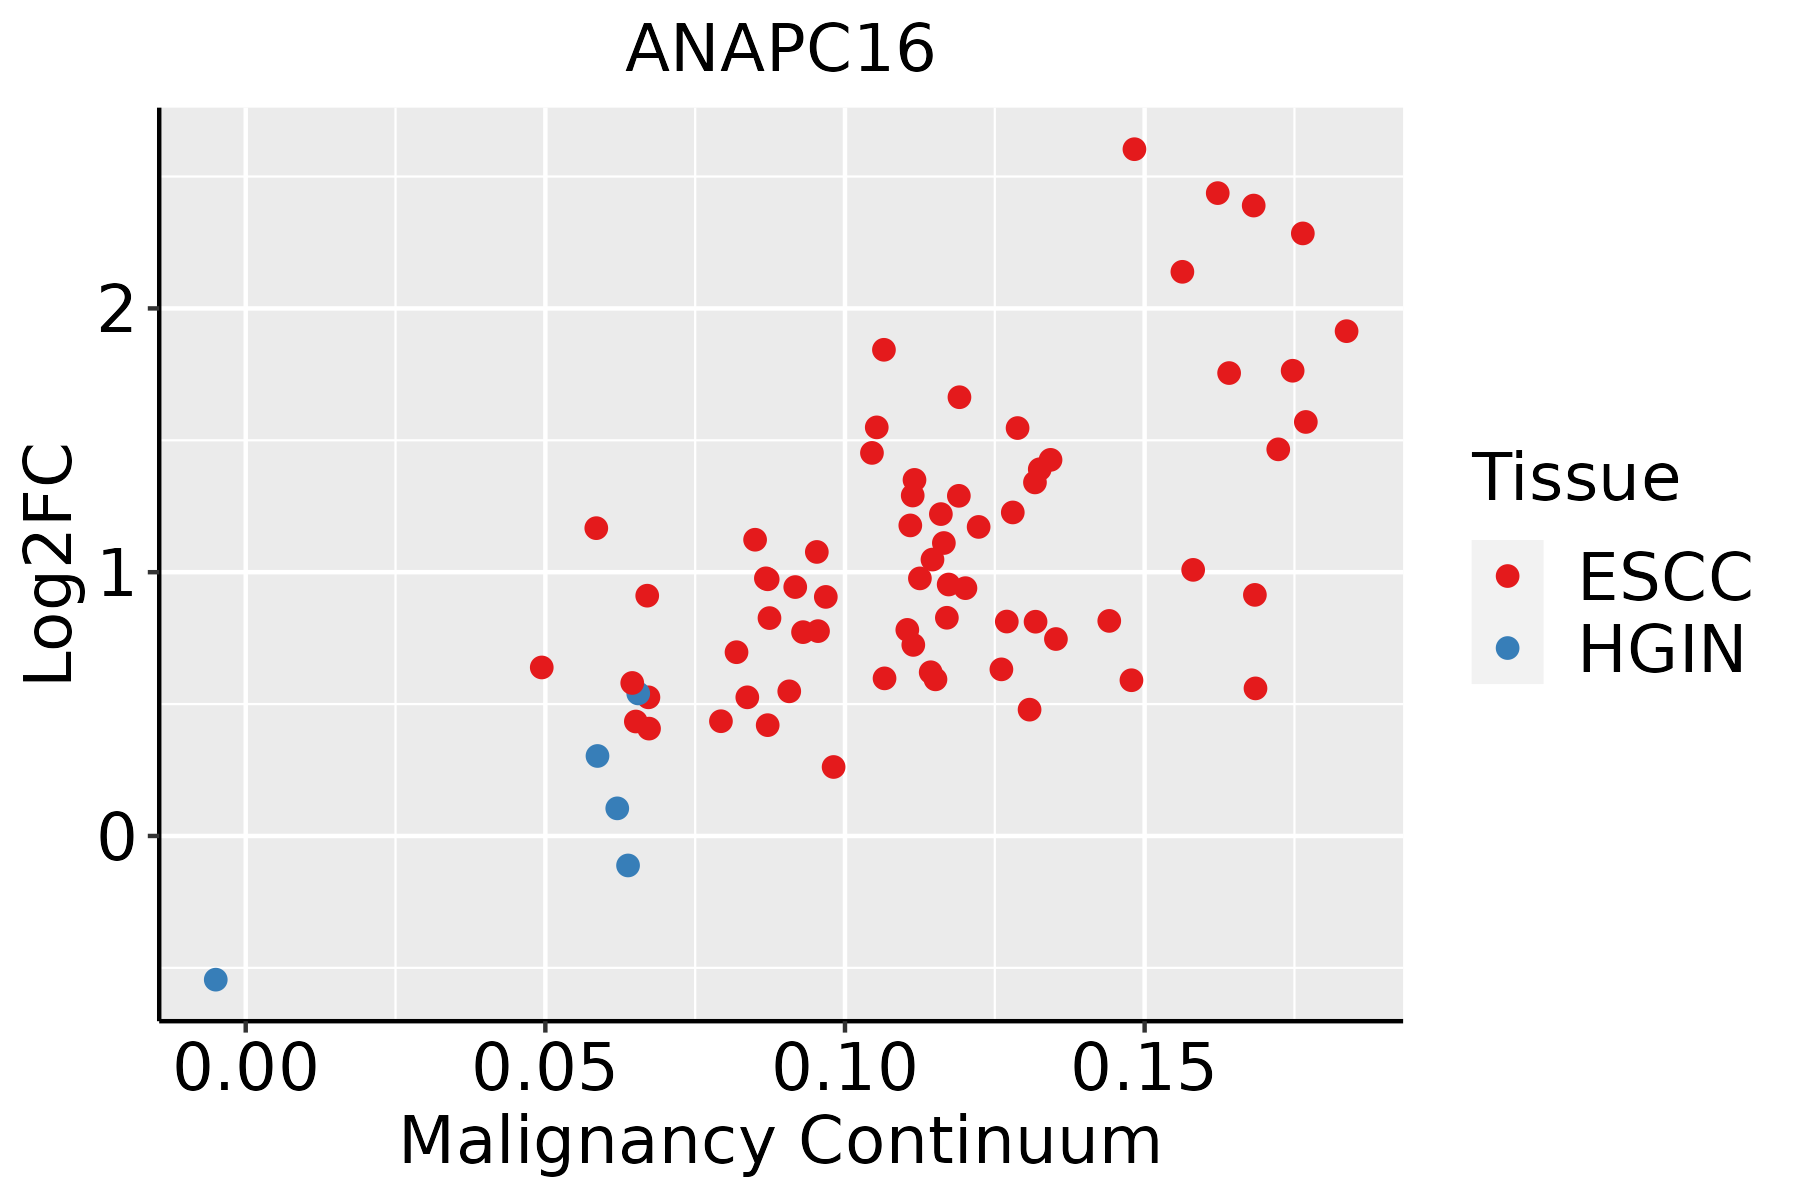 | ESCC: Esophageal squamous cell carcinoma |
| HGIN: High-grade intraepithelial neoplasias | ||
| LGIN: Low-grade intraepithelial neoplasias | ||
| Liver | 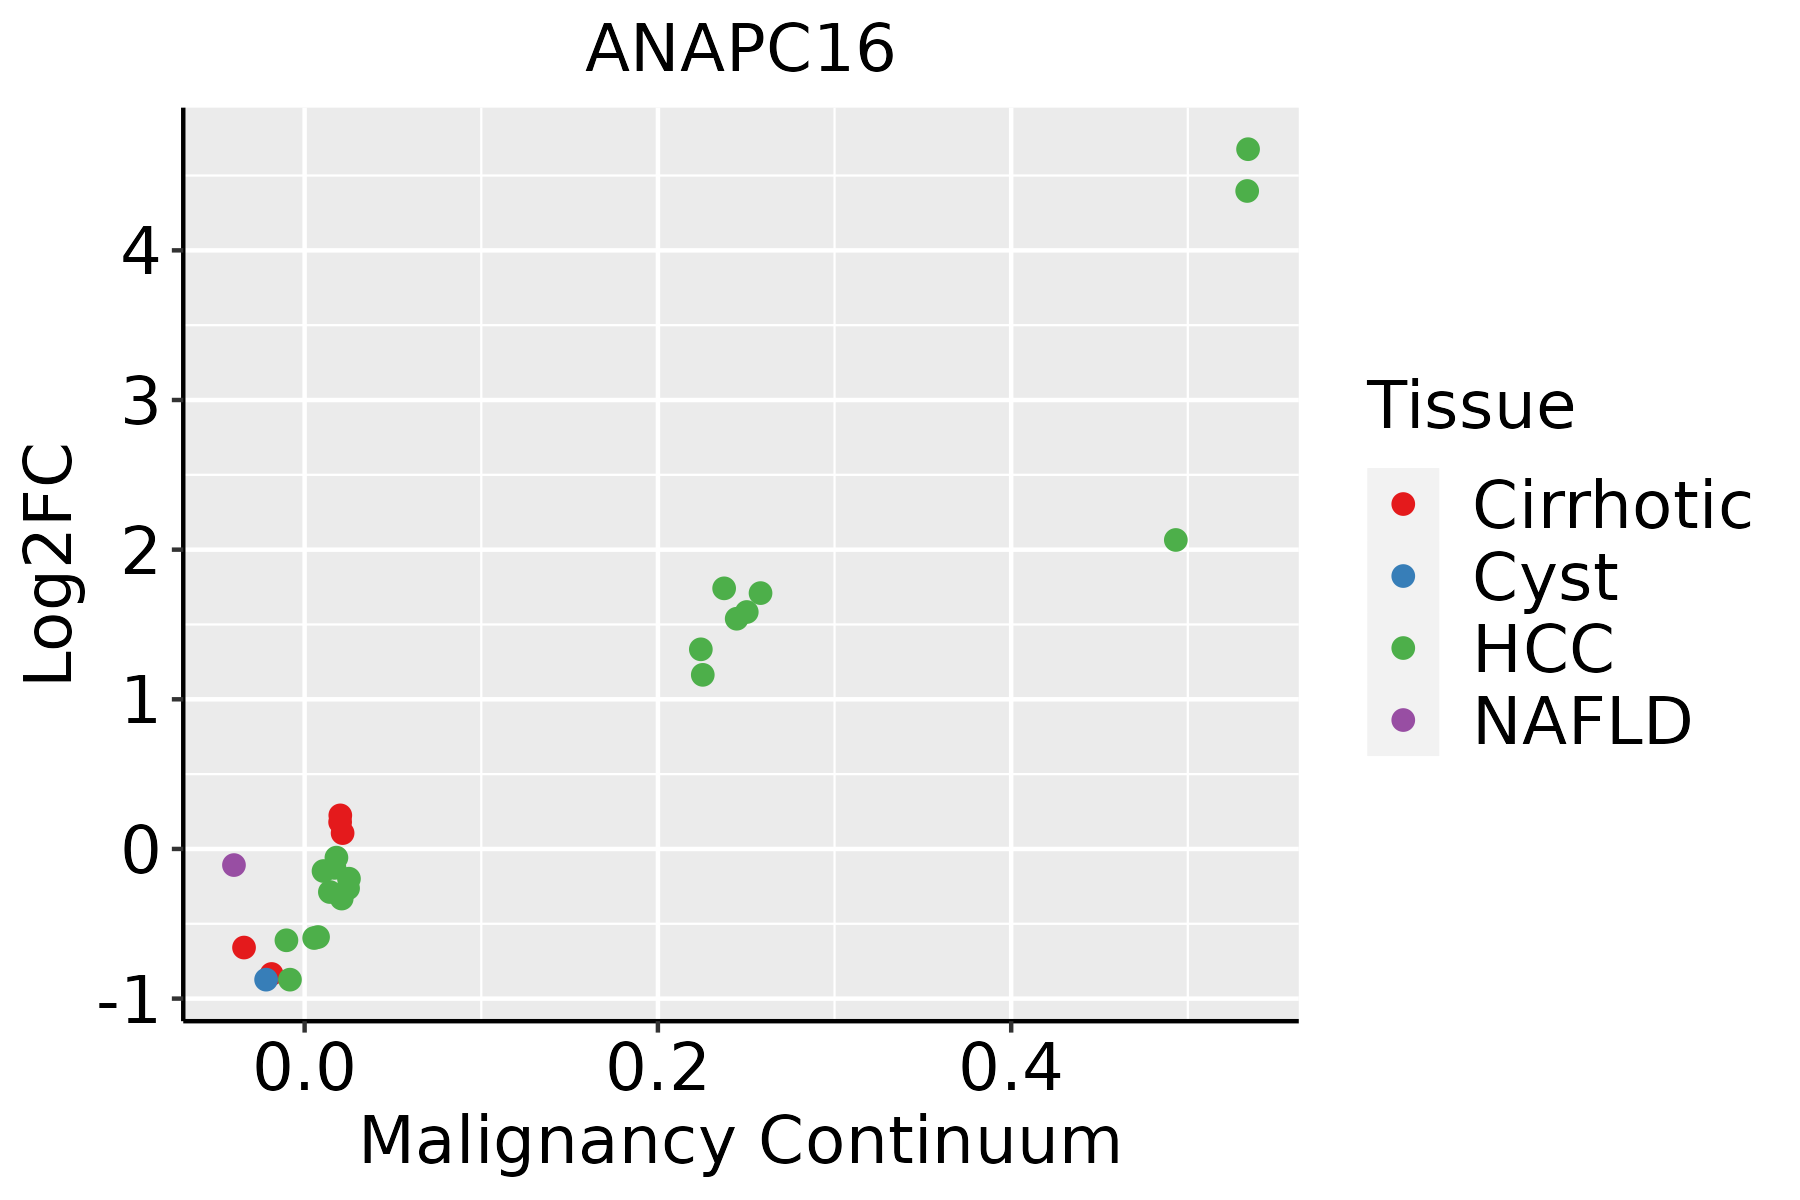 | HCC: Hepatocellular carcinoma |
| NAFLD: Non-alcoholic fatty liver disease | ||
| Oral Cavity | 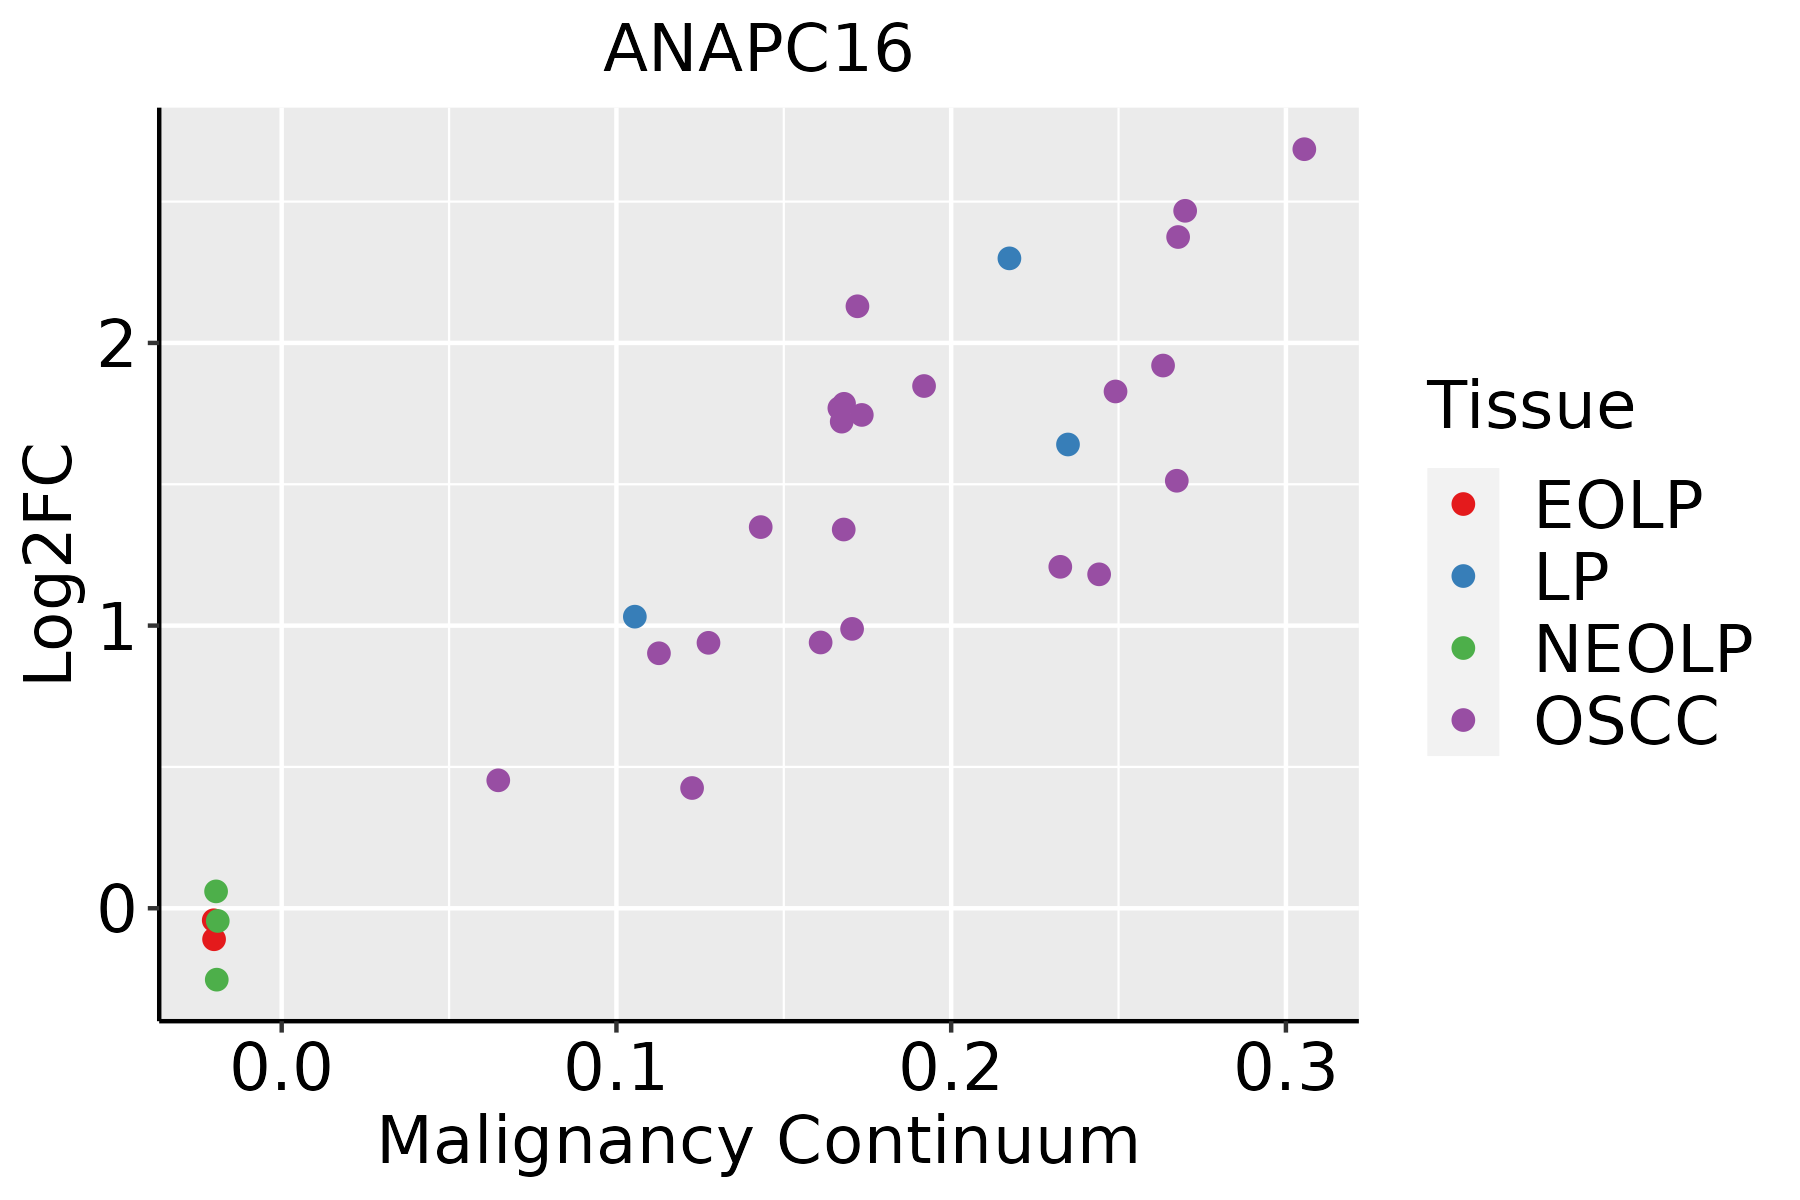 | EOLP: Erosive Oral lichen planus |
| LP: leukoplakia | ||
| NEOLP: Non-erosive oral lichen planus | ||
| OSCC: Oral squamous cell carcinoma | ||
| Prostate | 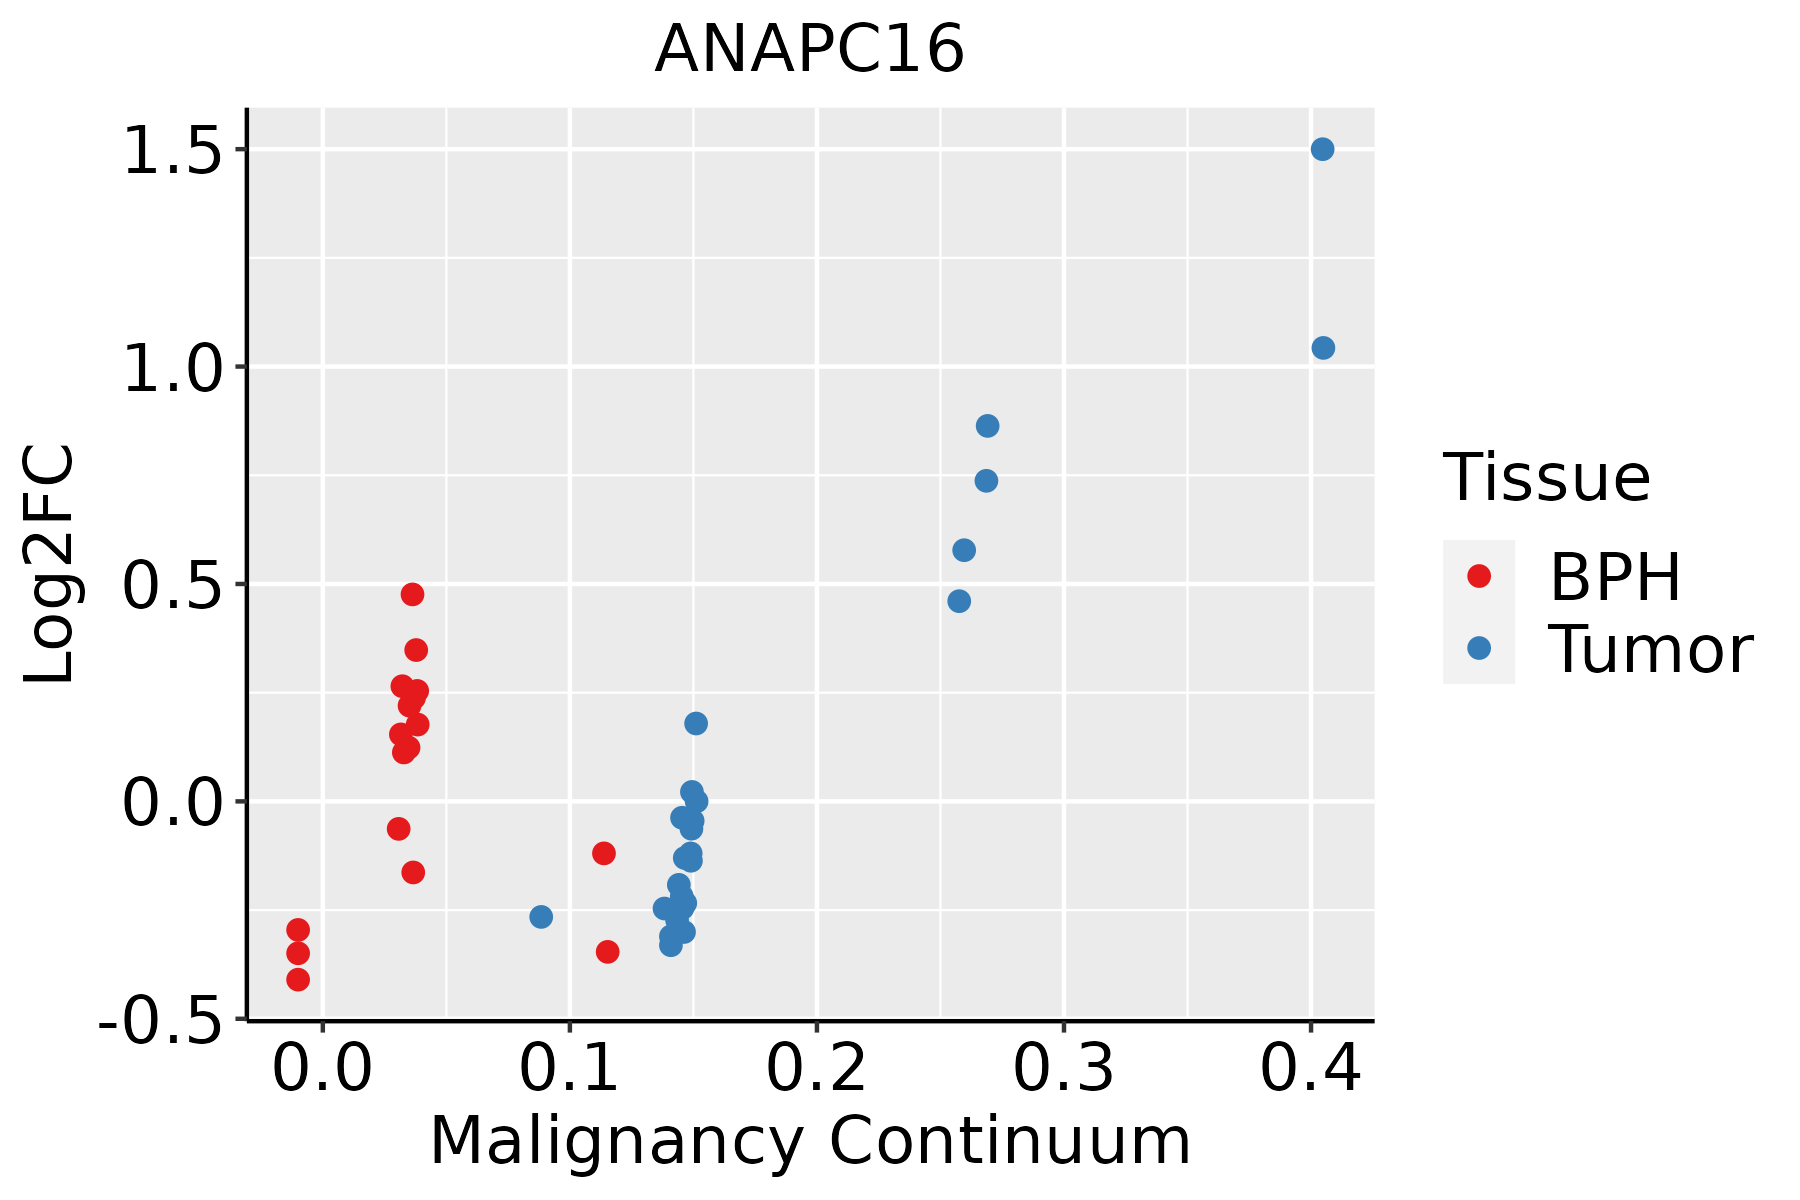 | BPH: Benign Prostatic Hyperplasia |
| Skin | 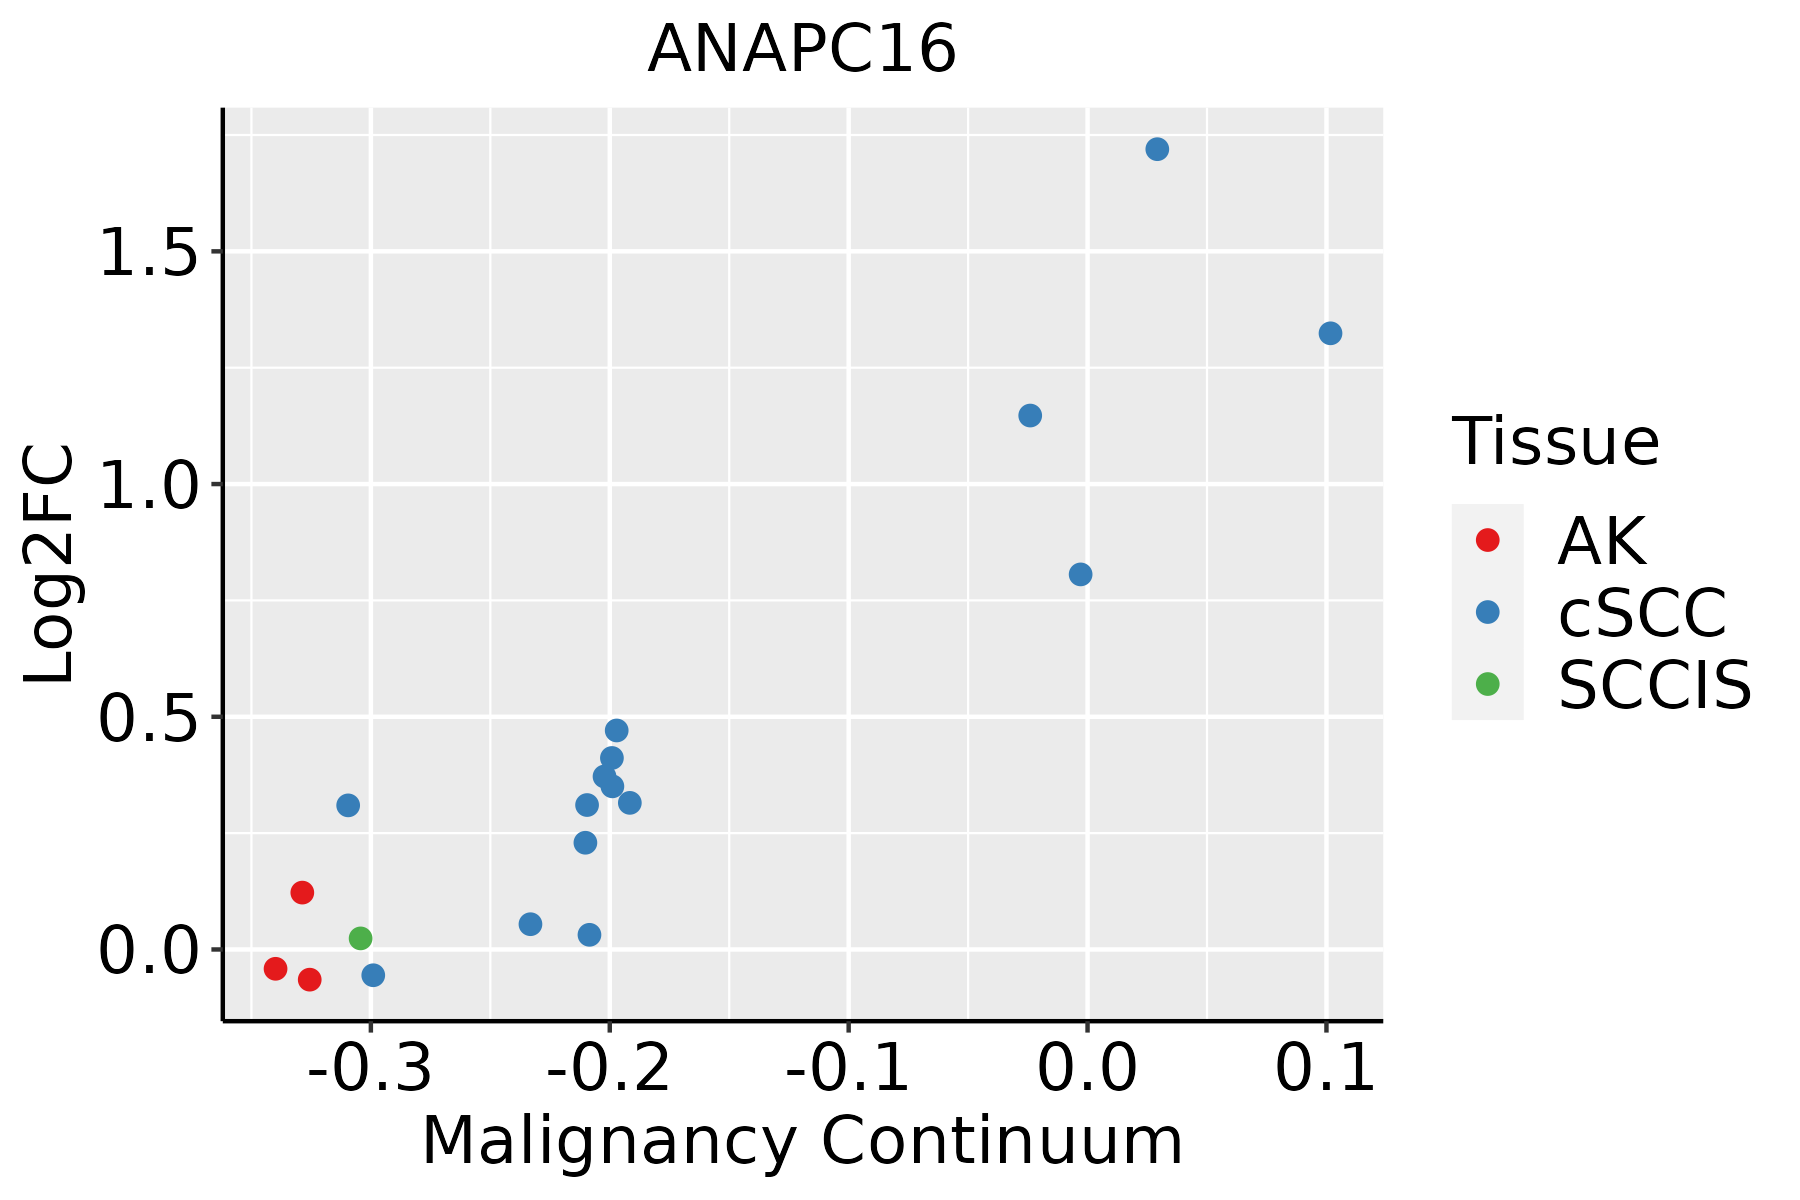 | AK: Actinic keratosis |
| cSCC: Cutaneous squamous cell carcinoma | ||
| SCCIS:squamous cell carcinoma in situ | ||
| Thyroid | 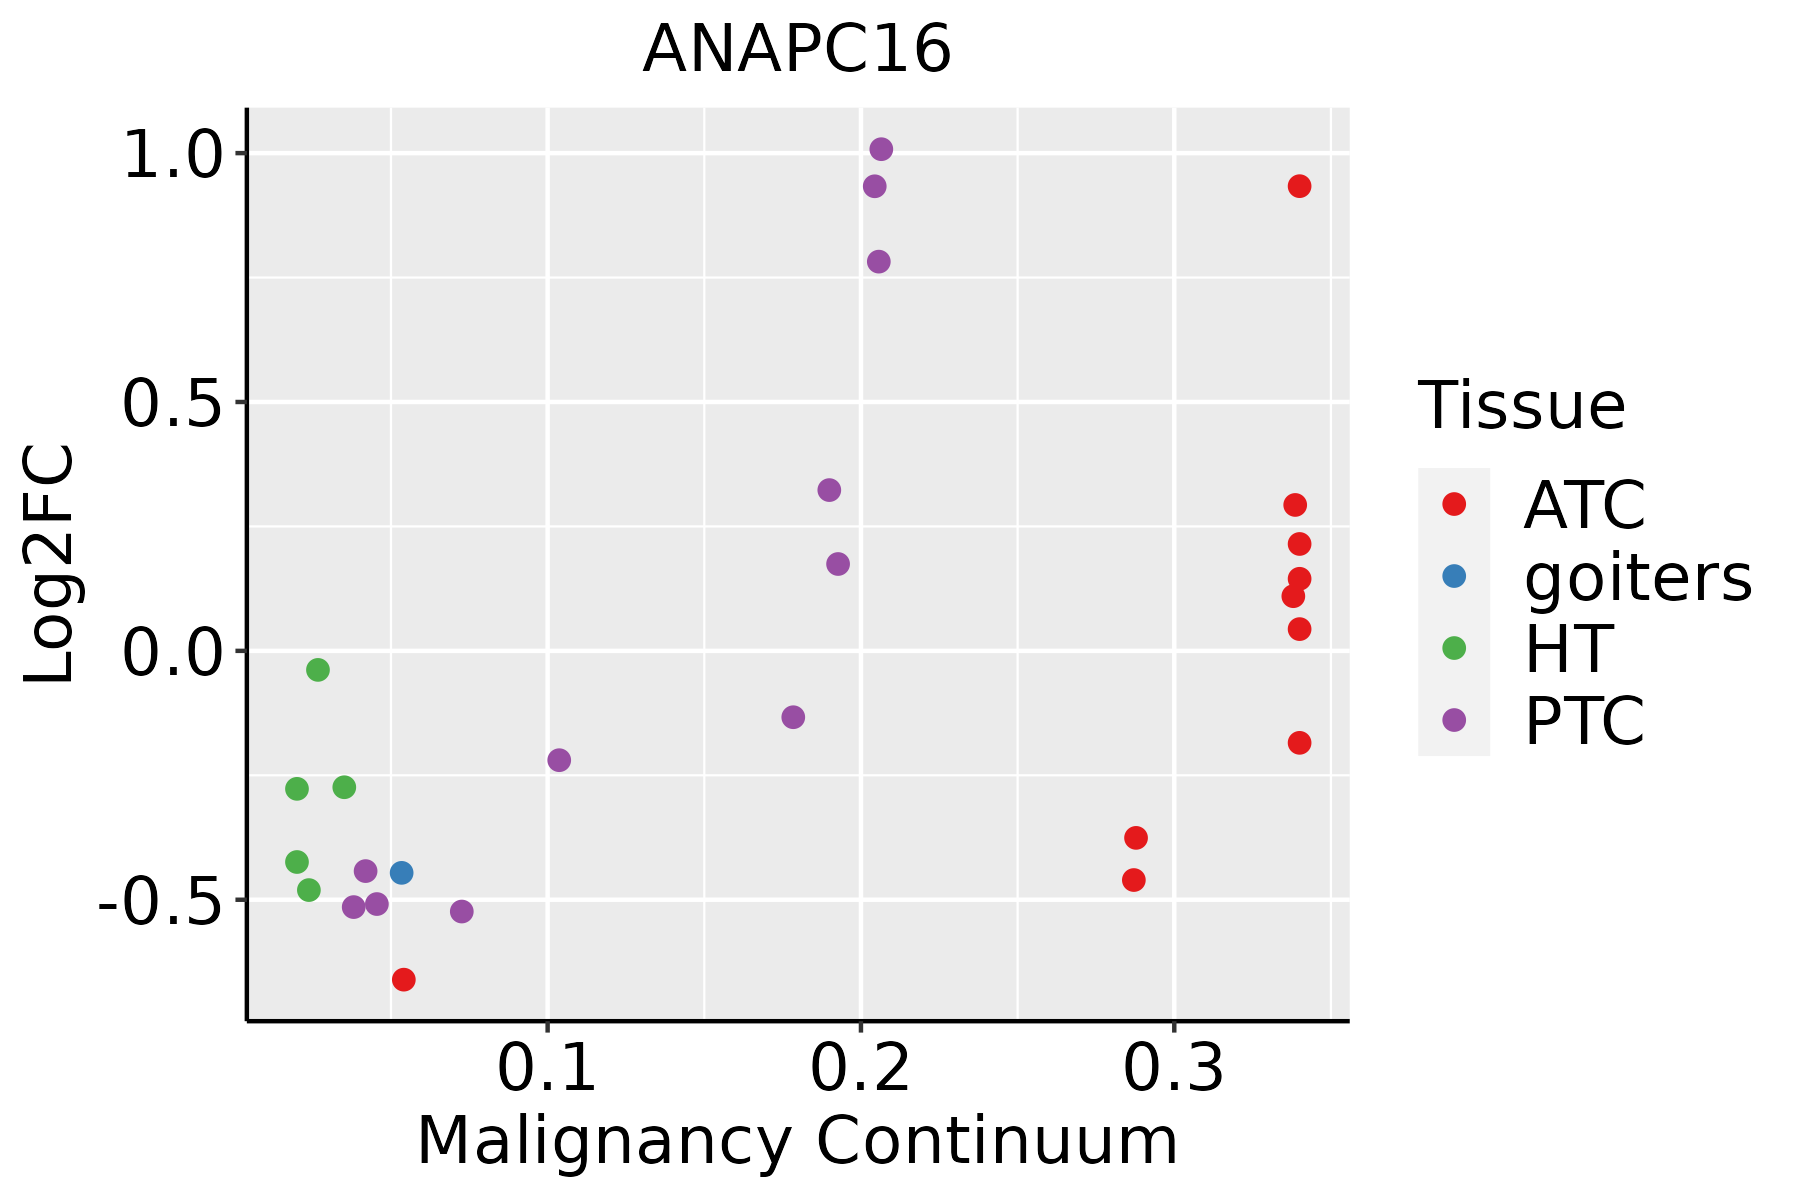 | ATC: Anaplastic thyroid cancer |
| HT: Hashimoto's thyroiditis | ||
| PTC: Papillary thyroid cancer |
| ∗log2FC in expression of this searched gene in stem-like cells from each diseased tissue sample relative to stem-like cells in normal samples in each tissue plotted against the malignancy continuum. Samples are colored based on if they are from different disease stage. |
Top |
Malignant transformation related pathway analysis |
| Find out the enriched GO biological processes and KEGG pathways involved in transition from healthy to precancer to cancer |
| Tissue | Disease Stage | Enriched GO biological Processes |
| Colorectum | AD |  |
| Colorectum | SER |  |
| Colorectum | MSS |  |
| Colorectum | MSI-H |  |
| Colorectum | FAP |  |
| ∗Top 15 enriched GO BP terms are showed in the bar plot of each disease state in each tissue. Each row represents a significant GO biological process which is colored according to the -log10(p.adjust). |
| Page: 1 2 3 4 5 6 7 8 9 |
| GO ID | Tissue | Disease Stage | Description | Gene Ratio | Bg Ratio | pvalue | p.adjust | Count |
| Page: 1 |
| Pathway ID | Tissue | Disease Stage | Description | Gene Ratio | Bg Ratio | pvalue | p.adjust | qvalue | Count |
| hsa0516618 | Breast | Precancer | Human T-cell leukemia virus 1 infection | 33/684 | 222/8465 | 4.29e-04 | 3.31e-03 | 2.53e-03 | 33 |
| hsa0516619 | Breast | Precancer | Human T-cell leukemia virus 1 infection | 33/684 | 222/8465 | 4.29e-04 | 3.31e-03 | 2.53e-03 | 33 |
| hsa0516624 | Breast | IDC | Human T-cell leukemia virus 1 infection | 40/867 | 222/8465 | 2.52e-04 | 2.21e-03 | 1.66e-03 | 40 |
| hsa0516634 | Breast | IDC | Human T-cell leukemia virus 1 infection | 40/867 | 222/8465 | 2.52e-04 | 2.21e-03 | 1.66e-03 | 40 |
| hsa0516642 | Breast | DCIS | Human T-cell leukemia virus 1 infection | 41/846 | 222/8465 | 7.03e-05 | 6.88e-04 | 5.07e-04 | 41 |
| hsa0516652 | Breast | DCIS | Human T-cell leukemia virus 1 infection | 41/846 | 222/8465 | 7.03e-05 | 6.88e-04 | 5.07e-04 | 41 |
| hsa04120 | Colorectum | AD | Ubiquitin mediated proteolysis | 58/2092 | 142/8465 | 1.46e-05 | 1.53e-04 | 9.76e-05 | 58 |
| hsa05166 | Colorectum | AD | Human T-cell leukemia virus 1 infection | 72/2092 | 222/8465 | 5.24e-03 | 2.44e-02 | 1.55e-02 | 72 |
| hsa041201 | Colorectum | AD | Ubiquitin mediated proteolysis | 58/2092 | 142/8465 | 1.46e-05 | 1.53e-04 | 9.76e-05 | 58 |
| hsa051661 | Colorectum | AD | Human T-cell leukemia virus 1 infection | 72/2092 | 222/8465 | 5.24e-03 | 2.44e-02 | 1.55e-02 | 72 |
| hsa041204 | Colorectum | MSS | Ubiquitin mediated proteolysis | 55/1875 | 142/8465 | 5.02e-06 | 6.00e-05 | 3.68e-05 | 55 |
| hsa051662 | Colorectum | MSS | Human T-cell leukemia virus 1 infection | 68/1875 | 222/8465 | 1.84e-03 | 9.61e-03 | 5.89e-03 | 68 |
| hsa041205 | Colorectum | MSS | Ubiquitin mediated proteolysis | 55/1875 | 142/8465 | 5.02e-06 | 6.00e-05 | 3.68e-05 | 55 |
| hsa051663 | Colorectum | MSS | Human T-cell leukemia virus 1 infection | 68/1875 | 222/8465 | 1.84e-03 | 9.61e-03 | 5.89e-03 | 68 |
| hsa041206 | Colorectum | FAP | Ubiquitin mediated proteolysis | 51/1404 | 142/8465 | 1.55e-08 | 5.84e-07 | 3.55e-07 | 51 |
| hsa04110 | Colorectum | FAP | Cell cycle | 37/1404 | 157/8465 | 1.44e-02 | 4.77e-02 | 2.90e-02 | 37 |
| hsa041207 | Colorectum | FAP | Ubiquitin mediated proteolysis | 51/1404 | 142/8465 | 1.55e-08 | 5.84e-07 | 3.55e-07 | 51 |
| hsa041101 | Colorectum | FAP | Cell cycle | 37/1404 | 157/8465 | 1.44e-02 | 4.77e-02 | 2.90e-02 | 37 |
| hsa041208 | Colorectum | CRC | Ubiquitin mediated proteolysis | 42/1091 | 142/8465 | 9.98e-08 | 6.67e-06 | 4.52e-06 | 42 |
| hsa041209 | Colorectum | CRC | Ubiquitin mediated proteolysis | 42/1091 | 142/8465 | 9.98e-08 | 6.67e-06 | 4.52e-06 | 42 |
| Page: 1 2 3 4 |
Top |
Cell-cell communication analysis |
| Identification of potential cell-cell interactions between two cell types and their ligand-receptor pairs for different disease states |
| Ligand | Receptor | LRpair | Pathway | Tissue | Disease Stage |
| Page: 1 |
Top |
Single-cell gene regulatory network inference analysis |
| Find out the significant the regulons (TFs) and the target genes of each regulon across cell types for different disease states |
| TF | Cell Type | Tissue | Disease Stage | Target Gene | RSS | Regulon Activity |
| ∗The dot plots of a searched regulon are shown for all cell subpopulations in each disease state of each tissue based on the regulon specific score inferred using pySCENIC and by calculating the average expression. |
| Page: 1 |
Top |
Somatic mutation of malignant transformation related genes |
| Annotation of somatic variants for genes involved in malignant transformation |
| Hugo Symbol | Variant Class | Variant Classification | dbSNP RS | HGVSc | HGVSp | HGVSp Short | SWISSPROT | BIOTYPE | SIFT | PolyPhen | Tumor Sample Barcode | Tissue | Histology | Sex | Age | Stage | Therapy Types | Drugs | Outcome |
| ANAPC16 | SNV | Missense_Mutation | rs770445774 | c.286N>G | p.Phe96Val | p.F96V | Q96DE5 | protein_coding | deleterious_low_confidence(0.03) | benign(0.075) | TCGA-B6-A0IM-01 | Breast | breast invasive carcinoma | Female | >=65 | I/II | Unknown | Unknown | SD |
| ANAPC16 | SNV | Missense_Mutation | novel | c.193N>C | p.Ser65Pro | p.S65P | Q96DE5 | protein_coding | tolerated_low_confidence(0.16) | probably_damaging(0.959) | TCGA-AJ-A3EK-01 | Endometrium | uterine corpus endometrioid carcinoma | Female | <65 | I/II | Chemotherapy | carboplatin | CR |
| ANAPC16 | SNV | Missense_Mutation | c.50C>A | p.Ser17Tyr | p.S17Y | Q96DE5 | protein_coding | deleterious_low_confidence(0) | probably_damaging(0.983) | TCGA-D1-A103-01 | Endometrium | uterine corpus endometrioid carcinoma | Female | >=65 | I/II | Unknown | Unknown | SD | |
| ANAPC16 | SNV | Missense_Mutation | novel | c.134N>C | p.Met45Thr | p.M45T | Q96DE5 | protein_coding | deleterious_low_confidence(0.02) | benign(0.402) | TCGA-FI-A2D0-01 | Endometrium | uterine corpus endometrioid carcinoma | Female | <65 | I/II | Unknown | Unknown | SD |
| ANAPC16 | SNV | Missense_Mutation | c.235A>T | p.Met79Leu | p.M79L | Q96DE5 | protein_coding | tolerated_low_confidence(0.11) | benign(0) | TCGA-49-AARE-01 | Lung | lung adenocarcinoma | Female | <65 | I/II | Unknown | Unknown | PD | |
| ANAPC16 | SNV | Missense_Mutation | novel | c.251N>T | p.Gly84Val | p.G84V | Q96DE5 | protein_coding | tolerated_low_confidence(0.06) | benign(0.091) | TCGA-97-8179-01 | Lung | lung adenocarcinoma | Male | >=65 | I/II | Unknown | Unknown | SD |
| Page: 1 |
Top |
Related drugs of malignant transformation related genes |
| Identification of chemicals and drugs interact with genes involved in malignant transfromation |
| (DGIdb 4.0) |
| Entrez ID | Symbol | Category | Interaction Types | Drug Claim Name | Drug Name | PMIDs |
| Page: 1 |

Copyright 2023-Present -The University of Texas Health Science Center at Houston |