
|
|||||
|
 | |
| |
| |
| |
| |
| |
|
Gene: ANAPC10 |
Gene summary for ANAPC10 |
| Gene information | Species | Human | Gene symbol | ANAPC10 | Gene ID | 10393 |
| Gene name | anaphase promoting complex subunit 10 | |
| Gene Alias | APC10 | |
| Cytomap | 4q31.21 | |
| Gene Type | protein-coding | GO ID | GO:0000209 | UniProtAcc | Q9UM13 |
Top |
Malignant transformation analysis |
| Identification of the aberrant gene expression in precancerous and cancerous lesions by comparing the gene expression of stem-like cells in diseased tissues with normal stem cells |
| Entrez ID | Symbol | Replicates | Species | Organ | Tissue | Adj P-value | Log2FC | Malignancy |
| 10393 | ANAPC10 | LZE4T | Human | Esophagus | ESCC | 1.70e-13 | 2.80e-01 | 0.0811 |
| 10393 | ANAPC10 | LZE7T | Human | Esophagus | ESCC | 1.59e-08 | 2.88e-01 | 0.0667 |
| 10393 | ANAPC10 | LZE8T | Human | Esophagus | ESCC | 2.88e-04 | 1.43e-01 | 0.067 |
| 10393 | ANAPC10 | LZE20T | Human | Esophagus | ESCC | 2.63e-06 | 1.51e-01 | 0.0662 |
| 10393 | ANAPC10 | LZE22T | Human | Esophagus | ESCC | 2.23e-04 | 2.89e-01 | 0.068 |
| 10393 | ANAPC10 | LZE24T | Human | Esophagus | ESCC | 7.38e-15 | 2.33e-01 | 0.0596 |
| 10393 | ANAPC10 | LZE6T | Human | Esophagus | ESCC | 1.19e-05 | 3.22e-01 | 0.0845 |
| 10393 | ANAPC10 | P1T-E | Human | Esophagus | ESCC | 1.87e-07 | 2.49e-01 | 0.0875 |
| 10393 | ANAPC10 | P2T-E | Human | Esophagus | ESCC | 2.86e-26 | 4.53e-01 | 0.1177 |
| 10393 | ANAPC10 | P4T-E | Human | Esophagus | ESCC | 2.07e-19 | 2.82e-01 | 0.1323 |
| 10393 | ANAPC10 | P5T-E | Human | Esophagus | ESCC | 2.99e-20 | 2.33e-01 | 0.1327 |
| 10393 | ANAPC10 | P8T-E | Human | Esophagus | ESCC | 1.21e-21 | 3.91e-01 | 0.0889 |
| 10393 | ANAPC10 | P9T-E | Human | Esophagus | ESCC | 3.94e-10 | 1.30e-01 | 0.1131 |
| 10393 | ANAPC10 | P10T-E | Human | Esophagus | ESCC | 3.71e-17 | 3.13e-01 | 0.116 |
| 10393 | ANAPC10 | P11T-E | Human | Esophagus | ESCC | 4.73e-11 | 3.94e-01 | 0.1426 |
| 10393 | ANAPC10 | P12T-E | Human | Esophagus | ESCC | 6.22e-29 | 6.52e-01 | 0.1122 |
| 10393 | ANAPC10 | P15T-E | Human | Esophagus | ESCC | 1.29e-19 | 3.83e-01 | 0.1149 |
| 10393 | ANAPC10 | P16T-E | Human | Esophagus | ESCC | 8.79e-16 | 3.23e-01 | 0.1153 |
| 10393 | ANAPC10 | P17T-E | Human | Esophagus | ESCC | 8.05e-10 | 1.92e-01 | 0.1278 |
| 10393 | ANAPC10 | P20T-E | Human | Esophagus | ESCC | 2.40e-20 | 2.33e-01 | 0.1124 |
| Page: 1 2 3 4 5 |
| Tissue | Expression Dynamics | Abbreviation |
| Esophagus | 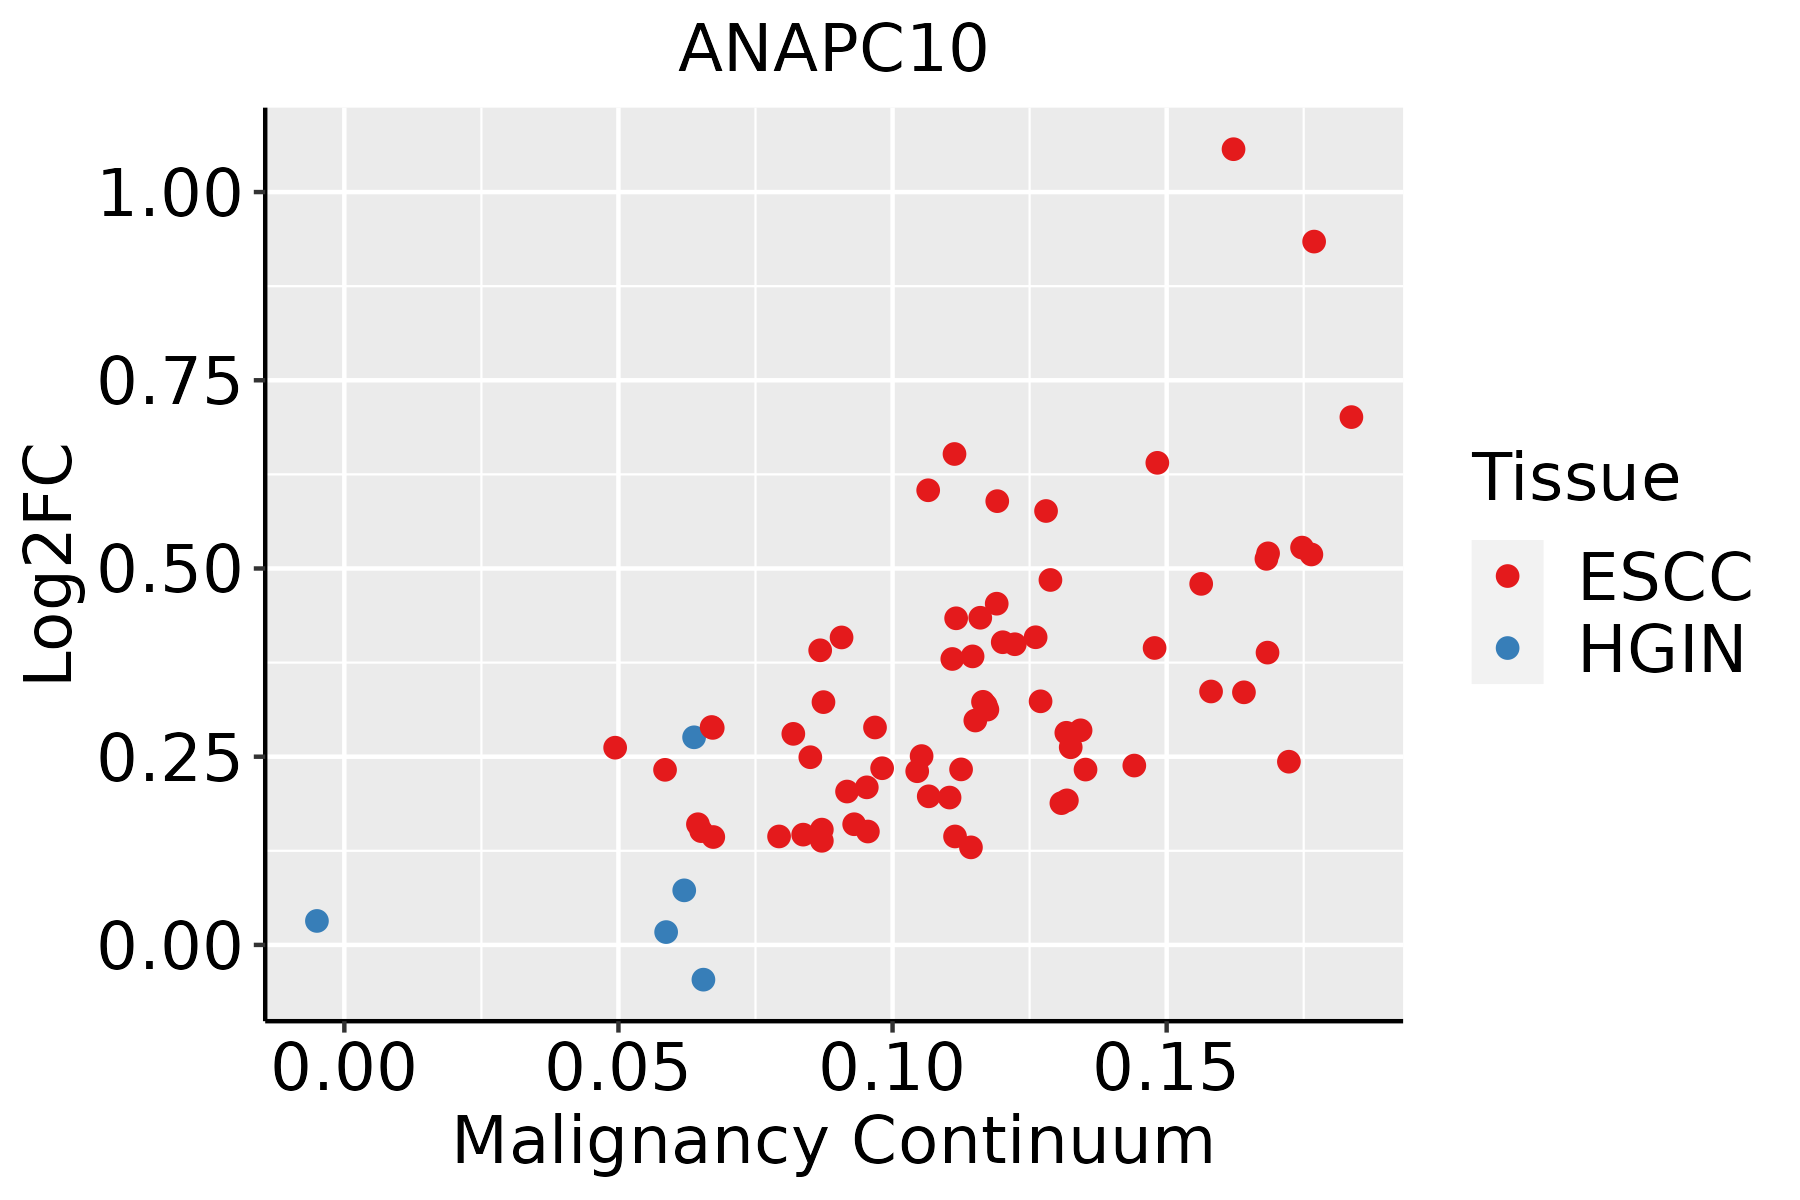 | ESCC: Esophageal squamous cell carcinoma |
| HGIN: High-grade intraepithelial neoplasias | ||
| LGIN: Low-grade intraepithelial neoplasias | ||
| Oral Cavity | 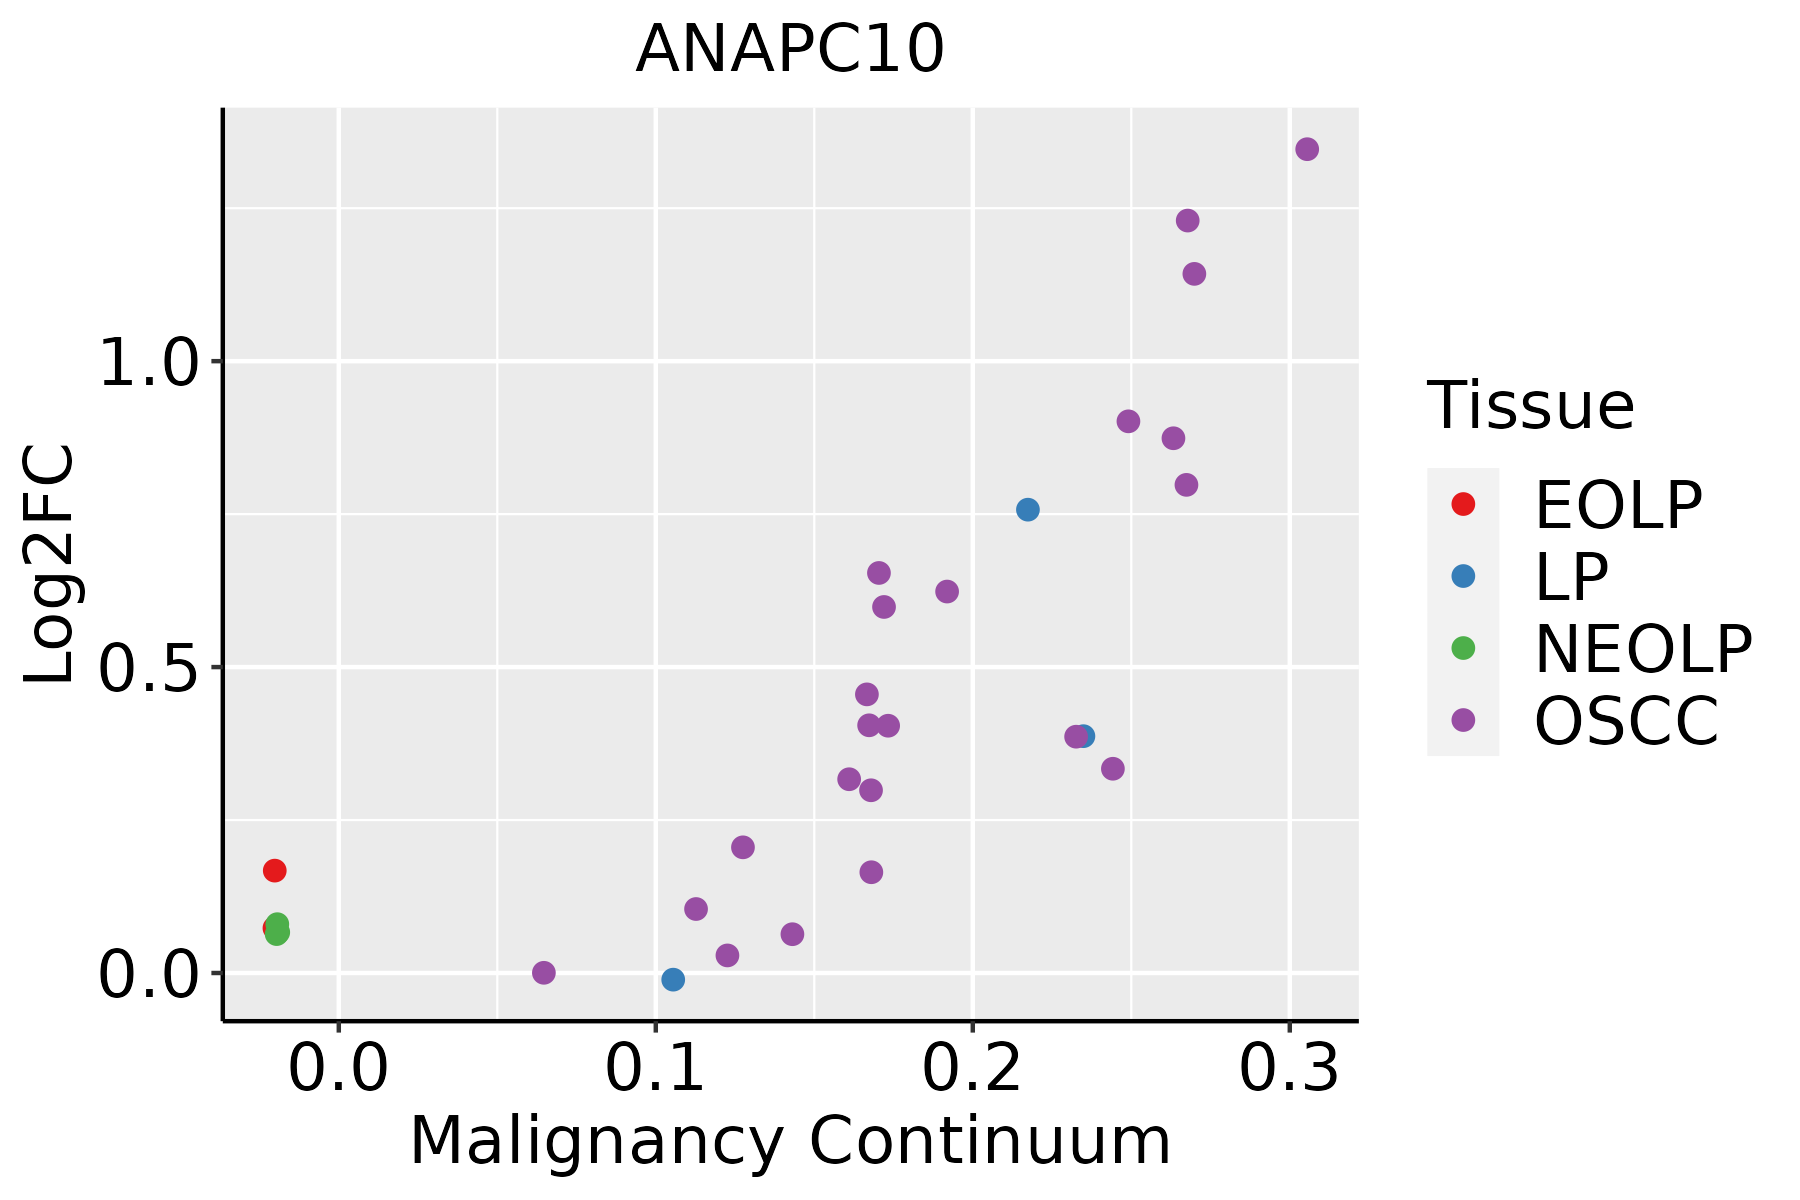 | EOLP: Erosive Oral lichen planus |
| LP: leukoplakia | ||
| NEOLP: Non-erosive oral lichen planus | ||
| OSCC: Oral squamous cell carcinoma | ||
| Skin |  | AK: Actinic keratosis |
| cSCC: Cutaneous squamous cell carcinoma | ||
| SCCIS:squamous cell carcinoma in situ |
| ∗log2FC in expression of this searched gene in stem-like cells from each diseased tissue sample relative to stem-like cells in normal samples in each tissue plotted against the malignancy continuum. Samples are colored based on if they are from different disease stage. |
Top |
Malignant transformation related pathway analysis |
| Find out the enriched GO biological processes and KEGG pathways involved in transition from healthy to precancer to cancer |
| Tissue | Disease Stage | Enriched GO biological Processes |
| Colorectum | AD |  |
| Colorectum | SER |  |
| Colorectum | MSS |  |
| Colorectum | MSI-H |  |
| Colorectum | FAP |  |
| ∗Top 15 enriched GO BP terms are showed in the bar plot of each disease state in each tissue. Each row represents a significant GO biological process which is colored according to the -log10(p.adjust). |
| Page: 1 2 3 4 5 6 7 8 9 |
| GO ID | Tissue | Disease Stage | Description | Gene Ratio | Bg Ratio | pvalue | p.adjust | Count |
| GO:0010498111 | Esophagus | ESCC | proteasomal protein catabolic process | 369/8552 | 490/18723 | 1.13e-41 | 1.80e-38 | 369 |
| GO:0043161111 | Esophagus | ESCC | proteasome-mediated ubiquitin-dependent protein catabolic process | 312/8552 | 412/18723 | 3.53e-36 | 4.48e-33 | 312 |
| GO:000020917 | Esophagus | ESCC | protein polyubiquitination | 170/8552 | 236/18723 | 1.40e-16 | 1.09e-14 | 170 |
| GO:007097912 | Esophagus | ESCC | protein K11-linked ubiquitination | 27/8552 | 29/18723 | 8.09e-08 | 1.39e-06 | 27 |
| GO:00311451 | Esophagus | ESCC | anaphase-promoting complex-dependent catabolic process | 18/8552 | 21/18723 | 1.81e-04 | 1.16e-03 | 18 |
| GO:001049820 | Oral cavity | OSCC | proteasomal protein catabolic process | 336/7305 | 490/18723 | 5.45e-41 | 8.63e-38 | 336 |
| GO:004316120 | Oral cavity | OSCC | proteasome-mediated ubiquitin-dependent protein catabolic process | 285/7305 | 412/18723 | 5.68e-36 | 5.99e-33 | 285 |
| GO:000020910 | Oral cavity | OSCC | protein polyubiquitination | 150/7305 | 236/18723 | 1.59e-14 | 9.27e-13 | 150 |
| GO:00709793 | Oral cavity | OSCC | protein K11-linked ubiquitination | 26/7305 | 29/18723 | 2.05e-08 | 4.01e-07 | 26 |
| GO:0031145 | Oral cavity | OSCC | anaphase-promoting complex-dependent catabolic process | 16/7305 | 21/18723 | 5.99e-04 | 3.39e-03 | 16 |
| GO:001049825 | Oral cavity | EOLP | proteasomal protein catabolic process | 108/2218 | 490/18723 | 7.79e-11 | 9.51e-09 | 108 |
| GO:000020923 | Oral cavity | EOLP | protein polyubiquitination | 62/2218 | 236/18723 | 7.88e-10 | 5.90e-08 | 62 |
| GO:004316125 | Oral cavity | EOLP | proteasome-mediated ubiquitin-dependent protein catabolic process | 92/2218 | 412/18723 | 9.87e-10 | 6.96e-08 | 92 |
| GO:00709792 | Oral cavity | EOLP | protein K11-linked ubiquitination | 9/2218 | 29/18723 | 4.94e-03 | 2.62e-02 | 9 |
| GO:001049828 | Skin | cSCC | proteasomal protein catabolic process | 243/4864 | 490/18723 | 7.85e-30 | 4.10e-27 | 243 |
| GO:004316128 | Skin | cSCC | proteasome-mediated ubiquitin-dependent protein catabolic process | 205/4864 | 412/18723 | 1.46e-25 | 4.16e-23 | 205 |
| GO:000020924 | Skin | cSCC | protein polyubiquitination | 103/4864 | 236/18723 | 2.57e-09 | 9.09e-08 | 103 |
| GO:00709795 | Skin | cSCC | protein K11-linked ubiquitination | 19/4864 | 29/18723 | 8.84e-06 | 1.17e-04 | 19 |
| GO:00311452 | Skin | cSCC | anaphase-promoting complex-dependent catabolic process | 12/4864 | 21/18723 | 2.40e-03 | 1.38e-02 | 12 |
| Page: 1 |
| Pathway ID | Tissue | Disease Stage | Description | Gene Ratio | Bg Ratio | pvalue | p.adjust | qvalue | Count |
| hsa0412027 | Esophagus | ESCC | Ubiquitin mediated proteolysis | 122/4205 | 142/8465 | 6.53e-20 | 7.29e-18 | 3.74e-18 | 122 |
| hsa0411023 | Esophagus | ESCC | Cell cycle | 126/4205 | 157/8465 | 1.34e-15 | 5.60e-14 | 2.87e-14 | 126 |
| hsa05166211 | Esophagus | ESCC | Human T-cell leukemia virus 1 infection | 164/4205 | 222/8465 | 8.13e-14 | 2.09e-12 | 1.07e-12 | 164 |
| hsa041146 | Esophagus | ESCC | Oocyte meiosis | 77/4205 | 131/8465 | 2.19e-02 | 4.80e-02 | 2.46e-02 | 77 |
| hsa0412036 | Esophagus | ESCC | Ubiquitin mediated proteolysis | 122/4205 | 142/8465 | 6.53e-20 | 7.29e-18 | 3.74e-18 | 122 |
| hsa0411033 | Esophagus | ESCC | Cell cycle | 126/4205 | 157/8465 | 1.34e-15 | 5.60e-14 | 2.87e-14 | 126 |
| hsa05166310 | Esophagus | ESCC | Human T-cell leukemia virus 1 infection | 164/4205 | 222/8465 | 8.13e-14 | 2.09e-12 | 1.07e-12 | 164 |
| hsa0411411 | Esophagus | ESCC | Oocyte meiosis | 77/4205 | 131/8465 | 2.19e-02 | 4.80e-02 | 2.46e-02 | 77 |
| hsa041108 | Oral cavity | OSCC | Cell cycle | 118/3704 | 157/8465 | 7.15e-16 | 2.66e-14 | 1.35e-14 | 118 |
| hsa0412020 | Oral cavity | OSCC | Ubiquitin mediated proteolysis | 105/3704 | 142/8465 | 1.83e-13 | 4.37e-12 | 2.23e-12 | 105 |
| hsa0516630 | Oral cavity | OSCC | Human T-cell leukemia virus 1 infection | 150/3704 | 222/8465 | 3.68e-13 | 7.26e-12 | 3.70e-12 | 150 |
| hsa04114 | Oral cavity | OSCC | Oocyte meiosis | 74/3704 | 131/8465 | 2.13e-03 | 5.75e-03 | 2.92e-03 | 74 |
| hsa0411015 | Oral cavity | OSCC | Cell cycle | 118/3704 | 157/8465 | 7.15e-16 | 2.66e-14 | 1.35e-14 | 118 |
| hsa04120110 | Oral cavity | OSCC | Ubiquitin mediated proteolysis | 105/3704 | 142/8465 | 1.83e-13 | 4.37e-12 | 2.23e-12 | 105 |
| hsa05166113 | Oral cavity | OSCC | Human T-cell leukemia virus 1 infection | 150/3704 | 222/8465 | 3.68e-13 | 7.26e-12 | 3.70e-12 | 150 |
| hsa041141 | Oral cavity | OSCC | Oocyte meiosis | 74/3704 | 131/8465 | 2.13e-03 | 5.75e-03 | 2.92e-03 | 74 |
| hsa0516644 | Oral cavity | EOLP | Human T-cell leukemia virus 1 infection | 64/1218 | 222/8465 | 1.37e-08 | 1.83e-07 | 1.08e-07 | 64 |
| hsa0516654 | Oral cavity | EOLP | Human T-cell leukemia virus 1 infection | 64/1218 | 222/8465 | 1.37e-08 | 1.83e-07 | 1.08e-07 | 64 |
| Page: 1 |
Top |
Cell-cell communication analysis |
| Identification of potential cell-cell interactions between two cell types and their ligand-receptor pairs for different disease states |
| Ligand | Receptor | LRpair | Pathway | Tissue | Disease Stage |
| Page: 1 |
Top |
Single-cell gene regulatory network inference analysis |
| Find out the significant the regulons (TFs) and the target genes of each regulon across cell types for different disease states |
| TF | Cell Type | Tissue | Disease Stage | Target Gene | RSS | Regulon Activity |
| ∗The dot plots of a searched regulon are shown for all cell subpopulations in each disease state of each tissue based on the regulon specific score inferred using pySCENIC and by calculating the average expression. |
| Page: 1 |
Top |
Somatic mutation of malignant transformation related genes |
| Annotation of somatic variants for genes involved in malignant transformation |
| Hugo Symbol | Variant Class | Variant Classification | dbSNP RS | HGVSc | HGVSp | HGVSp Short | SWISSPROT | BIOTYPE | SIFT | PolyPhen | Tumor Sample Barcode | Tissue | Histology | Sex | Age | Stage | Therapy Types | Drugs | Outcome |
| ANAPC10 | SNV | Missense_Mutation | c.220N>A | p.Val74Met | p.V74M | Q9UM13 | protein_coding | deleterious(0.04) | possibly_damaging(0.857) | TCGA-C8-A274-01 | Breast | breast invasive carcinoma | Female | <65 | I/II | Hormone Therapy | tamoxiphen | SD | |
| ANAPC10 | SNV | Missense_Mutation | novel | c.497N>G | p.Ser166Cys | p.S166C | Q9UM13 | protein_coding | tolerated(0.18) | possibly_damaging(0.563) | TCGA-MA-AA3Z-01 | Cervix | cervical & endocervical cancer | Female | <65 | I/II | Unknown | Unknown | SD |
| ANAPC10 | insertion | In_Frame_Ins | novel | c.403_404insACA | p.Phe135delinsTyrIle | p.F135delinsYI | Q9UM13 | protein_coding | TCGA-AM-5820-01 | Colorectum | colon adenocarcinoma | Female | <65 | I/II | Unknown | Unknown | SD | ||
| ANAPC10 | insertion | Frame_Shift_Ins | novel | c.401_402insCTTATTGAACG | p.Phe135LeufsTer6 | p.F135Lfs*6 | Q9UM13 | protein_coding | TCGA-AM-5820-01 | Colorectum | colon adenocarcinoma | Female | <65 | I/II | Unknown | Unknown | SD | ||
| ANAPC10 | SNV | Missense_Mutation | c.545G>A | p.Arg182His | p.R182H | Q9UM13 | protein_coding | tolerated(0.16) | benign(0.003) | TCGA-A5-A0G2-01 | Endometrium | uterine corpus endometrioid carcinoma | Female | <65 | III/IV | Unknown | Unknown | SD | |
| ANAPC10 | SNV | Missense_Mutation | novel | c.279N>T | p.Lys93Asn | p.K93N | Q9UM13 | protein_coding | deleterious(0.01) | possibly_damaging(0.741) | TCGA-A5-A2K5-01 | Endometrium | uterine corpus endometrioid carcinoma | Female | >=65 | I/II | Unknown | Unknown | SD |
| ANAPC10 | SNV | Missense_Mutation | novel | c.129N>G | p.Asp43Glu | p.D43E | Q9UM13 | protein_coding | tolerated(0.62) | benign(0.012) | TCGA-AP-A059-01 | Endometrium | uterine corpus endometrioid carcinoma | Female | >=65 | I/II | Unknown | Unknown | SD |
| ANAPC10 | SNV | Missense_Mutation | novel | c.492G>T | p.Glu164Asp | p.E164D | Q9UM13 | protein_coding | tolerated(0.99) | benign(0.01) | TCGA-BK-A6W3-01 | Endometrium | uterine corpus endometrioid carcinoma | Female | <65 | I/II | Unknown | Unknown | SD |
| ANAPC10 | SNV | Missense_Mutation | novel | c.353G>T | p.Gly118Val | p.G118V | Q9UM13 | protein_coding | deleterious(0.02) | probably_damaging(0.997) | TCGA-E6-A1LX-01 | Endometrium | uterine corpus endometrioid carcinoma | Female | <65 | I/II | Unknown | Unknown | SD |
| ANAPC10 | SNV | Missense_Mutation | novel | c.154A>G | p.Thr52Ala | p.T52A | Q9UM13 | protein_coding | deleterious(0) | possibly_damaging(0.804) | TCGA-E6-A1LX-01 | Endometrium | uterine corpus endometrioid carcinoma | Female | <65 | I/II | Unknown | Unknown | SD |
| Page: 1 2 |
Top |
Related drugs of malignant transformation related genes |
| Identification of chemicals and drugs interact with genes involved in malignant transfromation |
| (DGIdb 4.0) |
| Entrez ID | Symbol | Category | Interaction Types | Drug Claim Name | Drug Name | PMIDs |
| Page: 1 |

Copyright 2023-Present -The University of Texas Health Science Center at Houston |