
|
|||||
|
 | |
| |
| |
| |
| |
| |
|
Gene: AMTN |
Gene summary for AMTN |
| Gene information | Species | Human | Gene symbol | AMTN | Gene ID | 401138 |
| Gene name | amelotin | |
| Gene Alias | AI3B | |
| Cytomap | 4q13.3 | |
| Gene Type | protein-coding | GO ID | GO:0007155 | UniProtAcc | Q6UX39 |
Top |
Malignant transformation analysis |
| Identification of the aberrant gene expression in precancerous and cancerous lesions by comparing the gene expression of stem-like cells in diseased tissues with normal stem cells |
| Entrez ID | Symbol | Replicates | Species | Organ | Tissue | Adj P-value | Log2FC | Malignancy |
| 401138 | AMTN | P10T-E | Human | Esophagus | ESCC | 7.92e-69 | 3.29e+00 | 0.116 |
| 401138 | AMTN | P11T-E | Human | Esophagus | ESCC | 9.33e-27 | 3.80e+00 | 0.1426 |
| 401138 | AMTN | P12T-E | Human | Esophagus | ESCC | 2.05e-07 | 6.24e-01 | 0.1122 |
| 401138 | AMTN | P21T-E | Human | Esophagus | ESCC | 7.98e-13 | 8.84e-01 | 0.1617 |
| 401138 | AMTN | P24T-E | Human | Esophagus | ESCC | 9.20e-06 | 6.50e-01 | 0.1287 |
| 401138 | AMTN | P31T-E | Human | Esophagus | ESCC | 2.22e-126 | 5.47e+00 | 0.1251 |
| 401138 | AMTN | P37T-E | Human | Esophagus | ESCC | 1.93e-09 | 1.44e+00 | 0.1371 |
| 401138 | AMTN | P61T-E | Human | Esophagus | ESCC | 1.58e-35 | 3.18e+00 | 0.099 |
| 401138 | AMTN | P62T-E | Human | Esophagus | ESCC | 2.57e-05 | 7.67e-01 | 0.1302 |
| 401138 | AMTN | P76T-E | Human | Esophagus | ESCC | 4.30e-10 | 3.28e+00 | 0.1207 |
| 401138 | AMTN | P89T-E | Human | Esophagus | ESCC | 6.22e-10 | 1.78e+00 | 0.1752 |
| 401138 | AMTN | P107T-E | Human | Esophagus | ESCC | 3.10e-79 | 6.15e+00 | 0.171 |
| 401138 | AMTN | C04 | Human | Oral cavity | OSCC | 5.33e-05 | 3.67e-01 | 0.2633 |
| 401138 | AMTN | C30 | Human | Oral cavity | OSCC | 2.05e-24 | 3.43e+00 | 0.3055 |
| 401138 | AMTN | C38 | Human | Oral cavity | OSCC | 5.89e-10 | 3.87e+00 | 0.172 |
| 401138 | AMTN | C43 | Human | Oral cavity | OSCC | 1.52e-02 | 1.07e+00 | 0.1704 |
| 401138 | AMTN | C51 | Human | Oral cavity | OSCC | 9.47e-34 | 3.36e+00 | 0.2674 |
| 401138 | AMTN | C57 | Human | Oral cavity | OSCC | 6.45e-05 | 4.13e-01 | 0.1679 |
| 401138 | AMTN | C06 | Human | Oral cavity | OSCC | 3.63e-07 | 3.39e+00 | 0.2699 |
| 401138 | AMTN | C08 | Human | Oral cavity | OSCC | 1.01e-03 | 1.31e+00 | 0.1919 |
| Page: 1 2 |
| Tissue | Expression Dynamics | Abbreviation |
| Esophagus | 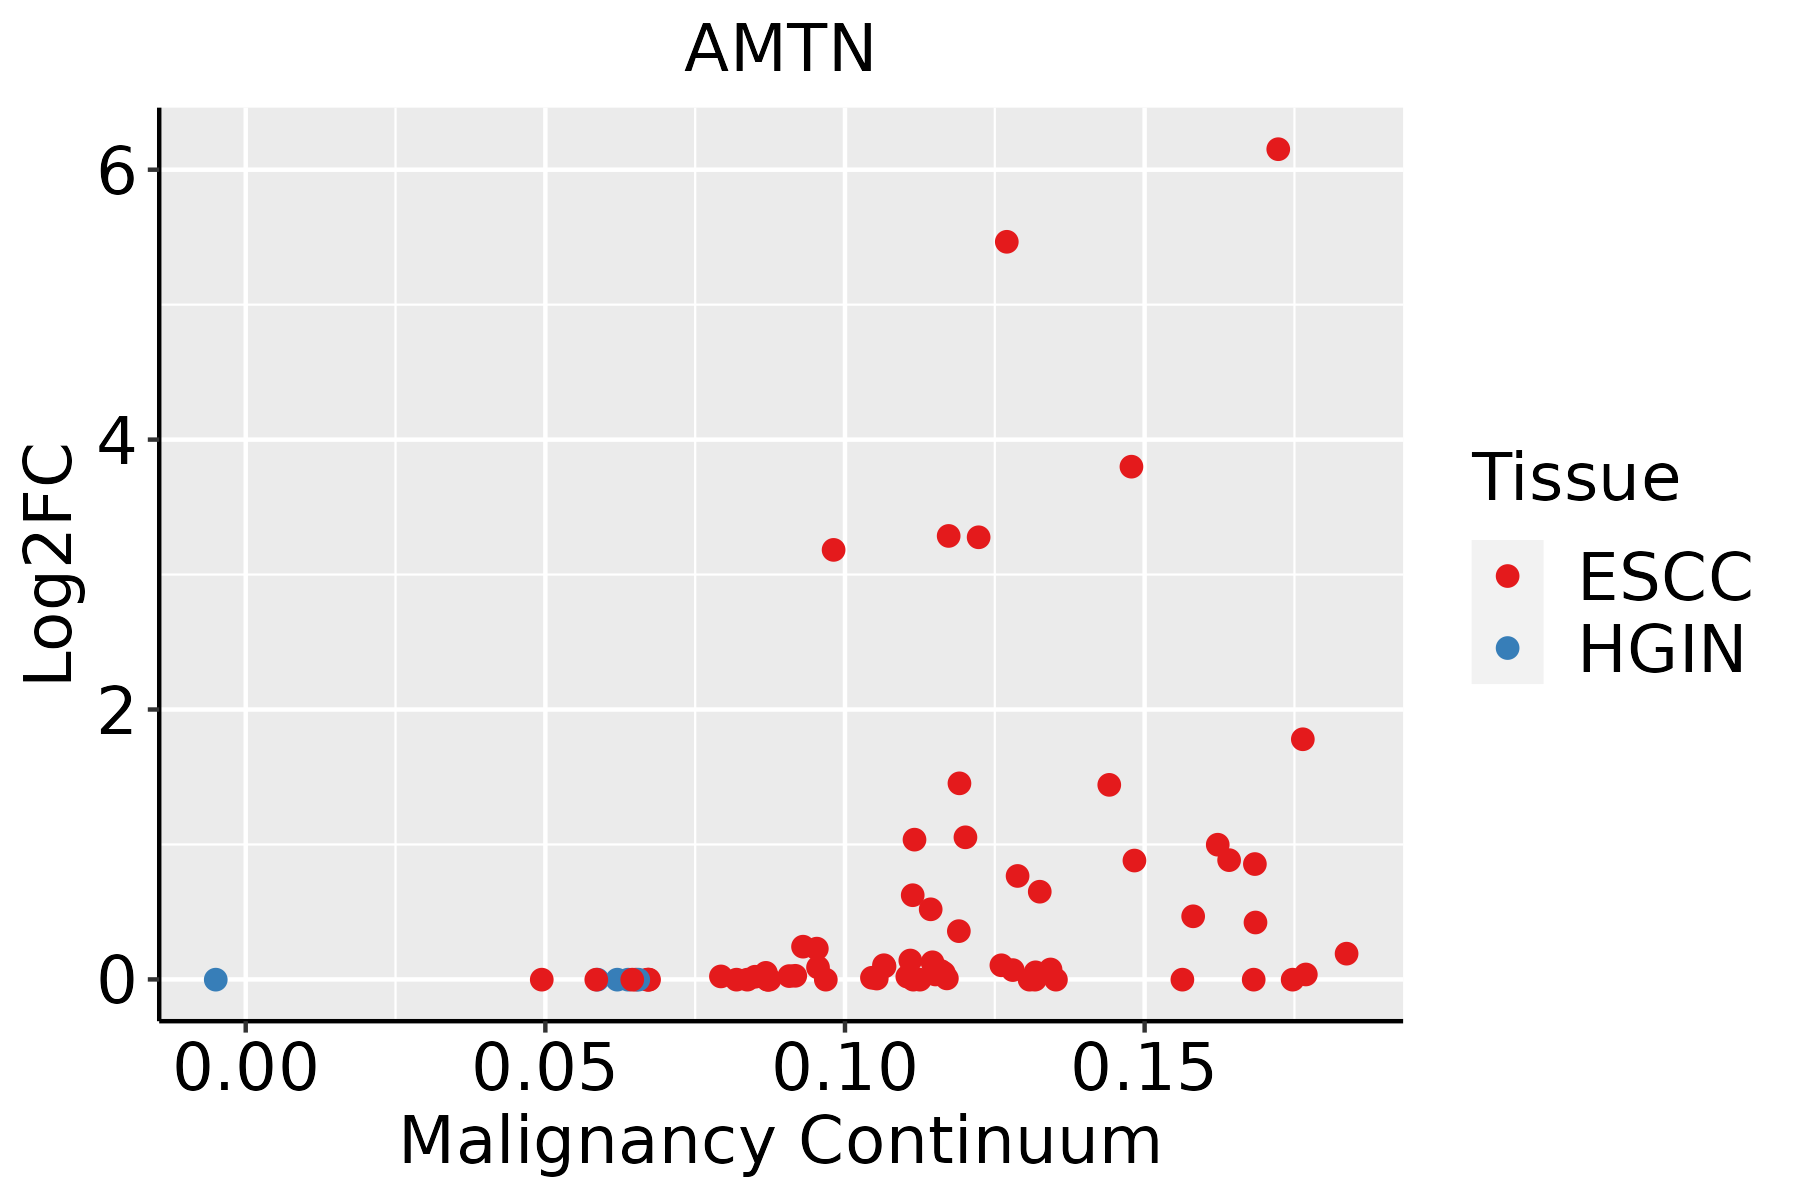 | ESCC: Esophageal squamous cell carcinoma |
| HGIN: High-grade intraepithelial neoplasias | ||
| LGIN: Low-grade intraepithelial neoplasias | ||
| Oral Cavity | 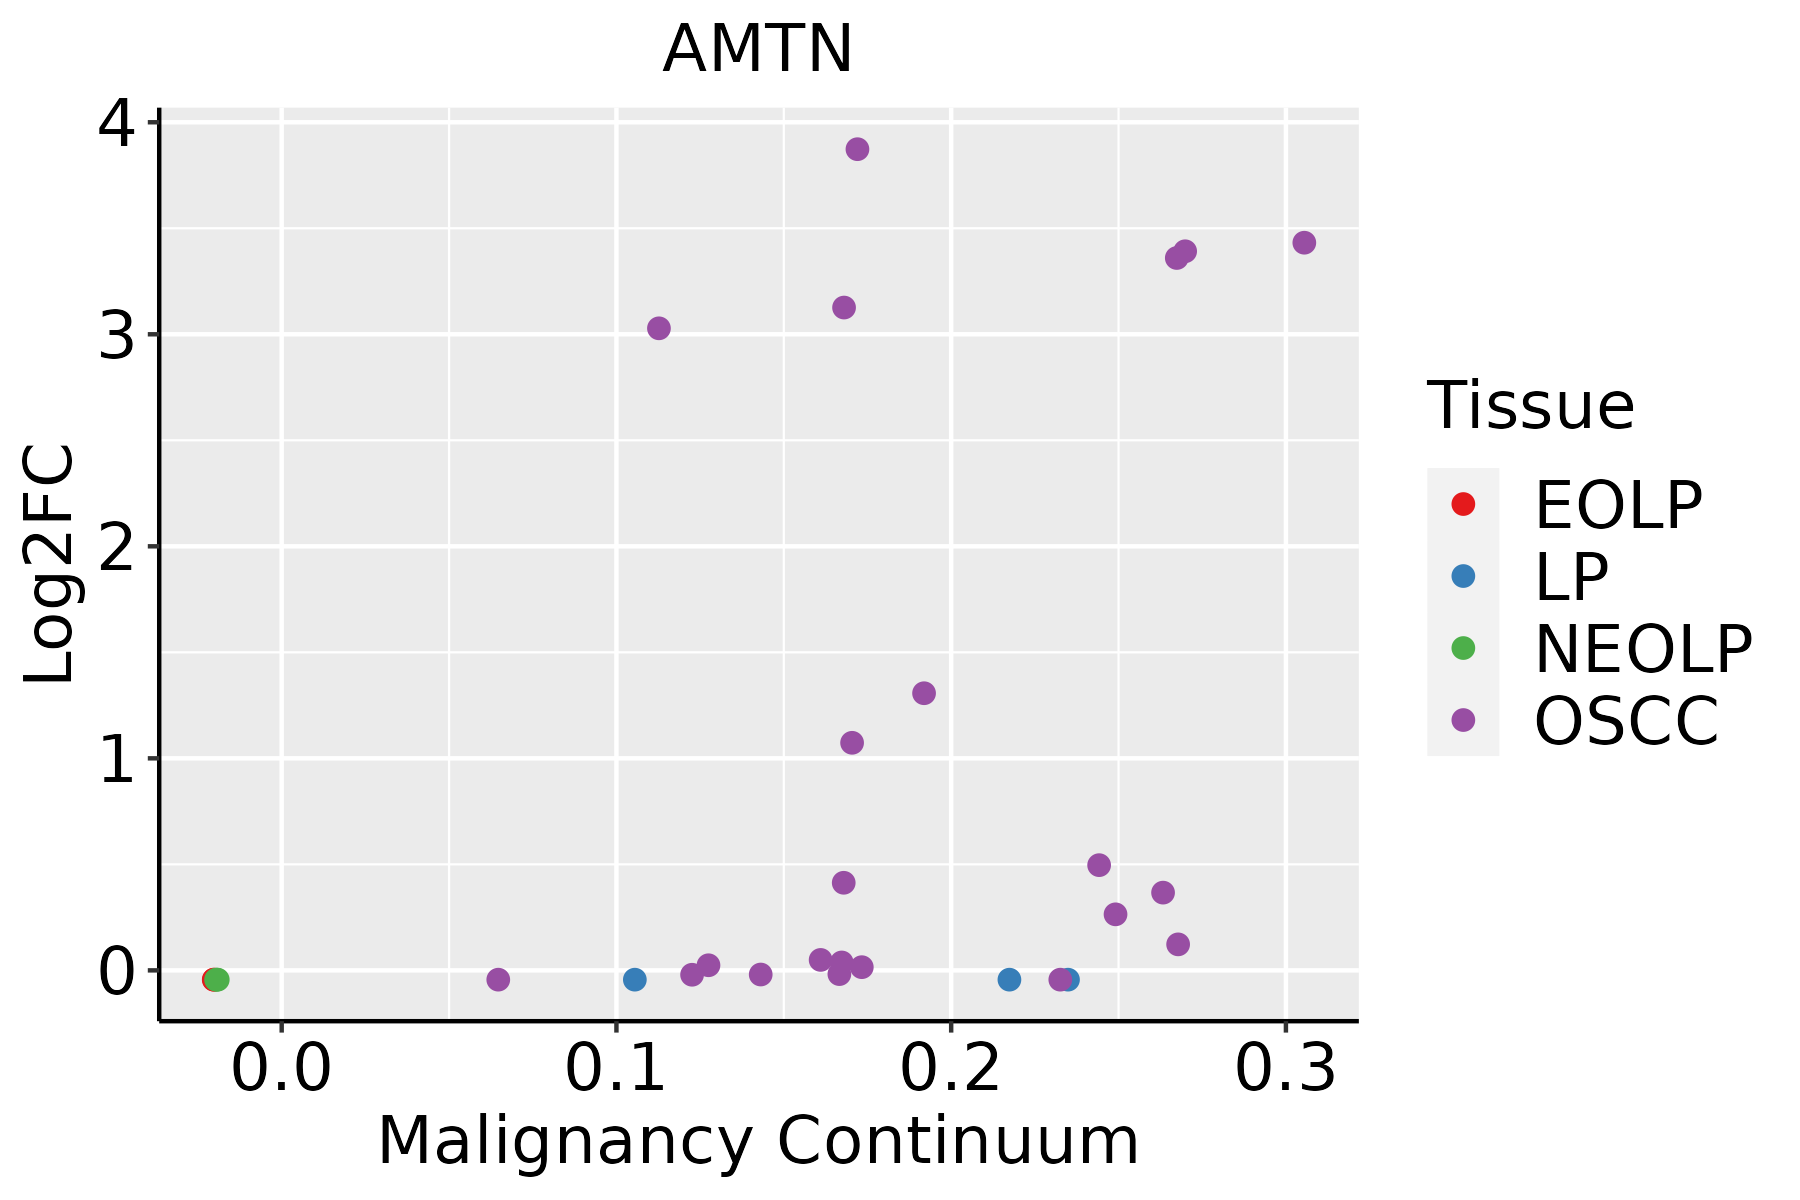 | EOLP: Erosive Oral lichen planus |
| LP: leukoplakia | ||
| NEOLP: Non-erosive oral lichen planus | ||
| OSCC: Oral squamous cell carcinoma |
| ∗log2FC in expression of this searched gene in stem-like cells from each diseased tissue sample relative to stem-like cells in normal samples in each tissue plotted against the malignancy continuum. Samples are colored based on if they are from different disease stage. |
Top |
Malignant transformation related pathway analysis |
| Find out the enriched GO biological processes and KEGG pathways involved in transition from healthy to precancer to cancer |
| Tissue | Disease Stage | Enriched GO biological Processes |
| Colorectum | AD |  |
| Colorectum | SER |  |
| Colorectum | MSS |  |
| Colorectum | MSI-H |  |
| Colorectum | FAP |  |
| ∗Top 15 enriched GO BP terms are showed in the bar plot of each disease state in each tissue. Each row represents a significant GO biological process which is colored according to the -log10(p.adjust). |
| Page: 1 2 3 4 5 6 7 8 9 |
| GO ID | Tissue | Disease Stage | Description | Gene Ratio | Bg Ratio | pvalue | p.adjust | Count |
| Page: 1 |
| Pathway ID | Tissue | Disease Stage | Description | Gene Ratio | Bg Ratio | pvalue | p.adjust | qvalue | Count |
| Page: 1 |
Top |
Cell-cell communication analysis |
| Identification of potential cell-cell interactions between two cell types and their ligand-receptor pairs for different disease states |
| Ligand | Receptor | LRpair | Pathway | Tissue | Disease Stage |
| Page: 1 |
Top |
Single-cell gene regulatory network inference analysis |
| Find out the significant the regulons (TFs) and the target genes of each regulon across cell types for different disease states |
| TF | Cell Type | Tissue | Disease Stage | Target Gene | RSS | Regulon Activity |
| ∗The dot plots of a searched regulon are shown for all cell subpopulations in each disease state of each tissue based on the regulon specific score inferred using pySCENIC and by calculating the average expression. |
| Page: 1 |
Top |
Somatic mutation of malignant transformation related genes |
| Annotation of somatic variants for genes involved in malignant transformation |
| Hugo Symbol | Variant Class | Variant Classification | dbSNP RS | HGVSc | HGVSp | HGVSp Short | SWISSPROT | BIOTYPE | SIFT | PolyPhen | Tumor Sample Barcode | Tissue | Histology | Sex | Age | Stage | Therapy Types | Drugs | Outcome |
| AMTN | SNV | Missense_Mutation | novel | c.80C>A | p.Pro27His | p.P27H | Q6UX39 | protein_coding | deleterious(0) | possibly_damaging(0.789) | TCGA-2W-A8YY-01 | Cervix | cervical & endocervical cancer | Female | <65 | I/II | Chemotherapy | cisplatin | CR |
| AMTN | SNV | Missense_Mutation | c.346N>C | p.Ser116Pro | p.S116P | Q6UX39 | protein_coding | deleterious(0) | probably_damaging(0.998) | TCGA-FU-A3HZ-01 | Cervix | cervical & endocervical cancer | Female | <65 | I/II | Chemotherapy | cisplatin | CR | |
| AMTN | SNV | Missense_Mutation | novel | c.518N>T | p.Pro173Leu | p.P173L | Q6UX39 | protein_coding | tolerated(0.06) | benign(0.382) | TCGA-AA-3947-01 | Colorectum | colon adenocarcinoma | Female | <65 | I/II | Unknown | Unknown | SD |
| AMTN | SNV | Missense_Mutation | novel | c.267N>T | p.Leu89Phe | p.L89F | Q6UX39 | protein_coding | deleterious(0.01) | possibly_damaging(0.901) | TCGA-AJ-A3EL-01 | Endometrium | uterine corpus endometrioid carcinoma | Female | <65 | I/II | Unknown | Unknown | SD |
| AMTN | SNV | Missense_Mutation | c.575N>T | p.Arg192Met | p.R192M | Q6UX39 | protein_coding | deleterious(0) | probably_damaging(0.947) | TCGA-AP-A056-01 | Endometrium | uterine corpus endometrioid carcinoma | Female | <65 | I/II | Unknown | Unknown | SD | |
| AMTN | SNV | Missense_Mutation | novel | c.559C>T | p.Pro187Ser | p.P187S | Q6UX39 | protein_coding | deleterious(0.01) | possibly_damaging(0.881) | TCGA-EO-A22U-01 | Endometrium | uterine corpus endometrioid carcinoma | Female | >=65 | I/II | Unknown | Unknown | SD |
| AMTN | SNV | Missense_Mutation | novel | c.369N>A | p.Phe123Leu | p.F123L | Q6UX39 | protein_coding | tolerated(0.2) | benign(0.024) | TCGA-EO-A3B0-01 | Endometrium | uterine corpus endometrioid carcinoma | Female | <65 | III/IV | Unknown | Unknown | SD |
| AMTN | SNV | Missense_Mutation | c.284N>G | p.Leu95Arg | p.L95R | Q6UX39 | protein_coding | deleterious(0) | probably_damaging(0.992) | TCGA-05-4418-01 | Lung | lung adenocarcinoma | Male | >=65 | III/IV | Unknown | Unknown | SD | |
| AMTN | SNV | Missense_Mutation | novel | c.112C>A | p.Leu38Ile | p.L38I | Q6UX39 | protein_coding | tolerated(0.16) | possibly_damaging(0.677) | TCGA-69-A59K-01 | Lung | lung adenocarcinoma | Female | <65 | I/II | Chemotherapy | cisplatin | SD |
| AMTN | SNV | Missense_Mutation | novel | c.396N>A | p.Phe132Leu | p.F132L | Q6UX39 | protein_coding | tolerated(0.15) | benign(0.003) | TCGA-MN-A4N4-01 | Lung | lung adenocarcinoma | Male | <65 | I/II | Unknown | Unknown | SD |
| Page: 1 2 |
Top |
Related drugs of malignant transformation related genes |
| Identification of chemicals and drugs interact with genes involved in malignant transfromation |
| (DGIdb 4.0) |
| Entrez ID | Symbol | Category | Interaction Types | Drug Claim Name | Drug Name | PMIDs |
| Page: 1 |

Copyright 2023-Present -The University of Texas Health Science Center at Houston |