
|
|||||
|
 | |
| |
| |
| |
| |
| |
|
Gene: AMOTL2 |
Gene summary for AMOTL2 |
| Gene information | Species | Human | Gene symbol | AMOTL2 | Gene ID | 51421 |
| Gene name | angiomotin like 2 | |
| Gene Alias | LCCP | |
| Cytomap | 3q22.2 | |
| Gene Type | protein-coding | GO ID | GO:0001525 | UniProtAcc | Q9Y2J4 |
Top |
Malignant transformation analysis |
| Identification of the aberrant gene expression in precancerous and cancerous lesions by comparing the gene expression of stem-like cells in diseased tissues with normal stem cells |
| Entrez ID | Symbol | Replicates | Species | Organ | Tissue | Adj P-value | Log2FC | Malignancy |
| 51421 | AMOTL2 | LZE4T | Human | Esophagus | ESCC | 4.62e-02 | 1.26e-02 | 0.0811 |
| 51421 | AMOTL2 | LZE5T | Human | Esophagus | ESCC | 9.40e-07 | 3.57e-01 | 0.0514 |
| 51421 | AMOTL2 | LZE8T | Human | Esophagus | ESCC | 7.63e-05 | 1.57e-01 | 0.067 |
| 51421 | AMOTL2 | LZE20T | Human | Esophagus | ESCC | 5.03e-04 | 7.82e-02 | 0.0662 |
| 51421 | AMOTL2 | LZE22T | Human | Esophagus | ESCC | 1.75e-04 | 4.99e-01 | 0.068 |
| 51421 | AMOTL2 | LZE24T | Human | Esophagus | ESCC | 4.28e-09 | 5.41e-01 | 0.0596 |
| 51421 | AMOTL2 | P1T-E | Human | Esophagus | ESCC | 3.02e-09 | 8.25e-01 | 0.0875 |
| 51421 | AMOTL2 | P2T-E | Human | Esophagus | ESCC | 1.22e-37 | 8.05e-01 | 0.1177 |
| 51421 | AMOTL2 | P4T-E | Human | Esophagus | ESCC | 5.08e-06 | 8.82e-02 | 0.1323 |
| 51421 | AMOTL2 | P5T-E | Human | Esophagus | ESCC | 1.36e-11 | 3.09e-01 | 0.1327 |
| 51421 | AMOTL2 | P8T-E | Human | Esophagus | ESCC | 8.91e-60 | 1.40e+00 | 0.0889 |
| 51421 | AMOTL2 | P9T-E | Human | Esophagus | ESCC | 8.08e-09 | 2.12e-01 | 0.1131 |
| 51421 | AMOTL2 | P10T-E | Human | Esophagus | ESCC | 3.03e-25 | 6.17e-01 | 0.116 |
| 51421 | AMOTL2 | P11T-E | Human | Esophagus | ESCC | 4.84e-02 | 2.27e-01 | 0.1426 |
| 51421 | AMOTL2 | P12T-E | Human | Esophagus | ESCC | 3.04e-12 | 1.15e-01 | 0.1122 |
| 51421 | AMOTL2 | P15T-E | Human | Esophagus | ESCC | 1.16e-11 | 4.27e-01 | 0.1149 |
| 51421 | AMOTL2 | P16T-E | Human | Esophagus | ESCC | 4.85e-22 | 3.79e-01 | 0.1153 |
| 51421 | AMOTL2 | P21T-E | Human | Esophagus | ESCC | 1.43e-12 | 2.57e-01 | 0.1617 |
| 51421 | AMOTL2 | P22T-E | Human | Esophagus | ESCC | 1.62e-03 | 5.30e-02 | 0.1236 |
| 51421 | AMOTL2 | P23T-E | Human | Esophagus | ESCC | 2.93e-06 | 3.77e-01 | 0.108 |
| Page: 1 2 3 4 5 |
| Tissue | Expression Dynamics | Abbreviation |
| Esophagus |  | ESCC: Esophageal squamous cell carcinoma |
| HGIN: High-grade intraepithelial neoplasias | ||
| LGIN: Low-grade intraepithelial neoplasias | ||
| Oral Cavity | 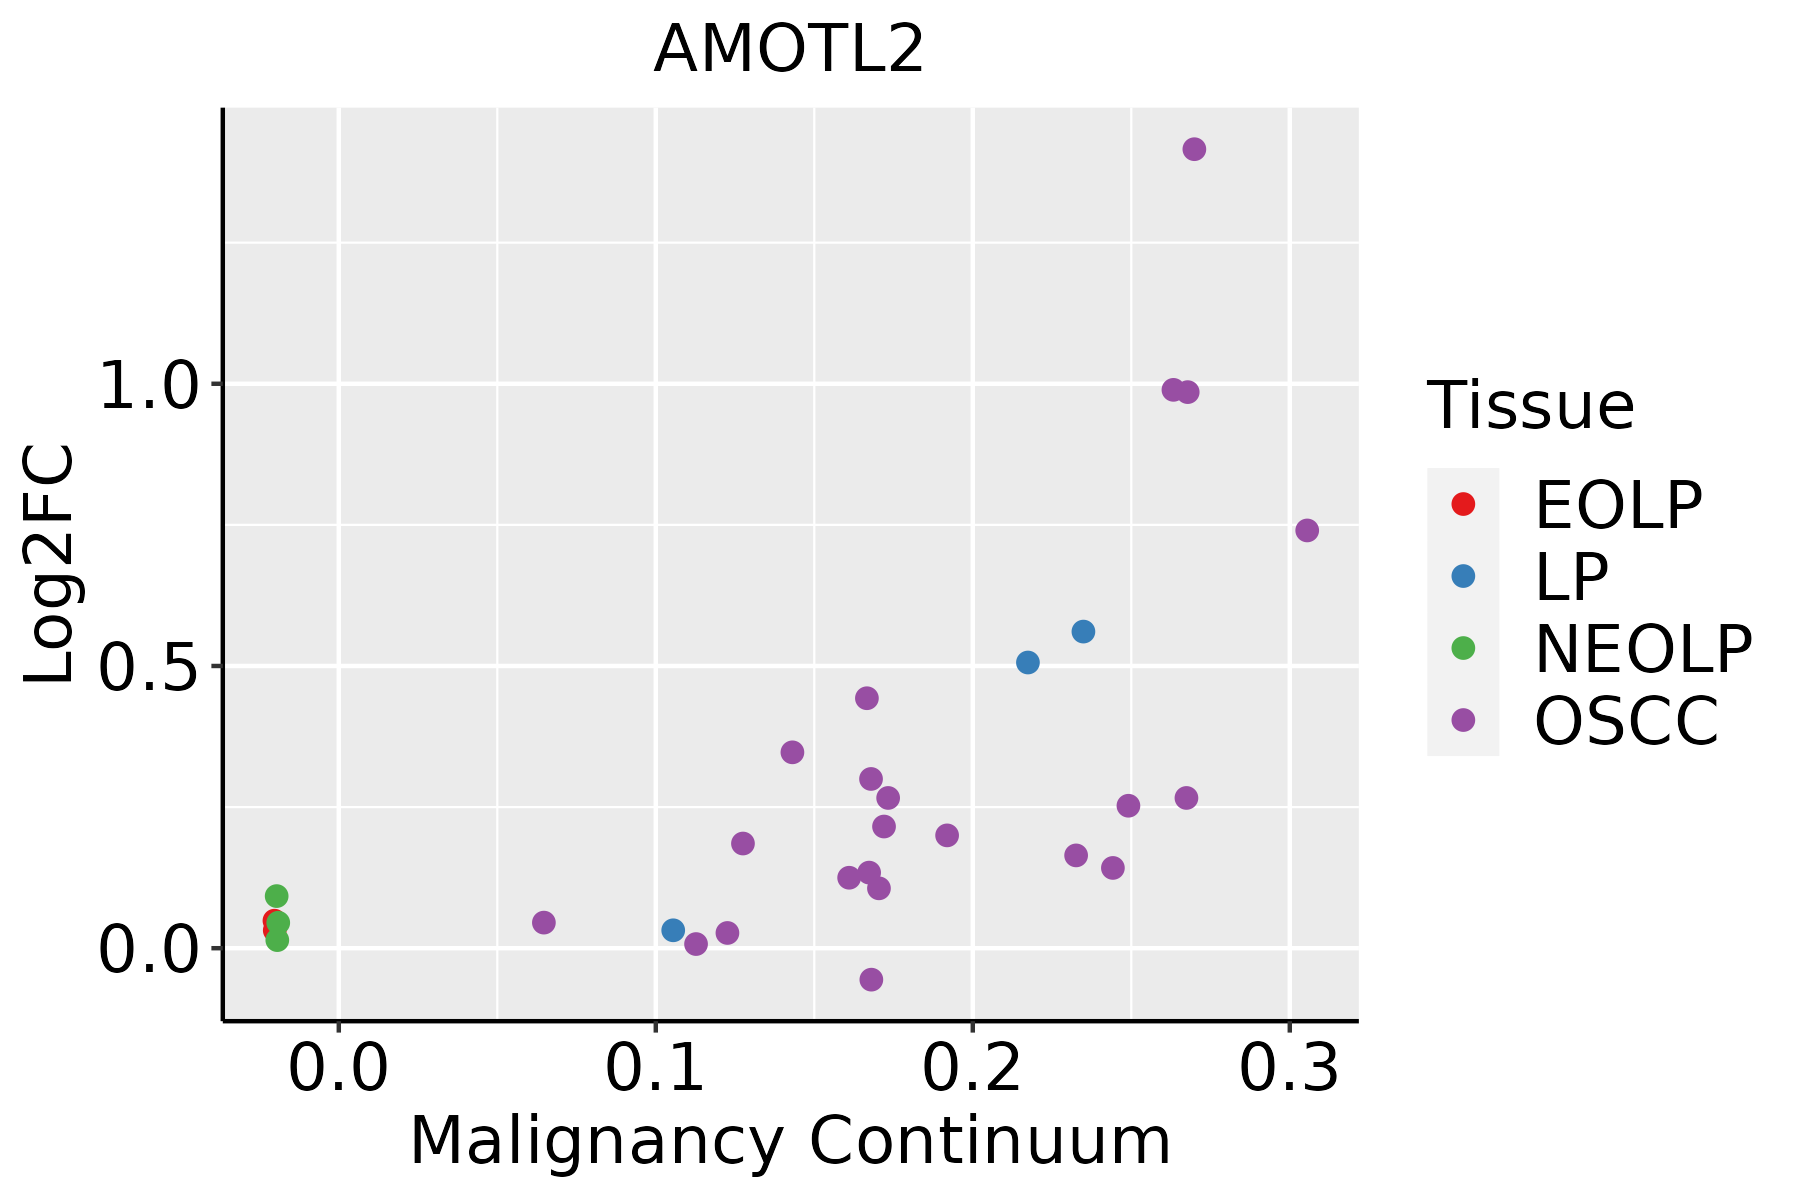 | EOLP: Erosive Oral lichen planus |
| LP: leukoplakia | ||
| NEOLP: Non-erosive oral lichen planus | ||
| OSCC: Oral squamous cell carcinoma | ||
| Thyroid |  | ATC: Anaplastic thyroid cancer |
| HT: Hashimoto's thyroiditis | ||
| PTC: Papillary thyroid cancer |
| ∗log2FC in expression of this searched gene in stem-like cells from each diseased tissue sample relative to stem-like cells in normal samples in each tissue plotted against the malignancy continuum. Samples are colored based on if they are from different disease stage. |
Top |
Malignant transformation related pathway analysis |
| Find out the enriched GO biological processes and KEGG pathways involved in transition from healthy to precancer to cancer |
| Tissue | Disease Stage | Enriched GO biological Processes |
| Colorectum | AD |  |
| Colorectum | SER |  |
| Colorectum | MSS |  |
| Colorectum | MSI-H |  |
| Colorectum | FAP |  |
| ∗Top 15 enriched GO BP terms are showed in the bar plot of each disease state in each tissue. Each row represents a significant GO biological process which is colored according to the -log10(p.adjust). |
| Page: 1 2 3 4 5 6 7 8 9 |
| GO ID | Tissue | Disease Stage | Description | Gene Ratio | Bg Ratio | pvalue | p.adjust | Count |
| GO:001605517 | Esophagus | ESCC | Wnt signaling pathway | 268/8552 | 444/18723 | 2.32e-10 | 6.58e-09 | 268 |
| GO:019873817 | Esophagus | ESCC | cell-cell signaling by wnt | 269/8552 | 446/18723 | 2.41e-10 | 6.79e-09 | 269 |
| GO:000716320 | Esophagus | ESCC | establishment or maintenance of cell polarity | 143/8552 | 218/18723 | 2.05e-09 | 4.65e-08 | 143 |
| GO:003001018 | Esophagus | ESCC | establishment of cell polarity | 96/8552 | 143/18723 | 1.69e-07 | 2.67e-06 | 96 |
| GO:000166720 | Esophagus | ESCC | ameboidal-type cell migration | 250/8552 | 475/18723 | 1.22e-03 | 5.97e-03 | 250 |
| GO:00353297 | Esophagus | ESCC | hippo signaling | 26/8552 | 40/18723 | 1.08e-02 | 3.66e-02 | 26 |
| GO:000716318 | Oral cavity | OSCC | establishment or maintenance of cell polarity | 129/7305 | 218/18723 | 1.16e-09 | 2.86e-08 | 129 |
| GO:001605510 | Oral cavity | OSCC | Wnt signaling pathway | 227/7305 | 444/18723 | 1.10e-07 | 1.87e-06 | 227 |
| GO:019873810 | Oral cavity | OSCC | cell-cell signaling by wnt | 227/7305 | 446/18723 | 1.75e-07 | 2.86e-06 | 227 |
| GO:003001016 | Oral cavity | OSCC | establishment of cell polarity | 82/7305 | 143/18723 | 6.56e-06 | 7.24e-05 | 82 |
| GO:000166719 | Oral cavity | OSCC | ameboidal-type cell migration | 228/7305 | 475/18723 | 3.46e-05 | 3.10e-04 | 228 |
| GO:000716319 | Oral cavity | LP | establishment or maintenance of cell polarity | 79/4623 | 218/18723 | 8.84e-05 | 1.11e-03 | 79 |
| GO:001605515 | Oral cavity | LP | Wnt signaling pathway | 140/4623 | 444/18723 | 5.80e-04 | 5.35e-03 | 140 |
| GO:019873815 | Oral cavity | LP | cell-cell signaling by wnt | 140/4623 | 446/18723 | 7.12e-04 | 6.38e-03 | 140 |
| GO:003001017 | Oral cavity | LP | establishment of cell polarity | 49/4623 | 143/18723 | 6.33e-03 | 3.73e-02 | 49 |
| GO:000166728 | Thyroid | HT | ameboidal-type cell migration | 52/1272 | 475/18723 | 4.54e-04 | 5.53e-03 | 52 |
| GO:000716328 | Thyroid | HT | establishment or maintenance of cell polarity | 28/1272 | 218/18723 | 8.66e-04 | 9.20e-03 | 28 |
| GO:001605520 | Thyroid | HT | Wnt signaling pathway | 48/1272 | 444/18723 | 9.68e-04 | 9.93e-03 | 48 |
| GO:019873820 | Thyroid | HT | cell-cell signaling by wnt | 48/1272 | 446/18723 | 1.07e-03 | 1.07e-02 | 48 |
| GO:00353298 | Thyroid | HT | hippo signaling | 8/1272 | 40/18723 | 4.84e-03 | 3.32e-02 | 8 |
| Page: 1 2 |
| Pathway ID | Tissue | Disease Stage | Description | Gene Ratio | Bg Ratio | pvalue | p.adjust | qvalue | Count |
| hsa04530211 | Esophagus | ESCC | Tight junction | 105/4205 | 169/8465 | 6.73e-04 | 2.23e-03 | 1.14e-03 | 105 |
| hsa04530310 | Esophagus | ESCC | Tight junction | 105/4205 | 169/8465 | 6.73e-04 | 2.23e-03 | 1.14e-03 | 105 |
| hsa0453030 | Oral cavity | OSCC | Tight junction | 102/3704 | 169/8465 | 8.68e-06 | 3.93e-05 | 2.00e-05 | 102 |
| hsa04530114 | Oral cavity | OSCC | Tight junction | 102/3704 | 169/8465 | 8.68e-06 | 3.93e-05 | 2.00e-05 | 102 |
| Page: 1 |
Top |
Cell-cell communication analysis |
| Identification of potential cell-cell interactions between two cell types and their ligand-receptor pairs for different disease states |
| Ligand | Receptor | LRpair | Pathway | Tissue | Disease Stage |
| Page: 1 |
Top |
Single-cell gene regulatory network inference analysis |
| Find out the significant the regulons (TFs) and the target genes of each regulon across cell types for different disease states |
| TF | Cell Type | Tissue | Disease Stage | Target Gene | RSS | Regulon Activity |
| ∗The dot plots of a searched regulon are shown for all cell subpopulations in each disease state of each tissue based on the regulon specific score inferred using pySCENIC and by calculating the average expression. |
| Page: 1 |
Top |
Somatic mutation of malignant transformation related genes |
| Annotation of somatic variants for genes involved in malignant transformation |
| Hugo Symbol | Variant Class | Variant Classification | dbSNP RS | HGVSc | HGVSp | HGVSp Short | SWISSPROT | BIOTYPE | SIFT | PolyPhen | Tumor Sample Barcode | Tissue | Histology | Sex | Age | Stage | Therapy Types | Drugs | Outcome |
| AMOTL2 | SNV | Missense_Mutation | novel | c.1282N>A | p.Glu428Lys | p.E428K | Q9Y2J4 | protein_coding | deleterious(0) | probably_damaging(0.913) | TCGA-AN-A0FV-01 | Breast | breast invasive carcinoma | Female | <65 | I/II | Unknown | Unknown | SD |
| AMOTL2 | SNV | Missense_Mutation | c.355G>A | p.Glu119Lys | p.E119K | Q9Y2J4 | protein_coding | deleterious(0) | probably_damaging(0.994) | TCGA-GM-A2D9-01 | Breast | breast invasive carcinoma | Female | >=65 | I/II | Hormone Therapy | arimidex | SD | |
| AMOTL2 | insertion | Nonsense_Mutation | novel | c.1562_1563insATTACAGGCATGAGC | p.Gly521_Asn522insLeuGlnAlaTerAla | p.G521_N522insLQA*A | Q9Y2J4 | protein_coding | TCGA-A8-A08H-01 | Breast | breast invasive carcinoma | Female | >=65 | I/II | Unknown | Unknown | SD | ||
| AMOTL2 | SNV | Missense_Mutation | novel | c.803N>A | p.Pro268Gln | p.P268Q | Q9Y2J4 | protein_coding | deleterious(0) | probably_damaging(0.999) | TCGA-C5-A901-01 | Cervix | cervical & endocervical cancer | Female | <65 | I/II | Unknown | Unknown | SD |
| AMOTL2 | SNV | Missense_Mutation | c.2410G>C | p.Asp804His | p.D804H | Q9Y2J4 | protein_coding | deleterious(0.03) | possibly_damaging(0.501) | TCGA-DG-A2KM-01 | Cervix | cervical & endocervical cancer | Female | <65 | I/II | Chemotherapy | cisplatin | SD | |
| AMOTL2 | SNV | Missense_Mutation | novel | c.551N>A | p.Pro184Gln | p.P184Q | Q9Y2J4 | protein_coding | tolerated(0.23) | benign(0.282) | TCGA-DS-A1OD-01 | Cervix | cervical & endocervical cancer | Female | <65 | I/II | Chemotherapy | cisplatin | SD |
| AMOTL2 | SNV | Missense_Mutation | novel | c.1940C>T | p.Thr647Met | p.T647M | Q9Y2J4 | protein_coding | deleterious(0) | probably_damaging(1) | TCGA-EA-A3HS-01 | Cervix | cervical & endocervical cancer | Female | <65 | I/II | Unknown | Unknown | SD |
| AMOTL2 | SNV | Missense_Mutation | novel | c.1132N>C | p.Glu378Gln | p.E378Q | Q9Y2J4 | protein_coding | tolerated(0.12) | possibly_damaging(0.477) | TCGA-HM-A4S6-01 | Cervix | cervical & endocervical cancer | Female | <65 | III/IV | Chemotherapy | cisplatin | CR |
| AMOTL2 | SNV | Missense_Mutation | novel | c.1159N>A | p.Glu387Lys | p.E387K | Q9Y2J4 | protein_coding | deleterious(0.02) | possibly_damaging(0.541) | TCGA-IR-A3LH-01 | Cervix | cervical & endocervical cancer | Female | <65 | I/II | Chemotherapy | cisplatin | CR |
| AMOTL2 | SNV | Missense_Mutation | novel | c.1243N>A | p.Glu415Lys | p.E415K | Q9Y2J4 | protein_coding | deleterious(0.02) | probably_damaging(0.913) | TCGA-JW-A5VL-01 | Cervix | cervical & endocervical cancer | Female | <65 | I/II | Unknown | Unknown | SD |
| Page: 1 2 3 4 5 6 7 8 |
Top |
Related drugs of malignant transformation related genes |
| Identification of chemicals and drugs interact with genes involved in malignant transfromation |
| (DGIdb 4.0) |
| Entrez ID | Symbol | Category | Interaction Types | Drug Claim Name | Drug Name | PMIDs |
| Page: 1 |

Copyright 2023-Present -The University of Texas Health Science Center at Houston |