
|
|||||
|
 | |
| |
| |
| |
| |
| |
|
Gene: AMOTL1 |
Gene summary for AMOTL1 |
| Gene information | Species | Human | Gene symbol | AMOTL1 | Gene ID | 154810 |
| Gene name | angiomotin like 1 | |
| Gene Alias | JEAP | |
| Cytomap | 11q21 | |
| Gene Type | protein-coding | GO ID | GO:0001525 | UniProtAcc | Q8IY63 |
Top |
Malignant transformation analysis |
| Identification of the aberrant gene expression in precancerous and cancerous lesions by comparing the gene expression of stem-like cells in diseased tissues with normal stem cells |
| Entrez ID | Symbol | Replicates | Species | Organ | Tissue | Adj P-value | Log2FC | Malignancy |
| 154810 | AMOTL1 | LZE4T | Human | Esophagus | ESCC | 1.24e-04 | 1.54e-01 | 0.0811 |
| 154810 | AMOTL1 | LZE24T | Human | Esophagus | ESCC | 1.88e-05 | 2.70e-01 | 0.0596 |
| 154810 | AMOTL1 | P1T-E | Human | Esophagus | ESCC | 8.53e-03 | 1.25e-01 | 0.0875 |
| 154810 | AMOTL1 | P2T-E | Human | Esophagus | ESCC | 1.45e-19 | 4.00e-01 | 0.1177 |
| 154810 | AMOTL1 | P4T-E | Human | Esophagus | ESCC | 1.58e-27 | 6.67e-01 | 0.1323 |
| 154810 | AMOTL1 | P5T-E | Human | Esophagus | ESCC | 6.35e-10 | 1.40e-01 | 0.1327 |
| 154810 | AMOTL1 | P8T-E | Human | Esophagus | ESCC | 4.04e-08 | 1.20e-01 | 0.0889 |
| 154810 | AMOTL1 | P9T-E | Human | Esophagus | ESCC | 4.57e-15 | 2.65e-01 | 0.1131 |
| 154810 | AMOTL1 | P10T-E | Human | Esophagus | ESCC | 8.43e-29 | 4.55e-01 | 0.116 |
| 154810 | AMOTL1 | P11T-E | Human | Esophagus | ESCC | 6.79e-17 | 5.44e-01 | 0.1426 |
| 154810 | AMOTL1 | P12T-E | Human | Esophagus | ESCC | 9.72e-21 | 3.49e-01 | 0.1122 |
| 154810 | AMOTL1 | P15T-E | Human | Esophagus | ESCC | 5.36e-08 | 1.82e-01 | 0.1149 |
| 154810 | AMOTL1 | P16T-E | Human | Esophagus | ESCC | 3.72e-20 | 3.36e-01 | 0.1153 |
| 154810 | AMOTL1 | P17T-E | Human | Esophagus | ESCC | 1.25e-12 | 6.06e-01 | 0.1278 |
| 154810 | AMOTL1 | P19T-E | Human | Esophagus | ESCC | 7.21e-09 | 6.71e-01 | 0.1662 |
| 154810 | AMOTL1 | P20T-E | Human | Esophagus | ESCC | 2.21e-07 | 1.23e-01 | 0.1124 |
| 154810 | AMOTL1 | P21T-E | Human | Esophagus | ESCC | 3.31e-35 | 8.41e-01 | 0.1617 |
| 154810 | AMOTL1 | P22T-E | Human | Esophagus | ESCC | 9.64e-18 | 2.82e-01 | 0.1236 |
| 154810 | AMOTL1 | P23T-E | Human | Esophagus | ESCC | 2.51e-06 | 2.06e-01 | 0.108 |
| 154810 | AMOTL1 | P24T-E | Human | Esophagus | ESCC | 1.67e-03 | 1.17e-01 | 0.1287 |
| Page: 1 2 3 4 5 6 |
| Tissue | Expression Dynamics | Abbreviation |
| Esophagus |  | ESCC: Esophageal squamous cell carcinoma |
| HGIN: High-grade intraepithelial neoplasias | ||
| LGIN: Low-grade intraepithelial neoplasias | ||
| Oral Cavity | 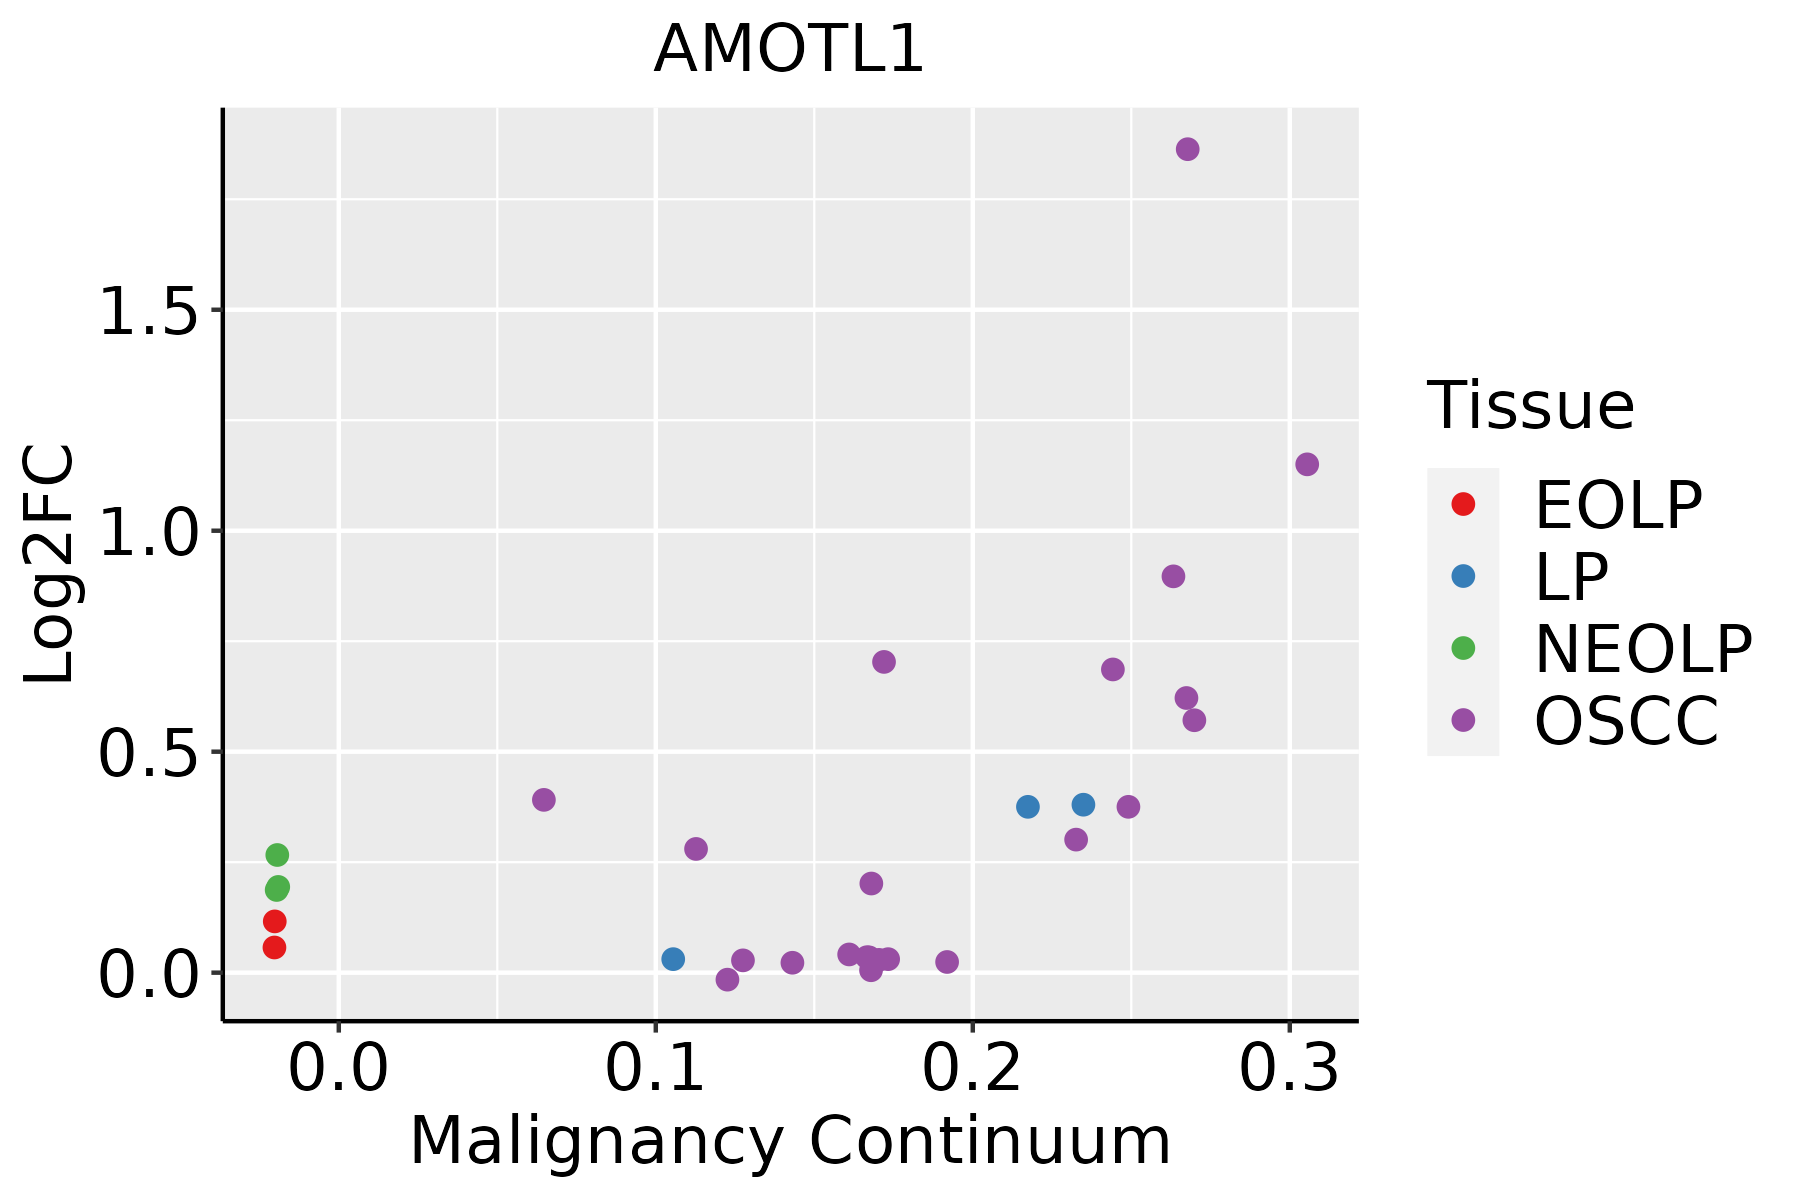 | EOLP: Erosive Oral lichen planus |
| LP: leukoplakia | ||
| NEOLP: Non-erosive oral lichen planus | ||
| OSCC: Oral squamous cell carcinoma | ||
| Prostate | 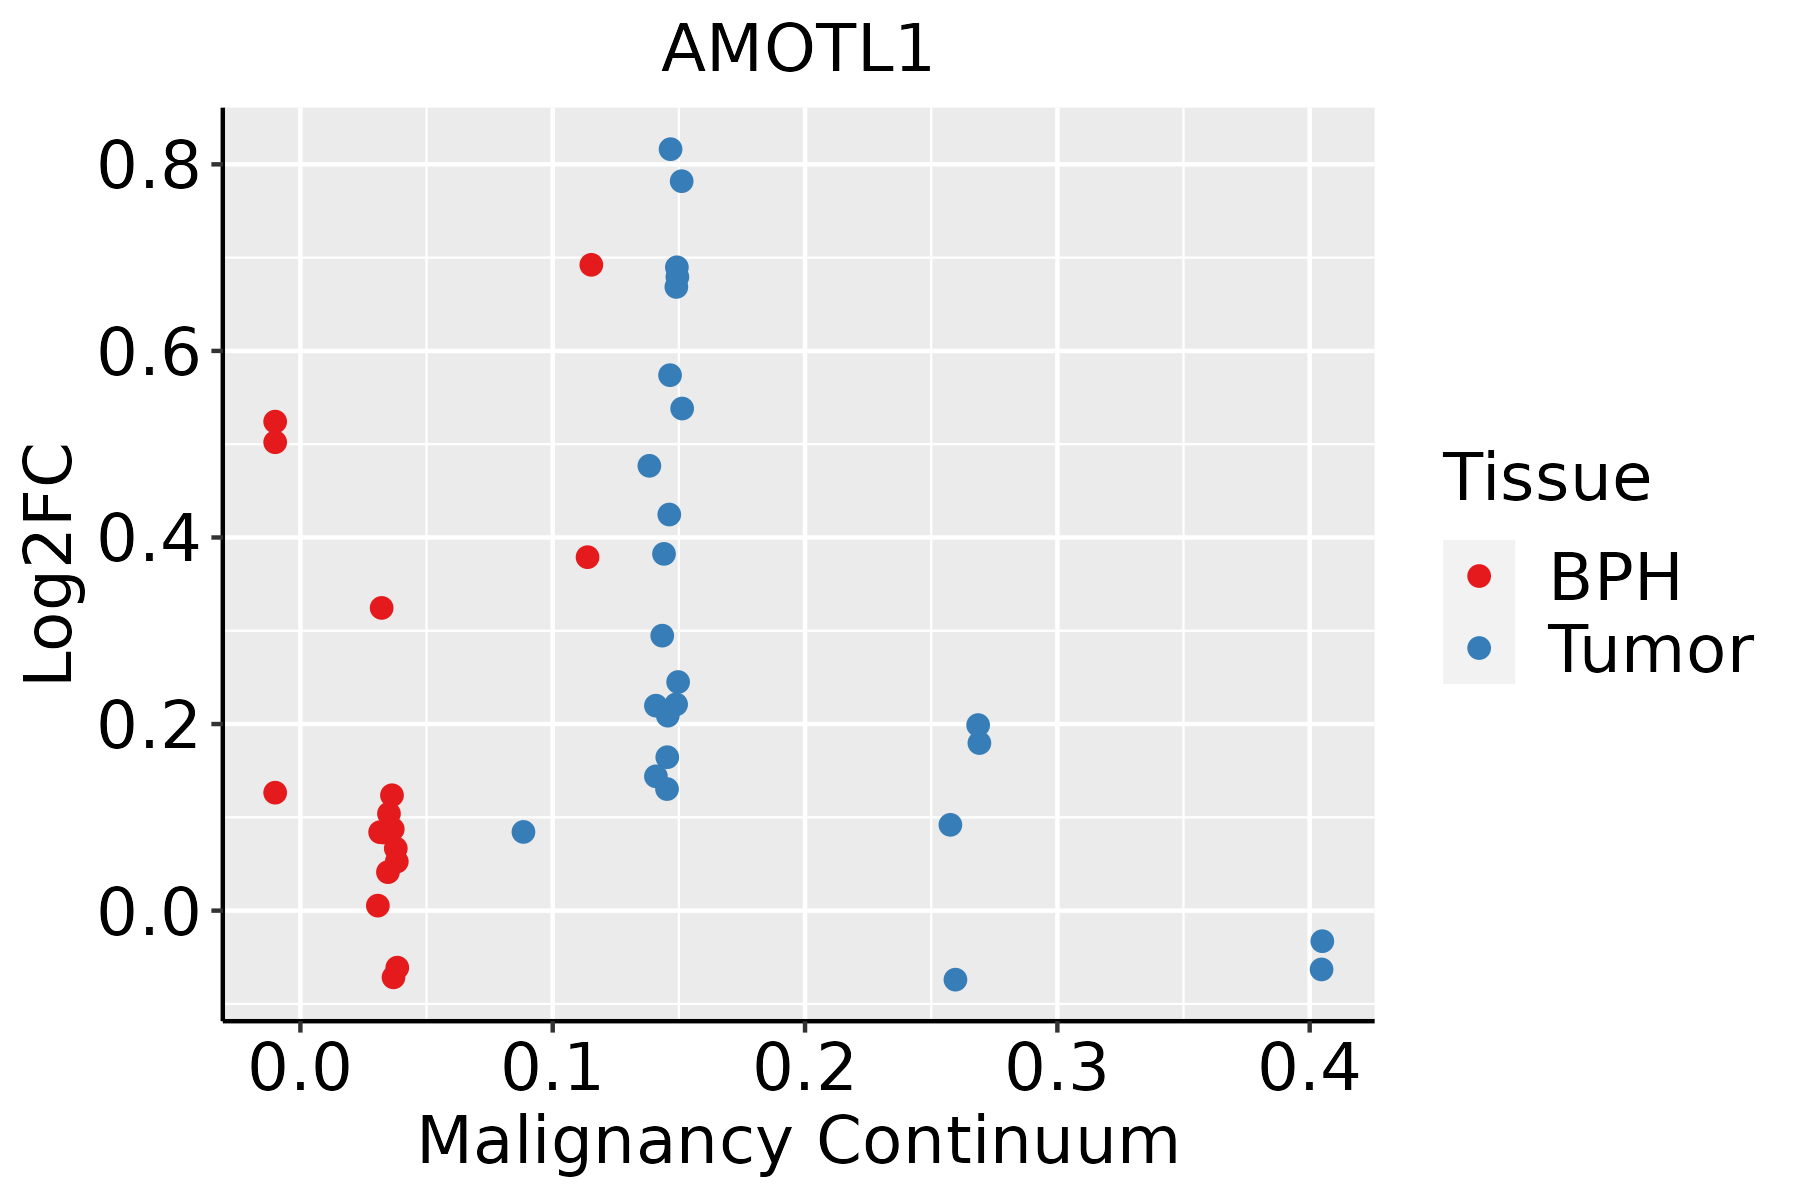 | BPH: Benign Prostatic Hyperplasia |
| Skin |  | AK: Actinic keratosis |
| cSCC: Cutaneous squamous cell carcinoma | ||
| SCCIS:squamous cell carcinoma in situ | ||
| Thyroid | 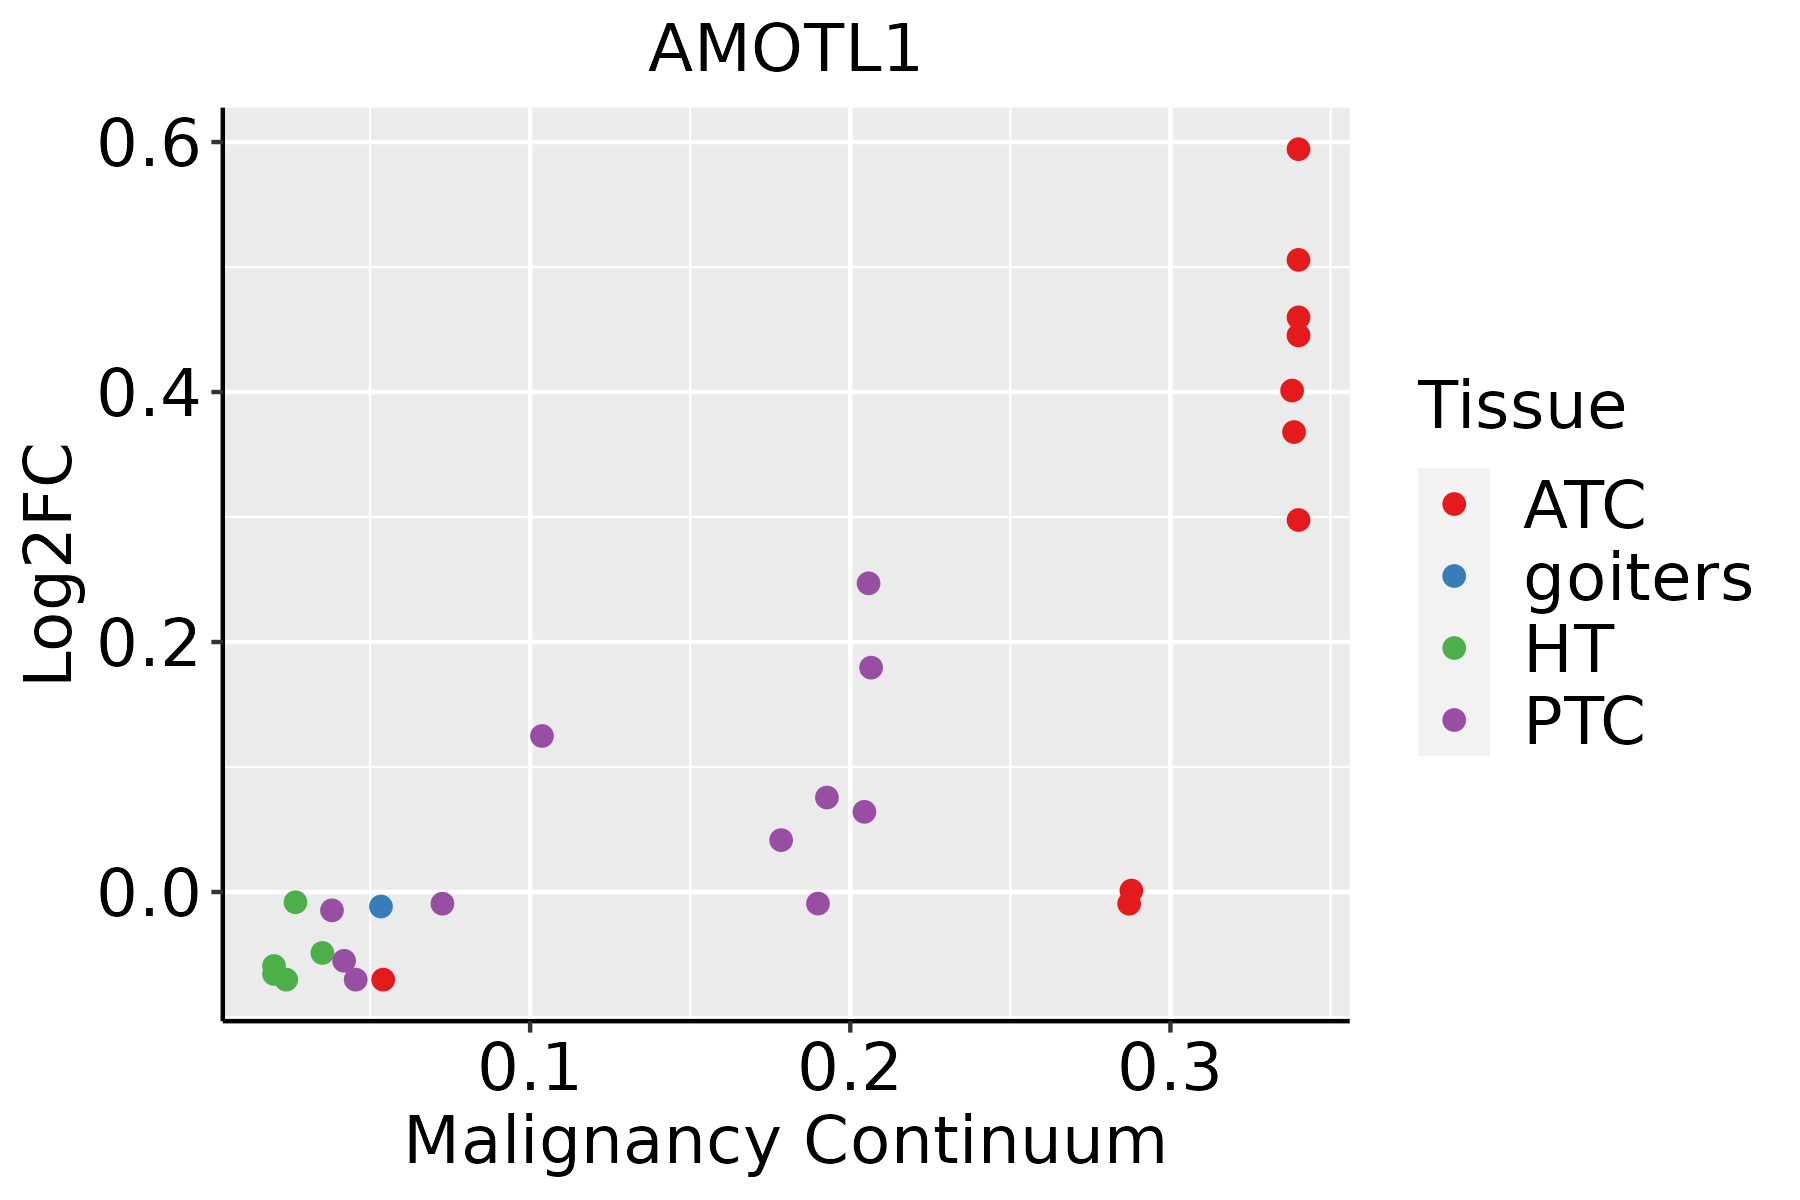 | ATC: Anaplastic thyroid cancer |
| HT: Hashimoto's thyroiditis | ||
| PTC: Papillary thyroid cancer |
| ∗log2FC in expression of this searched gene in stem-like cells from each diseased tissue sample relative to stem-like cells in normal samples in each tissue plotted against the malignancy continuum. Samples are colored based on if they are from different disease stage. |
Top |
Malignant transformation related pathway analysis |
| Find out the enriched GO biological processes and KEGG pathways involved in transition from healthy to precancer to cancer |
| Tissue | Disease Stage | Enriched GO biological Processes |
| Colorectum | AD |  |
| Colorectum | SER |  |
| Colorectum | MSS |  |
| Colorectum | MSI-H |  |
| Colorectum | FAP |  |
| ∗Top 15 enriched GO BP terms are showed in the bar plot of each disease state in each tissue. Each row represents a significant GO biological process which is colored according to the -log10(p.adjust). |
| Page: 1 2 3 4 5 6 7 8 9 |
| GO ID | Tissue | Disease Stage | Description | Gene Ratio | Bg Ratio | pvalue | p.adjust | Count |
| GO:001605517 | Esophagus | ESCC | Wnt signaling pathway | 268/8552 | 444/18723 | 2.32e-10 | 6.58e-09 | 268 |
| GO:019873817 | Esophagus | ESCC | cell-cell signaling by wnt | 269/8552 | 446/18723 | 2.41e-10 | 6.79e-09 | 269 |
| GO:000716320 | Esophagus | ESCC | establishment or maintenance of cell polarity | 143/8552 | 218/18723 | 2.05e-09 | 4.65e-08 | 143 |
| GO:003001018 | Esophagus | ESCC | establishment of cell polarity | 96/8552 | 143/18723 | 1.69e-07 | 2.67e-06 | 96 |
| GO:000166720 | Esophagus | ESCC | ameboidal-type cell migration | 250/8552 | 475/18723 | 1.22e-03 | 5.97e-03 | 250 |
| GO:00353297 | Esophagus | ESCC | hippo signaling | 26/8552 | 40/18723 | 1.08e-02 | 3.66e-02 | 26 |
| GO:000716318 | Oral cavity | OSCC | establishment or maintenance of cell polarity | 129/7305 | 218/18723 | 1.16e-09 | 2.86e-08 | 129 |
| GO:001605510 | Oral cavity | OSCC | Wnt signaling pathway | 227/7305 | 444/18723 | 1.10e-07 | 1.87e-06 | 227 |
| GO:019873810 | Oral cavity | OSCC | cell-cell signaling by wnt | 227/7305 | 446/18723 | 1.75e-07 | 2.86e-06 | 227 |
| GO:003001016 | Oral cavity | OSCC | establishment of cell polarity | 82/7305 | 143/18723 | 6.56e-06 | 7.24e-05 | 82 |
| GO:000166719 | Oral cavity | OSCC | ameboidal-type cell migration | 228/7305 | 475/18723 | 3.46e-05 | 3.10e-04 | 228 |
| GO:0001667110 | Oral cavity | EOLP | ameboidal-type cell migration | 100/2218 | 475/18723 | 5.24e-09 | 2.85e-07 | 100 |
| GO:001605523 | Oral cavity | EOLP | Wnt signaling pathway | 89/2218 | 444/18723 | 3.66e-07 | 1.06e-05 | 89 |
| GO:019873823 | Oral cavity | EOLP | cell-cell signaling by wnt | 89/2218 | 446/18723 | 4.49e-07 | 1.25e-05 | 89 |
| GO:000716325 | Oral cavity | EOLP | establishment or maintenance of cell polarity | 51/2218 | 218/18723 | 1.22e-06 | 2.94e-05 | 51 |
| GO:003001024 | Oral cavity | EOLP | establishment of cell polarity | 31/2218 | 143/18723 | 5.84e-04 | 4.93e-03 | 31 |
| GO:001605532 | Oral cavity | NEOLP | Wnt signaling pathway | 93/2005 | 444/18723 | 1.35e-10 | 1.34e-08 | 93 |
| GO:019873832 | Oral cavity | NEOLP | cell-cell signaling by wnt | 93/2005 | 446/18723 | 1.73e-10 | 1.66e-08 | 93 |
| GO:000166725 | Oral cavity | NEOLP | ameboidal-type cell migration | 96/2005 | 475/18723 | 5.16e-10 | 4.14e-08 | 96 |
| GO:000716333 | Oral cavity | NEOLP | establishment or maintenance of cell polarity | 53/2005 | 218/18723 | 7.21e-09 | 3.82e-07 | 53 |
| Page: 1 2 3 |
| Pathway ID | Tissue | Disease Stage | Description | Gene Ratio | Bg Ratio | pvalue | p.adjust | qvalue | Count |
| hsa04530211 | Esophagus | ESCC | Tight junction | 105/4205 | 169/8465 | 6.73e-04 | 2.23e-03 | 1.14e-03 | 105 |
| hsa04530310 | Esophagus | ESCC | Tight junction | 105/4205 | 169/8465 | 6.73e-04 | 2.23e-03 | 1.14e-03 | 105 |
| hsa0453030 | Oral cavity | OSCC | Tight junction | 102/3704 | 169/8465 | 8.68e-06 | 3.93e-05 | 2.00e-05 | 102 |
| hsa04530114 | Oral cavity | OSCC | Tight junction | 102/3704 | 169/8465 | 8.68e-06 | 3.93e-05 | 2.00e-05 | 102 |
| hsa04530210 | Oral cavity | EOLP | Tight junction | 39/1218 | 169/8465 | 1.52e-03 | 5.34e-03 | 3.15e-03 | 39 |
| hsa0453038 | Oral cavity | EOLP | Tight junction | 39/1218 | 169/8465 | 1.52e-03 | 5.34e-03 | 3.15e-03 | 39 |
| hsa0453045 | Oral cavity | NEOLP | Tight junction | 39/1112 | 169/8465 | 2.50e-04 | 1.62e-03 | 1.02e-03 | 39 |
| hsa0453055 | Oral cavity | NEOLP | Tight junction | 39/1112 | 169/8465 | 2.50e-04 | 1.62e-03 | 1.02e-03 | 39 |
| hsa0453028 | Prostate | BPH | Tight junction | 68/1718 | 169/8465 | 1.70e-09 | 2.55e-08 | 1.58e-08 | 68 |
| hsa04530113 | Prostate | BPH | Tight junction | 68/1718 | 169/8465 | 1.70e-09 | 2.55e-08 | 1.58e-08 | 68 |
| hsa0453029 | Prostate | Tumor | Tight junction | 69/1791 | 169/8465 | 3.92e-09 | 6.18e-08 | 3.83e-08 | 69 |
| hsa0453037 | Prostate | Tumor | Tight junction | 69/1791 | 169/8465 | 3.92e-09 | 6.18e-08 | 3.83e-08 | 69 |
| Page: 1 |
Top |
Cell-cell communication analysis |
| Identification of potential cell-cell interactions between two cell types and their ligand-receptor pairs for different disease states |
| Ligand | Receptor | LRpair | Pathway | Tissue | Disease Stage |
| Page: 1 |
Top |
Single-cell gene regulatory network inference analysis |
| Find out the significant the regulons (TFs) and the target genes of each regulon across cell types for different disease states |
| TF | Cell Type | Tissue | Disease Stage | Target Gene | RSS | Regulon Activity |
| ∗The dot plots of a searched regulon are shown for all cell subpopulations in each disease state of each tissue based on the regulon specific score inferred using pySCENIC and by calculating the average expression. |
| Page: 1 |
Top |
Somatic mutation of malignant transformation related genes |
| Annotation of somatic variants for genes involved in malignant transformation |
| Hugo Symbol | Variant Class | Variant Classification | dbSNP RS | HGVSc | HGVSp | HGVSp Short | SWISSPROT | BIOTYPE | SIFT | PolyPhen | Tumor Sample Barcode | Tissue | Histology | Sex | Age | Stage | Therapy Types | Drugs | Outcome |
| AMOTL1 | SNV | Missense_Mutation | c.469N>T | p.Arg157Cys | p.R157C | Q8IY63 | protein_coding | deleterious(0) | probably_damaging(0.996) | TCGA-A2-A0T5-01 | Breast | breast invasive carcinoma | Female | <65 | I/II | Unspecific | Taxotere | SD | |
| AMOTL1 | SNV | Missense_Mutation | c.749N>A | p.Leu250Gln | p.L250Q | Q8IY63 | protein_coding | deleterious(0.02) | probably_damaging(0.986) | TCGA-A2-A1G4-01 | Breast | breast invasive carcinoma | Female | >=65 | III/IV | Chemotherapy | adriamycin | SD | |
| AMOTL1 | SNV | Missense_Mutation | novel | c.2372C>T | p.Ala791Val | p.A791V | Q8IY63 | protein_coding | deleterious(0) | probably_damaging(0.992) | TCGA-A8-A093-01 | Breast | breast invasive carcinoma | Female | <65 | I/II | Hormone Therapy | tamoxiphen | SD |
| AMOTL1 | SNV | Missense_Mutation | rs761369392 | c.2375G>A | p.Arg792His | p.R792H | Q8IY63 | protein_coding | deleterious(0) | probably_damaging(0.985) | TCGA-A8-A09Q-01 | Breast | breast invasive carcinoma | Female | >=65 | III/IV | Hormone Therapy | anastrozole | SD |
| AMOTL1 | SNV | Missense_Mutation | novel | c.2399N>T | p.Ala800Val | p.A800V | Q8IY63 | protein_coding | deleterious(0.03) | benign(0.1) | TCGA-AN-A0FK-01 | Breast | breast invasive carcinoma | Female | >=65 | III/IV | Unknown | Unknown | SD |
| AMOTL1 | SNV | Missense_Mutation | c.1404G>T | p.Lys468Asn | p.K468N | Q8IY63 | protein_coding | deleterious(0) | possibly_damaging(0.628) | TCGA-BH-A0HN-01 | Breast | breast invasive carcinoma | Female | >=65 | I/II | Hormone Therapy | arimidex | SD | |
| AMOTL1 | SNV | Missense_Mutation | rs771509658 | c.340G>A | p.Glu114Lys | p.E114K | Q8IY63 | protein_coding | deleterious(0) | probably_damaging(0.975) | TCGA-BH-A1ES-06 | Breast | breast invasive carcinoma | Female | <65 | I/II | Unknown | Unknown | PD |
| AMOTL1 | SNV | Missense_Mutation | c.1480N>C | p.Glu494Gln | p.E494Q | Q8IY63 | protein_coding | deleterious(0.02) | probably_damaging(0.996) | TCGA-D8-A1JA-01 | Breast | breast invasive carcinoma | Female | <65 | III/IV | Chemotherapy | adriamycin | PD | |
| AMOTL1 | SNV | Missense_Mutation | c.2848N>C | p.Glu950Gln | p.E950Q | Q8IY63 | protein_coding | deleterious_low_confidence(0.01) | possibly_damaging(0.494) | TCGA-EW-A1OV-01 | Breast | breast invasive carcinoma | Female | <65 | I/II | Chemotherapy | epirubicin | SD | |
| AMOTL1 | insertion | Frame_Shift_Ins | novel | c.178_179insTATGGGCTCTCAACTCCTCTCTTACTCT | p.Ser60IlefsTer11 | p.S60Ifs*11 | Q8IY63 | protein_coding | TCGA-A8-A0A4-01 | Breast | breast invasive carcinoma | Female | >=65 | I/II | Hormone Therapy | tamoxiphen | CR |
| Page: 1 2 3 4 5 6 7 8 9 10 11 12 13 |
Top |
Related drugs of malignant transformation related genes |
| Identification of chemicals and drugs interact with genes involved in malignant transfromation |
| (DGIdb 4.0) |
| Entrez ID | Symbol | Category | Interaction Types | Drug Claim Name | Drug Name | PMIDs |
| Page: 1 |

Copyright 2023-Present -The University of Texas Health Science Center at Houston |