
|
|||||
|
 | |
| |
| |
| |
| |
| |
|
Gene: AMN1 |
Gene summary for AMN1 |
| Gene information | Species | Human | Gene symbol | AMN1 | Gene ID | 196394 |
| Gene name | antagonist of mitotic exit network 1 homolog | |
| Gene Alias | AMN1 | |
| Cytomap | 12p11.21 | |
| Gene Type | protein-coding | GO ID | GO:0006508 | UniProtAcc | Q8IY45 |
Top |
Malignant transformation analysis |
| Identification of the aberrant gene expression in precancerous and cancerous lesions by comparing the gene expression of stem-like cells in diseased tissues with normal stem cells |
| Entrez ID | Symbol | Replicates | Species | Organ | Tissue | Adj P-value | Log2FC | Malignancy |
| 196394 | AMN1 | LZE8T | Human | Esophagus | ESCC | 2.63e-06 | 2.71e-01 | 0.067 |
| 196394 | AMN1 | LZE24T | Human | Esophagus | ESCC | 3.99e-11 | 2.56e-01 | 0.0596 |
| 196394 | AMN1 | P2T-E | Human | Esophagus | ESCC | 5.40e-13 | 2.29e-01 | 0.1177 |
| 196394 | AMN1 | P4T-E | Human | Esophagus | ESCC | 4.81e-11 | 2.68e-01 | 0.1323 |
| 196394 | AMN1 | P5T-E | Human | Esophagus | ESCC | 2.60e-08 | 1.39e-01 | 0.1327 |
| 196394 | AMN1 | P8T-E | Human | Esophagus | ESCC | 4.98e-05 | 1.02e-01 | 0.0889 |
| 196394 | AMN1 | P10T-E | Human | Esophagus | ESCC | 1.72e-14 | 3.19e-01 | 0.116 |
| 196394 | AMN1 | P12T-E | Human | Esophagus | ESCC | 4.25e-15 | 3.52e-01 | 0.1122 |
| 196394 | AMN1 | P15T-E | Human | Esophagus | ESCC | 5.91e-10 | 2.75e-01 | 0.1149 |
| 196394 | AMN1 | P16T-E | Human | Esophagus | ESCC | 3.00e-35 | 4.84e-01 | 0.1153 |
| 196394 | AMN1 | P17T-E | Human | Esophagus | ESCC | 2.82e-02 | 1.55e-01 | 0.1278 |
| 196394 | AMN1 | P20T-E | Human | Esophagus | ESCC | 9.55e-05 | 1.54e-01 | 0.1124 |
| 196394 | AMN1 | P21T-E | Human | Esophagus | ESCC | 4.92e-12 | 1.18e-01 | 0.1617 |
| 196394 | AMN1 | P22T-E | Human | Esophagus | ESCC | 7.06e-26 | 4.98e-01 | 0.1236 |
| 196394 | AMN1 | P23T-E | Human | Esophagus | ESCC | 2.15e-14 | 3.59e-01 | 0.108 |
| 196394 | AMN1 | P24T-E | Human | Esophagus | ESCC | 1.90e-04 | 1.24e-01 | 0.1287 |
| 196394 | AMN1 | P26T-E | Human | Esophagus | ESCC | 1.83e-19 | 4.09e-01 | 0.1276 |
| 196394 | AMN1 | P27T-E | Human | Esophagus | ESCC | 2.36e-16 | 2.95e-01 | 0.1055 |
| 196394 | AMN1 | P28T-E | Human | Esophagus | ESCC | 3.32e-06 | 1.28e-01 | 0.1149 |
| 196394 | AMN1 | P30T-E | Human | Esophagus | ESCC | 1.17e-02 | 1.39e-01 | 0.137 |
| Page: 1 2 3 |
| Tissue | Expression Dynamics | Abbreviation |
| Esophagus |  | ESCC: Esophageal squamous cell carcinoma |
| HGIN: High-grade intraepithelial neoplasias | ||
| LGIN: Low-grade intraepithelial neoplasias | ||
| Oral Cavity | 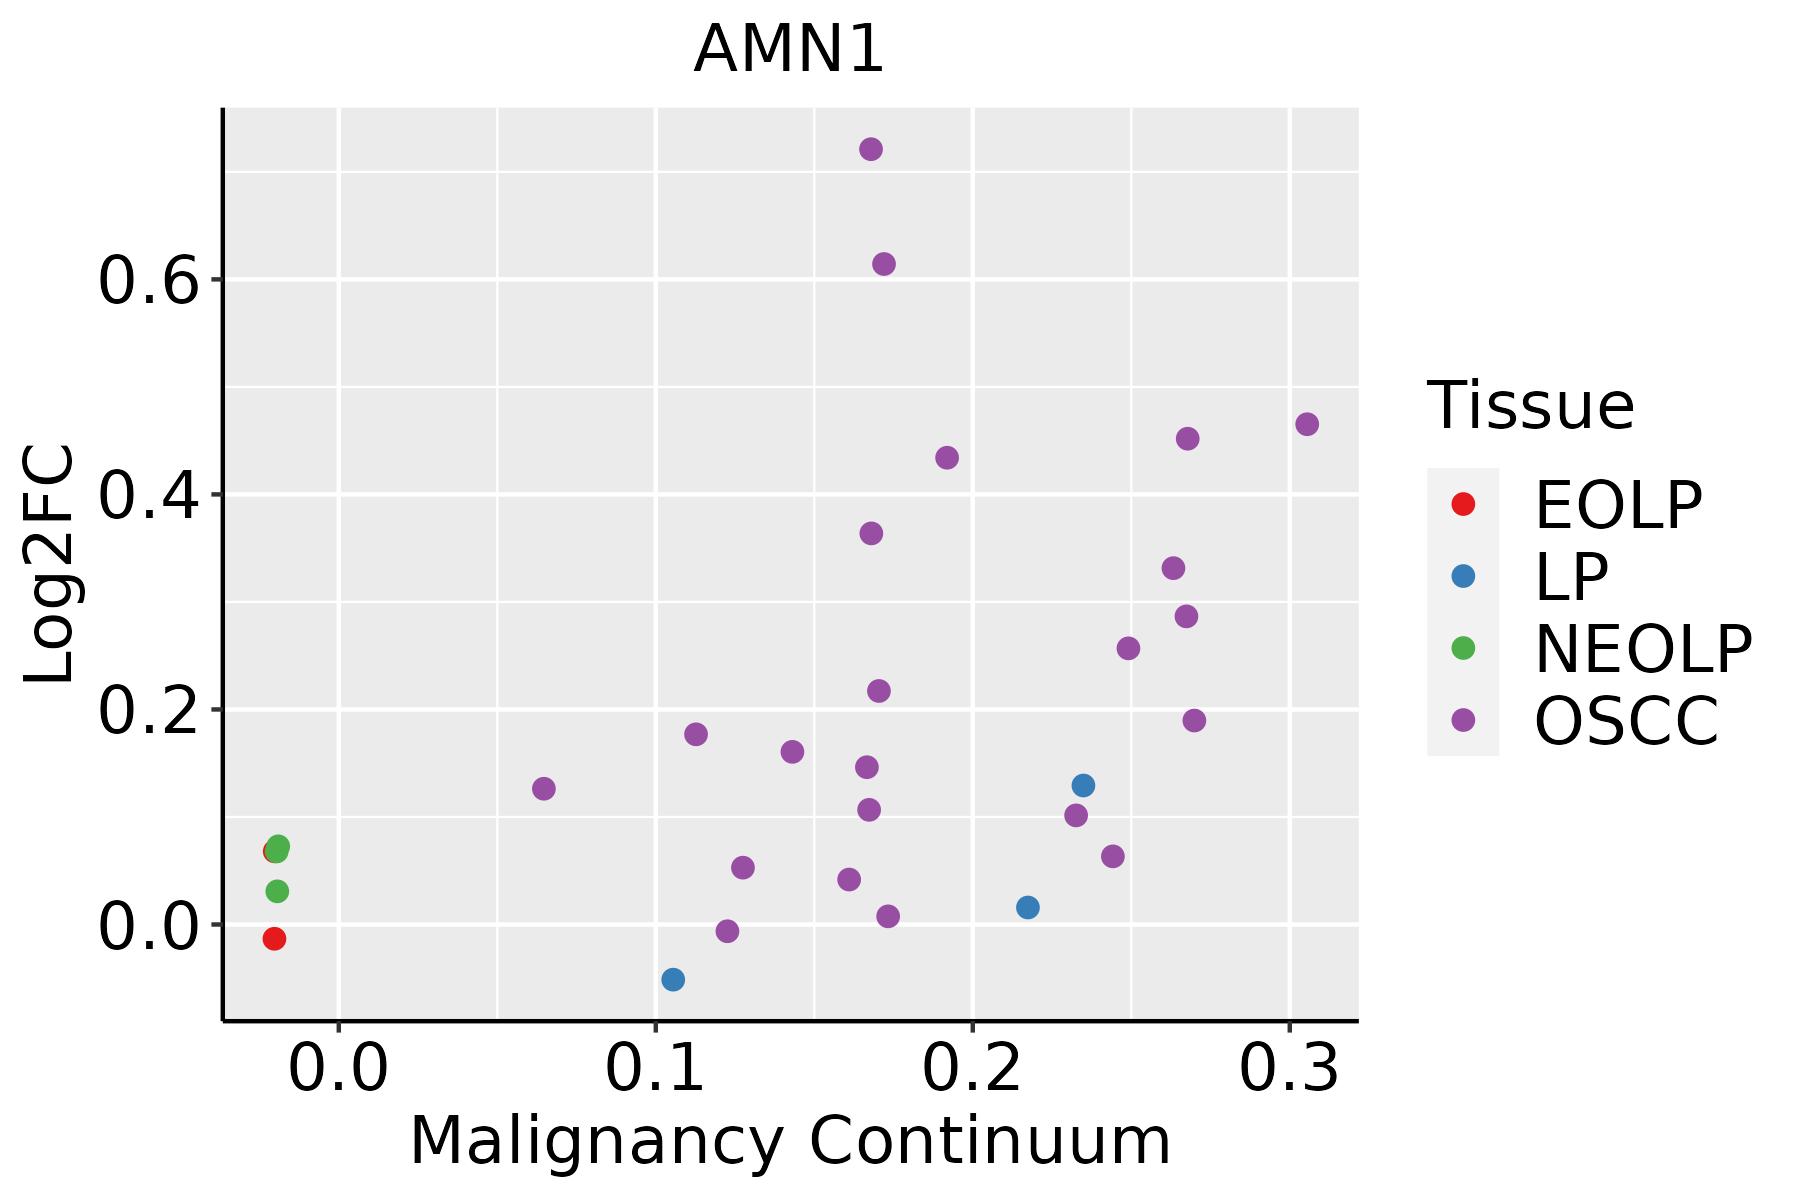 | EOLP: Erosive Oral lichen planus |
| LP: leukoplakia | ||
| NEOLP: Non-erosive oral lichen planus | ||
| OSCC: Oral squamous cell carcinoma |
| ∗log2FC in expression of this searched gene in stem-like cells from each diseased tissue sample relative to stem-like cells in normal samples in each tissue plotted against the malignancy continuum. Samples are colored based on if they are from different disease stage. |
Top |
Malignant transformation related pathway analysis |
| Find out the enriched GO biological processes and KEGG pathways involved in transition from healthy to precancer to cancer |
| Tissue | Disease Stage | Enriched GO biological Processes |
| Colorectum | AD |  |
| Colorectum | SER |  |
| Colorectum | MSS |  |
| Colorectum | MSI-H |  |
| Colorectum | FAP |  |
| ∗Top 15 enriched GO BP terms are showed in the bar plot of each disease state in each tissue. Each row represents a significant GO biological process which is colored according to the -log10(p.adjust). |
| Page: 1 2 3 4 5 6 7 8 9 |
| GO ID | Tissue | Disease Stage | Description | Gene Ratio | Bg Ratio | pvalue | p.adjust | Count |
| GO:0010498111 | Esophagus | ESCC | proteasomal protein catabolic process | 369/8552 | 490/18723 | 1.13e-41 | 1.80e-38 | 369 |
| GO:0043161111 | Esophagus | ESCC | proteasome-mediated ubiquitin-dependent protein catabolic process | 312/8552 | 412/18723 | 3.53e-36 | 4.48e-33 | 312 |
| GO:00311461 | Esophagus | ESCC | SCF-dependent proteasomal ubiquitin-dependent protein catabolic process | 33/8552 | 49/18723 | 1.80e-03 | 8.26e-03 | 33 |
| GO:001049820 | Oral cavity | OSCC | proteasomal protein catabolic process | 336/7305 | 490/18723 | 5.45e-41 | 8.63e-38 | 336 |
| GO:004316120 | Oral cavity | OSCC | proteasome-mediated ubiquitin-dependent protein catabolic process | 285/7305 | 412/18723 | 5.68e-36 | 5.99e-33 | 285 |
| Page: 1 |
| Pathway ID | Tissue | Disease Stage | Description | Gene Ratio | Bg Ratio | pvalue | p.adjust | qvalue | Count |
| Page: 1 |
Top |
Cell-cell communication analysis |
| Identification of potential cell-cell interactions between two cell types and their ligand-receptor pairs for different disease states |
| Ligand | Receptor | LRpair | Pathway | Tissue | Disease Stage |
| Page: 1 |
Top |
Single-cell gene regulatory network inference analysis |
| Find out the significant the regulons (TFs) and the target genes of each regulon across cell types for different disease states |
| TF | Cell Type | Tissue | Disease Stage | Target Gene | RSS | Regulon Activity |
| ∗The dot plots of a searched regulon are shown for all cell subpopulations in each disease state of each tissue based on the regulon specific score inferred using pySCENIC and by calculating the average expression. |
| Page: 1 |
Top |
Somatic mutation of malignant transformation related genes |
| Annotation of somatic variants for genes involved in malignant transformation |
| Hugo Symbol | Variant Class | Variant Classification | dbSNP RS | HGVSc | HGVSp | HGVSp Short | SWISSPROT | BIOTYPE | SIFT | PolyPhen | Tumor Sample Barcode | Tissue | Histology | Sex | Age | Stage | Therapy Types | Drugs | Outcome |
| AMN1 | SNV | Missense_Mutation | c.60N>T | p.Lys20Asn | p.K20N | Q8IY45 | protein_coding | tolerated(0.08) | benign(0.235) | TCGA-AA-3977-01 | Colorectum | colon adenocarcinoma | Male | >=65 | I/II | Unknown | Unknown | SD | |
| AMN1 | SNV | Missense_Mutation | c.257N>C | p.Lys86Thr | p.K86T | Q8IY45 | protein_coding | tolerated(0.09) | benign(0.079) | TCGA-AG-A002-01 | Colorectum | rectum adenocarcinoma | Male | <65 | I/II | Unknown | Unknown | SD | |
| AMN1 | SNV | Missense_Mutation | c.130N>C | p.Met44Leu | p.M44L | Q8IY45 | protein_coding | tolerated(0.14) | benign(0.003) | TCGA-F5-6814-01 | Colorectum | rectum adenocarcinoma | Male | <65 | I/II | Unknown | Unknown | SD | |
| AMN1 | SNV | Missense_Mutation | c.439G>A | p.Asp147Asn | p.D147N | Q8IY45 | protein_coding | tolerated(1) | benign(0.003) | TCGA-A5-A0G2-01 | Endometrium | uterine corpus endometrioid carcinoma | Female | <65 | III/IV | Unknown | Unknown | SD | |
| AMN1 | SNV | Missense_Mutation | rs772678124 | c.205C>T | p.Arg69Trp | p.R69W | Q8IY45 | protein_coding | deleterious(0.01) | possibly_damaging(0.729) | TCGA-A5-A0G2-01 | Endometrium | uterine corpus endometrioid carcinoma | Female | <65 | III/IV | Unknown | Unknown | SD |
| AMN1 | SNV | Missense_Mutation | novel | c.371G>T | p.Arg124Ile | p.R124I | Q8IY45 | protein_coding | deleterious(0.01) | possibly_damaging(0.863) | TCGA-AP-A1E0-01 | Endometrium | uterine corpus endometrioid carcinoma | Female | <65 | III/IV | Chemotherapy | paclitaxel | SD |
| AMN1 | SNV | Missense_Mutation | c.107N>C | p.Ile36Thr | p.I36T | Q8IY45 | protein_coding | deleterious(0) | possibly_damaging(0.617) | TCGA-AX-A05S-01 | Endometrium | uterine corpus endometrioid carcinoma | Female | >=65 | III/IV | Unspecific | Carboplatin & Paclitaxel | PD | |
| AMN1 | SNV | Missense_Mutation | novel | c.605N>A | p.Gly202Glu | p.G202E | Q8IY45 | protein_coding | tolerated(0.87) | benign(0.001) | TCGA-AX-A0J0-01 | Endometrium | uterine corpus endometrioid carcinoma | Female | <65 | I/II | Unknown | Unknown | SD |
| AMN1 | SNV | Missense_Mutation | c.439G>A | p.Asp147Asn | p.D147N | Q8IY45 | protein_coding | tolerated(1) | benign(0.003) | TCGA-AX-A2HD-01 | Endometrium | uterine corpus endometrioid carcinoma | Female | >=65 | III/IV | Unknown | Unknown | SD | |
| AMN1 | SNV | Missense_Mutation | novel | c.649N>G | p.Thr217Ala | p.T217A | Q8IY45 | protein_coding | tolerated(0.14) | benign(0.024) | TCGA-B5-A11Y-01 | Endometrium | uterine corpus endometrioid carcinoma | Female | <65 | I/II | Unknown | Unknown | SD |
| Page: 1 2 3 |
Top |
Related drugs of malignant transformation related genes |
| Identification of chemicals and drugs interact with genes involved in malignant transfromation |
| (DGIdb 4.0) |
| Entrez ID | Symbol | Category | Interaction Types | Drug Claim Name | Drug Name | PMIDs |
| Page: 1 |

Copyright 2023-Present -The University of Texas Health Science Center at Houston |