
|
|||||
|
 | |
| |
| |
| |
| |
| |
|
Gene: AMN |
Gene summary for AMN |
| Gene information | Species | Human | Gene symbol | AMN | Gene ID | 81693 |
| Gene name | amnion associated transmembrane protein | |
| Gene Alias | IGS2 | |
| Cytomap | 14q32.32 | |
| Gene Type | protein-coding | GO ID | GO:0003008 | UniProtAcc | Q9BXJ7 |
Top |
Malignant transformation analysis |
| Identification of the aberrant gene expression in precancerous and cancerous lesions by comparing the gene expression of stem-like cells in diseased tissues with normal stem cells |
| Entrez ID | Symbol | Replicates | Species | Organ | Tissue | Adj P-value | Log2FC | Malignancy |
| 81693 | AMN | HTA11_3410_2000001011 | Human | Colorectum | AD | 6.23e-03 | -1.69e-01 | 0.0155 |
| 81693 | AMN | HTA11_2487_2000001011 | Human | Colorectum | SER | 1.96e-12 | 7.66e-01 | -0.1808 |
| 81693 | AMN | HTA11_347_2000001011 | Human | Colorectum | AD | 1.42e-14 | 6.06e-01 | -0.1954 |
| 81693 | AMN | HTA11_411_2000001011 | Human | Colorectum | SER | 5.86e-03 | 1.01e+00 | -0.2602 |
| 81693 | AMN | HTA11_83_2000001011 | Human | Colorectum | SER | 3.34e-03 | 3.38e-01 | -0.1526 |
| 81693 | AMN | HTA11_696_2000001011 | Human | Colorectum | AD | 2.27e-05 | 3.43e-01 | -0.1464 |
| 81693 | AMN | HTA11_866_2000001011 | Human | Colorectum | AD | 5.19e-03 | 2.82e-01 | -0.1001 |
| 81693 | AMN | HTA11_866_3004761011 | Human | Colorectum | AD | 8.43e-03 | -2.19e-01 | 0.096 |
| 81693 | AMN | HTA11_7469_2000001011 | Human | Colorectum | AD | 8.55e-03 | 4.03e-01 | -0.0124 |
| 81693 | AMN | HTA11_99999971662_82457 | Human | Colorectum | MSS | 2.65e-02 | -2.99e-01 | 0.3859 |
| 81693 | AMN | A015-C-203 | Human | Colorectum | FAP | 2.05e-07 | 9.29e-02 | -0.1294 |
| 81693 | AMN | A001-C-119 | Human | Colorectum | FAP | 5.52e-04 | -3.55e-01 | -0.1557 |
| 81693 | AMN | A001-C-108 | Human | Colorectum | FAP | 1.54e-06 | -2.83e-01 | -0.0272 |
| 81693 | AMN | A002-C-205 | Human | Colorectum | FAP | 3.81e-03 | -1.75e-01 | -0.1236 |
| 81693 | AMN | A015-C-104 | Human | Colorectum | FAP | 1.47e-06 | -5.64e-02 | -0.1899 |
| 81693 | AMN | A002-C-016 | Human | Colorectum | FAP | 2.88e-03 | 7.74e-02 | 0.0521 |
| 81693 | AMN | A002-C-116 | Human | Colorectum | FAP | 7.76e-07 | -2.10e-01 | -0.0452 |
| 81693 | AMN | F034 | Human | Colorectum | FAP | 1.07e-05 | -2.66e-01 | -0.0665 |
| 81693 | AMN | LZE20T | Human | Esophagus | ESCC | 2.37e-09 | 2.58e-01 | 0.0662 |
| 81693 | AMN | LZE22T | Human | Esophagus | ESCC | 1.54e-04 | 2.94e-01 | 0.068 |
| Page: 1 2 3 4 5 6 |
| Tissue | Expression Dynamics | Abbreviation |
| Colorectum (GSE201348) |  | FAP: Familial adenomatous polyposis |
| CRC: Colorectal cancer | ||
| Colorectum (HTA11) |  | AD: Adenomas |
| SER: Sessile serrated lesions | ||
| MSI-H: Microsatellite-high colorectal cancer | ||
| MSS: Microsatellite stable colorectal cancer | ||
| Esophagus | 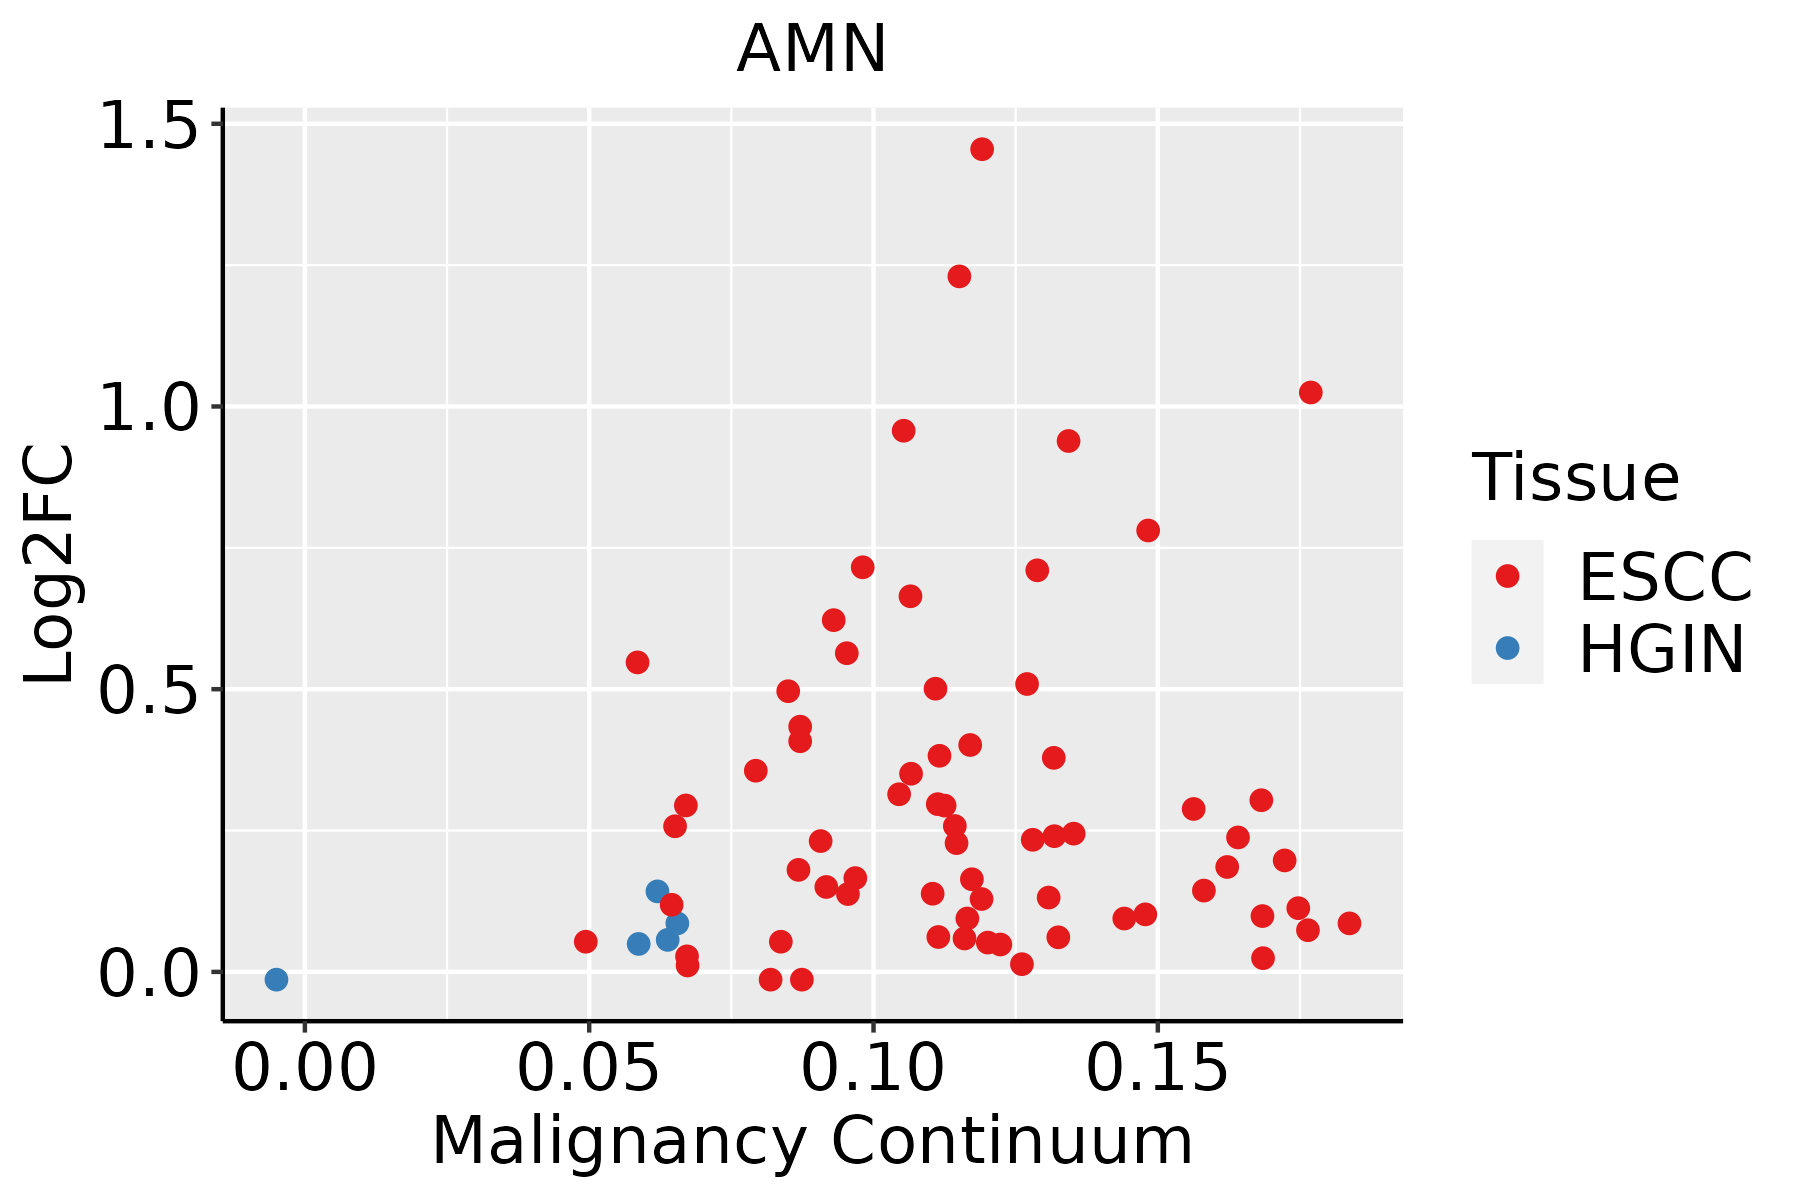 | ESCC: Esophageal squamous cell carcinoma |
| HGIN: High-grade intraepithelial neoplasias | ||
| LGIN: Low-grade intraepithelial neoplasias | ||
| GC | 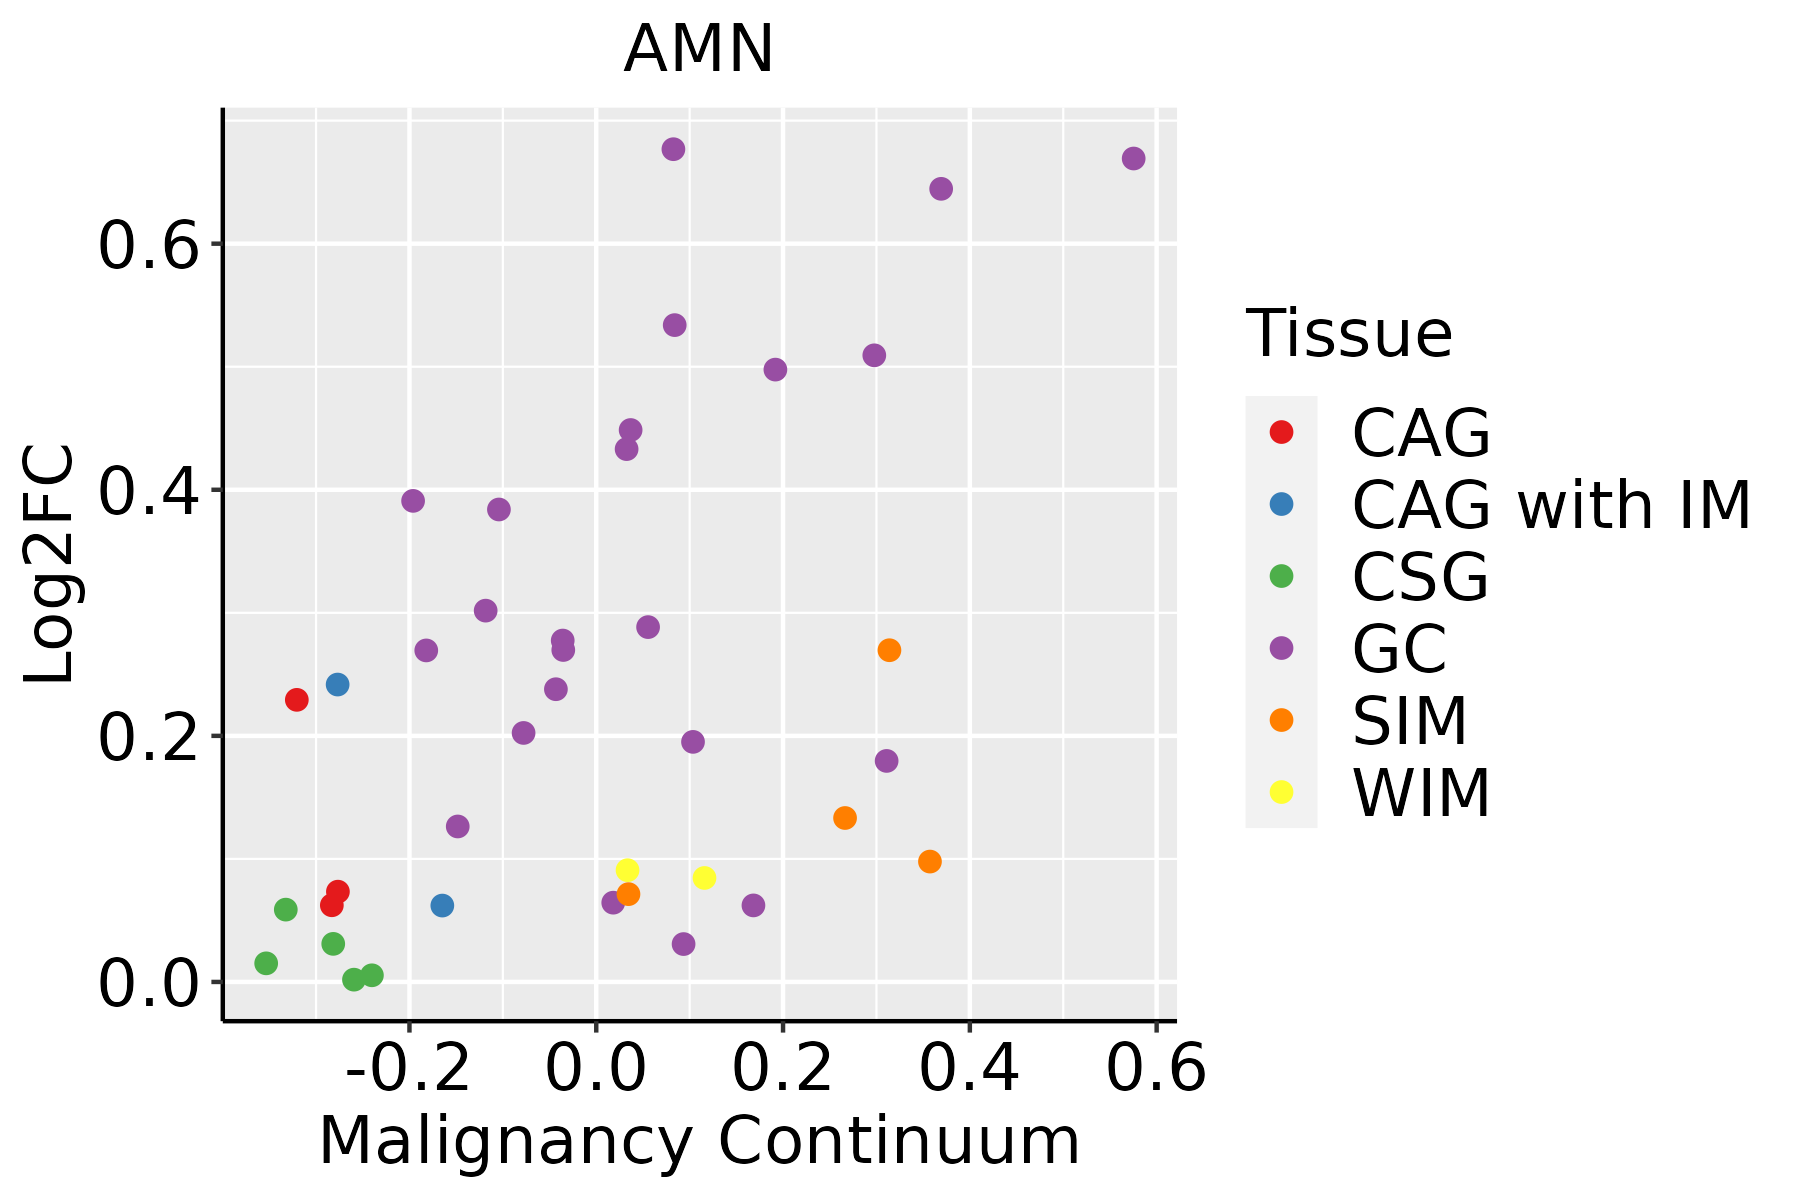 | CAG: Chronic atrophic gastritis |
| CAG with IM: Chronic atrophic gastritis with intestinal metaplasia | ||
| CSG: Chronic superficial gastritis | ||
| GC: Gastric cancer | ||
| SIM: Severe intestinal metaplasia | ||
| WIM: Wild intestinal metaplasia | ||
| Liver | 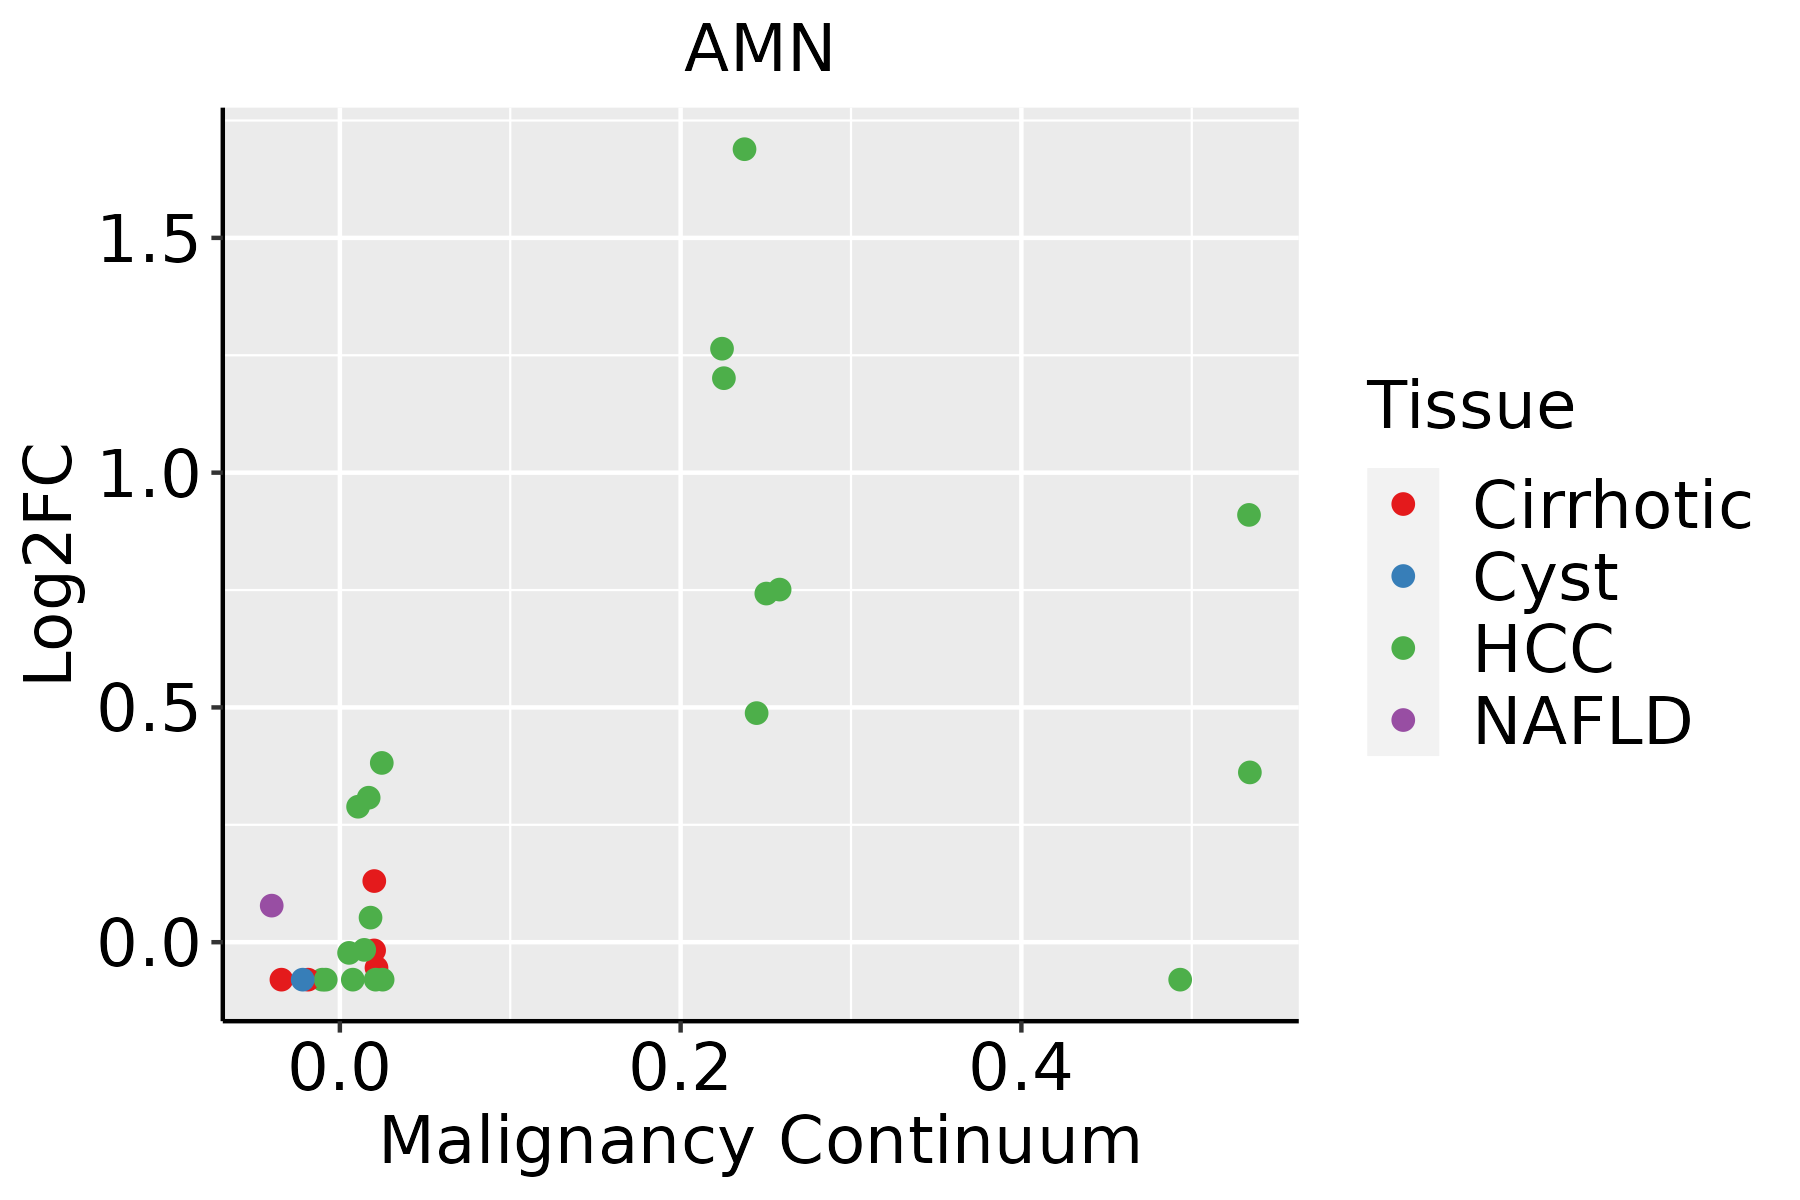 | HCC: Hepatocellular carcinoma |
| NAFLD: Non-alcoholic fatty liver disease | ||
| Oral Cavity |  | EOLP: Erosive Oral lichen planus |
| LP: leukoplakia | ||
| NEOLP: Non-erosive oral lichen planus | ||
| OSCC: Oral squamous cell carcinoma |
| ∗log2FC in expression of this searched gene in stem-like cells from each diseased tissue sample relative to stem-like cells in normal samples in each tissue plotted against the malignancy continuum. Samples are colored based on if they are from different disease stage. |
Top |
Malignant transformation related pathway analysis |
| Find out the enriched GO biological processes and KEGG pathways involved in transition from healthy to precancer to cancer |
| Tissue | Disease Stage | Enriched GO biological Processes |
| Colorectum | AD |  |
| Colorectum | SER |  |
| Colorectum | MSS |  |
| Colorectum | MSI-H |  |
| Colorectum | FAP |  |
| ∗Top 15 enriched GO BP terms are showed in the bar plot of each disease state in each tissue. Each row represents a significant GO biological process which is colored according to the -log10(p.adjust). |
| Page: 1 2 3 4 5 6 7 8 9 |
| GO ID | Tissue | Disease Stage | Description | Gene Ratio | Bg Ratio | pvalue | p.adjust | Count |
| GO:0072659 | Colorectum | AD | protein localization to plasma membrane | 122/3918 | 284/18723 | 2.86e-17 | 1.49e-14 | 122 |
| GO:1990778 | Colorectum | AD | protein localization to cell periphery | 129/3918 | 333/18723 | 5.51e-14 | 1.15e-11 | 129 |
| GO:0090150 | Colorectum | AD | establishment of protein localization to membrane | 100/3918 | 260/18723 | 6.01e-11 | 6.33e-09 | 100 |
| GO:0048193 | Colorectum | AD | Golgi vesicle transport | 109/3918 | 296/18723 | 1.80e-10 | 1.68e-08 | 109 |
| GO:0098876 | Colorectum | AD | vesicle-mediated transport to the plasma membrane | 57/3918 | 136/18723 | 2.30e-08 | 1.27e-06 | 57 |
| GO:0061951 | Colorectum | AD | establishment of protein localization to plasma membrane | 31/3918 | 60/18723 | 1.37e-07 | 6.42e-06 | 31 |
| GO:0006892 | Colorectum | AD | post-Golgi vesicle-mediated transport | 45/3918 | 104/18723 | 2.22e-07 | 9.26e-06 | 45 |
| GO:0043001 | Colorectum | AD | Golgi to plasma membrane protein transport | 21/3918 | 40/18723 | 1.03e-05 | 2.40e-04 | 21 |
| GO:0006893 | Colorectum | AD | Golgi to plasma membrane transport | 27/3918 | 60/18723 | 2.41e-05 | 4.66e-04 | 27 |
| GO:0006898 | Colorectum | AD | receptor-mediated endocytosis | 76/3918 | 244/18723 | 1.07e-04 | 1.59e-03 | 76 |
| GO:00726591 | Colorectum | SER | protein localization to plasma membrane | 92/2897 | 284/18723 | 6.36e-13 | 1.86e-10 | 92 |
| GO:19907781 | Colorectum | SER | protein localization to cell periphery | 98/2897 | 333/18723 | 6.09e-11 | 9.57e-09 | 98 |
| GO:00481931 | Colorectum | SER | Golgi vesicle transport | 79/2897 | 296/18723 | 4.20e-07 | 2.15e-05 | 79 |
| GO:00901501 | Colorectum | SER | establishment of protein localization to membrane | 68/2897 | 260/18723 | 5.55e-06 | 2.01e-04 | 68 |
| GO:00068921 | Colorectum | SER | post-Golgi vesicle-mediated transport | 31/2897 | 104/18723 | 1.59e-04 | 3.08e-03 | 31 |
| GO:00988761 | Colorectum | SER | vesicle-mediated transport to the plasma membrane | 37/2897 | 136/18723 | 3.08e-04 | 5.00e-03 | 37 |
| GO:00619511 | Colorectum | SER | establishment of protein localization to plasma membrane | 20/2897 | 60/18723 | 4.60e-04 | 6.65e-03 | 20 |
| GO:00430011 | Colorectum | SER | Golgi to plasma membrane protein transport | 14/2897 | 40/18723 | 1.88e-03 | 1.90e-02 | 14 |
| GO:00726592 | Colorectum | MSS | protein localization to plasma membrane | 113/3467 | 284/18723 | 3.23e-17 | 1.55e-14 | 113 |
| GO:19907782 | Colorectum | MSS | protein localization to cell periphery | 120/3467 | 333/18723 | 2.02e-14 | 5.47e-12 | 120 |
| Page: 1 2 3 4 |
| Pathway ID | Tissue | Disease Stage | Description | Gene Ratio | Bg Ratio | pvalue | p.adjust | qvalue | Count |
| Page: 1 |
Top |
Cell-cell communication analysis |
| Identification of potential cell-cell interactions between two cell types and their ligand-receptor pairs for different disease states |
| Ligand | Receptor | LRpair | Pathway | Tissue | Disease Stage |
| Page: 1 |
Top |
Single-cell gene regulatory network inference analysis |
| Find out the significant the regulons (TFs) and the target genes of each regulon across cell types for different disease states |
| TF | Cell Type | Tissue | Disease Stage | Target Gene | RSS | Regulon Activity |
| ∗The dot plots of a searched regulon are shown for all cell subpopulations in each disease state of each tissue based on the regulon specific score inferred using pySCENIC and by calculating the average expression. |
| Page: 1 |
Top |
Somatic mutation of malignant transformation related genes |
| Annotation of somatic variants for genes involved in malignant transformation |
| Hugo Symbol | Variant Class | Variant Classification | dbSNP RS | HGVSc | HGVSp | HGVSp Short | SWISSPROT | BIOTYPE | SIFT | PolyPhen | Tumor Sample Barcode | Tissue | Histology | Sex | Age | Stage | Therapy Types | Drugs | Outcome |
| AMN | SNV | Missense_Mutation | c.391N>A | p.Asp131Asn | p.D131N | Q9BXJ7 | protein_coding | deleterious(0.01) | probably_damaging(0.989) | TCGA-AR-A24H-01 | Breast | breast invasive carcinoma | Female | >=65 | I/II | Hormone Therapy | tamoxiphen | SD | |
| AMN | deletion | Frame_Shift_Del | novel | c.409delN | p.Cys137AlafsTer62 | p.C137Afs*62 | Q9BXJ7 | protein_coding | TCGA-EW-A2FV-01 | Breast | breast invasive carcinoma | Female | <65 | III/IV | Chemotherapy | docetaxel | SD | ||
| AMN | SNV | Missense_Mutation | rs866956966 | c.193N>A | p.Ala65Thr | p.A65T | Q9BXJ7 | protein_coding | tolerated(0.21) | benign(0.09) | TCGA-D5-6530-01 | Colorectum | colon adenocarcinoma | Male | <65 | I/II | Unknown | Unknown | SD |
| AMN | SNV | Missense_Mutation | c.86N>G | p.Asp29Gly | p.D29G | Q9BXJ7 | protein_coding | tolerated(0.06) | benign(0.086) | TCGA-EI-6511-01 | Colorectum | rectum adenocarcinoma | Male | <65 | III/IV | Chemotherapy | oxaliplatinum+5-fu | SD | |
| AMN | SNV | Missense_Mutation | c.56N>T | p.Ala19Val | p.A19V | Q9BXJ7 | protein_coding | deleterious(0) | probably_damaging(0.95) | TCGA-F5-6814-01 | Colorectum | rectum adenocarcinoma | Male | <65 | I/II | Unknown | Unknown | SD | |
| AMN | SNV | Missense_Mutation | novel | c.211C>A | p.Leu71Met | p.L71M | Q9BXJ7 | protein_coding | deleterious(0.04) | probably_damaging(0.994) | TCGA-A5-A1OF-01 | Endometrium | uterine corpus endometrioid carcinoma | Female | <65 | I/II | Unknown | Unknown | SD |
| AMN | SNV | Missense_Mutation | novel | c.709N>A | p.Ala237Thr | p.A237T | Q9BXJ7 | protein_coding | tolerated(0.36) | benign(0.297) | TCGA-AP-A1DV-01 | Endometrium | uterine corpus endometrioid carcinoma | Female | <65 | I/II | Unknown | Unknown | SD |
| AMN | SNV | Missense_Mutation | novel | c.763N>A | p.Ala255Thr | p.A255T | Q9BXJ7 | protein_coding | deleterious(0) | benign(0.346) | TCGA-B5-A1MR-01 | Endometrium | uterine corpus endometrioid carcinoma | Female | >=65 | III/IV | Unknown | Unknown | SD |
| AMN | SNV | Missense_Mutation | c.401N>A | p.Arg134His | p.R134H | Q9BXJ7 | protein_coding | deleterious(0) | probably_damaging(0.933) | TCGA-D1-A103-01 | Endometrium | uterine corpus endometrioid carcinoma | Female | >=65 | I/II | Unknown | Unknown | SD | |
| AMN | SNV | Missense_Mutation | c.86N>T | p.Asp29Val | p.D29V | Q9BXJ7 | protein_coding | deleterious(0) | benign(0.39) | TCGA-D1-A2G5-01 | Endometrium | uterine corpus endometrioid carcinoma | Female | <65 | I/II | Unknown | Unknown | PD |
| Page: 1 2 |
Top |
Related drugs of malignant transformation related genes |
| Identification of chemicals and drugs interact with genes involved in malignant transfromation |
| (DGIdb 4.0) |
| Entrez ID | Symbol | Category | Interaction Types | Drug Claim Name | Drug Name | PMIDs |
| Page: 1 |

Copyright 2023-Present -The University of Texas Health Science Center at Houston |