
|
|||||
|
 | |
| |
| |
| |
| |
| |
|
Gene: AMMECR1 |
Gene summary for AMMECR1 |
| Gene information | Species | Human | Gene symbol | AMMECR1 | Gene ID | 9949 |
| Gene name | AMMECR nuclear protein 1 | |
| Gene Alias | AMMERC1 | |
| Cytomap | Xq23 | |
| Gene Type | protein-coding | GO ID | GO:0008150 | UniProtAcc | A0A0S2Z4V0 |
Top |
Malignant transformation analysis |
| Identification of the aberrant gene expression in precancerous and cancerous lesions by comparing the gene expression of stem-like cells in diseased tissues with normal stem cells |
| Entrez ID | Symbol | Replicates | Species | Organ | Tissue | Adj P-value | Log2FC | Malignancy |
| 9949 | AMMECR1 | LZE4T | Human | Esophagus | ESCC | 5.72e-06 | 1.95e-01 | 0.0811 |
| 9949 | AMMECR1 | LZE5T | Human | Esophagus | ESCC | 1.62e-02 | 2.43e-01 | 0.0514 |
| 9949 | AMMECR1 | LZE7T | Human | Esophagus | ESCC | 3.89e-02 | 2.80e-01 | 0.0667 |
| 9949 | AMMECR1 | LZE24T | Human | Esophagus | ESCC | 9.53e-15 | 3.17e-01 | 0.0596 |
| 9949 | AMMECR1 | P1T-E | Human | Esophagus | ESCC | 6.49e-04 | 1.66e-01 | 0.0875 |
| 9949 | AMMECR1 | P2T-E | Human | Esophagus | ESCC | 7.38e-12 | 1.62e-01 | 0.1177 |
| 9949 | AMMECR1 | P4T-E | Human | Esophagus | ESCC | 7.42e-10 | 2.23e-01 | 0.1323 |
| 9949 | AMMECR1 | P5T-E | Human | Esophagus | ESCC | 4.83e-04 | 9.92e-02 | 0.1327 |
| 9949 | AMMECR1 | P8T-E | Human | Esophagus | ESCC | 8.89e-13 | 1.57e-01 | 0.0889 |
| 9949 | AMMECR1 | P9T-E | Human | Esophagus | ESCC | 5.08e-09 | 2.41e-01 | 0.1131 |
| 9949 | AMMECR1 | P10T-E | Human | Esophagus | ESCC | 1.69e-05 | 1.43e-01 | 0.116 |
| 9949 | AMMECR1 | P12T-E | Human | Esophagus | ESCC | 2.22e-21 | 3.07e-01 | 0.1122 |
| 9949 | AMMECR1 | P15T-E | Human | Esophagus | ESCC | 3.65e-05 | 1.38e-01 | 0.1149 |
| 9949 | AMMECR1 | P20T-E | Human | Esophagus | ESCC | 3.54e-08 | 2.13e-01 | 0.1124 |
| 9949 | AMMECR1 | P21T-E | Human | Esophagus | ESCC | 2.03e-02 | 8.64e-02 | 0.1617 |
| 9949 | AMMECR1 | P22T-E | Human | Esophagus | ESCC | 9.08e-10 | 2.54e-01 | 0.1236 |
| 9949 | AMMECR1 | P23T-E | Human | Esophagus | ESCC | 9.04e-24 | 5.67e-01 | 0.108 |
| 9949 | AMMECR1 | P24T-E | Human | Esophagus | ESCC | 9.21e-13 | 2.32e-01 | 0.1287 |
| 9949 | AMMECR1 | P26T-E | Human | Esophagus | ESCC | 1.63e-22 | 3.69e-01 | 0.1276 |
| 9949 | AMMECR1 | P27T-E | Human | Esophagus | ESCC | 5.22e-08 | 1.92e-01 | 0.1055 |
| Page: 1 2 3 4 |
| Tissue | Expression Dynamics | Abbreviation |
| Esophagus | 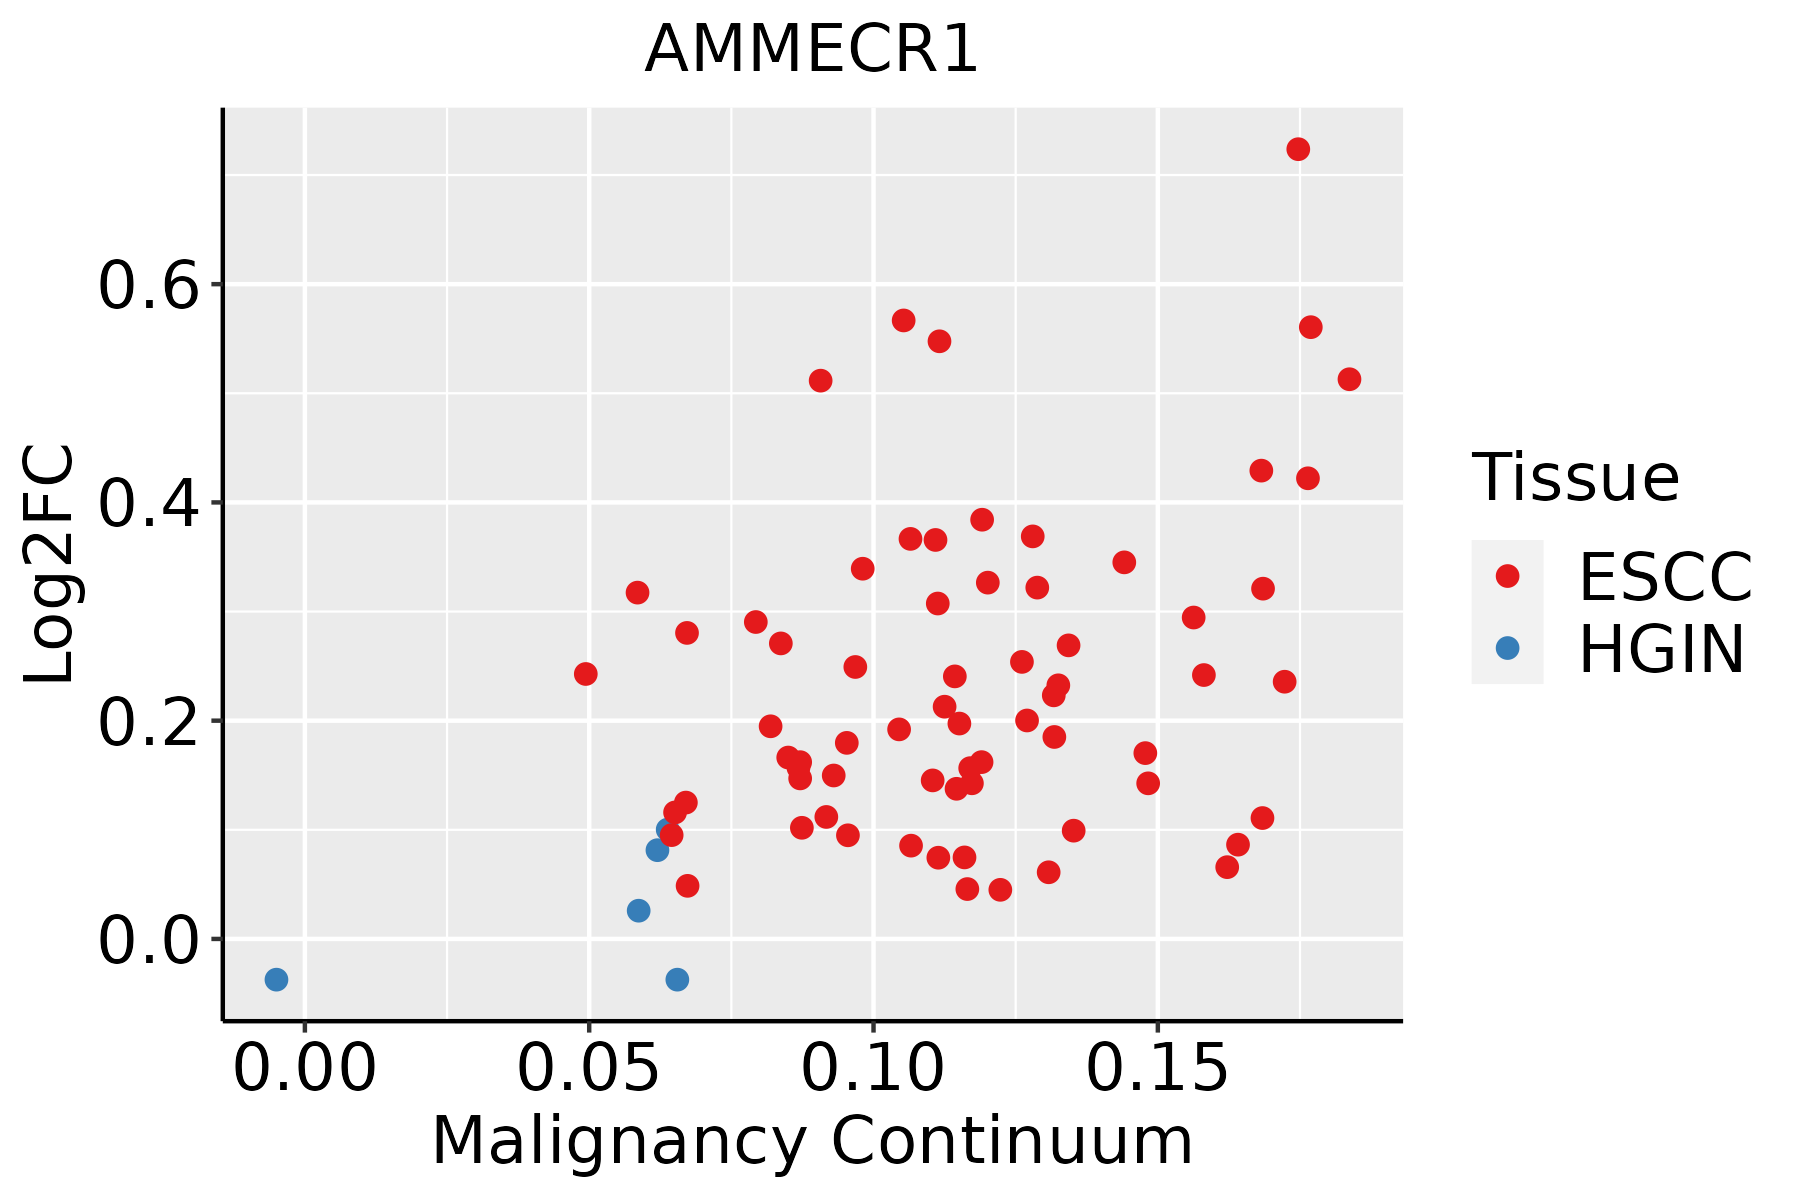 | ESCC: Esophageal squamous cell carcinoma |
| HGIN: High-grade intraepithelial neoplasias | ||
| LGIN: Low-grade intraepithelial neoplasias | ||
| Oral Cavity |  | EOLP: Erosive Oral lichen planus |
| LP: leukoplakia | ||
| NEOLP: Non-erosive oral lichen planus | ||
| OSCC: Oral squamous cell carcinoma | ||
| Skin | 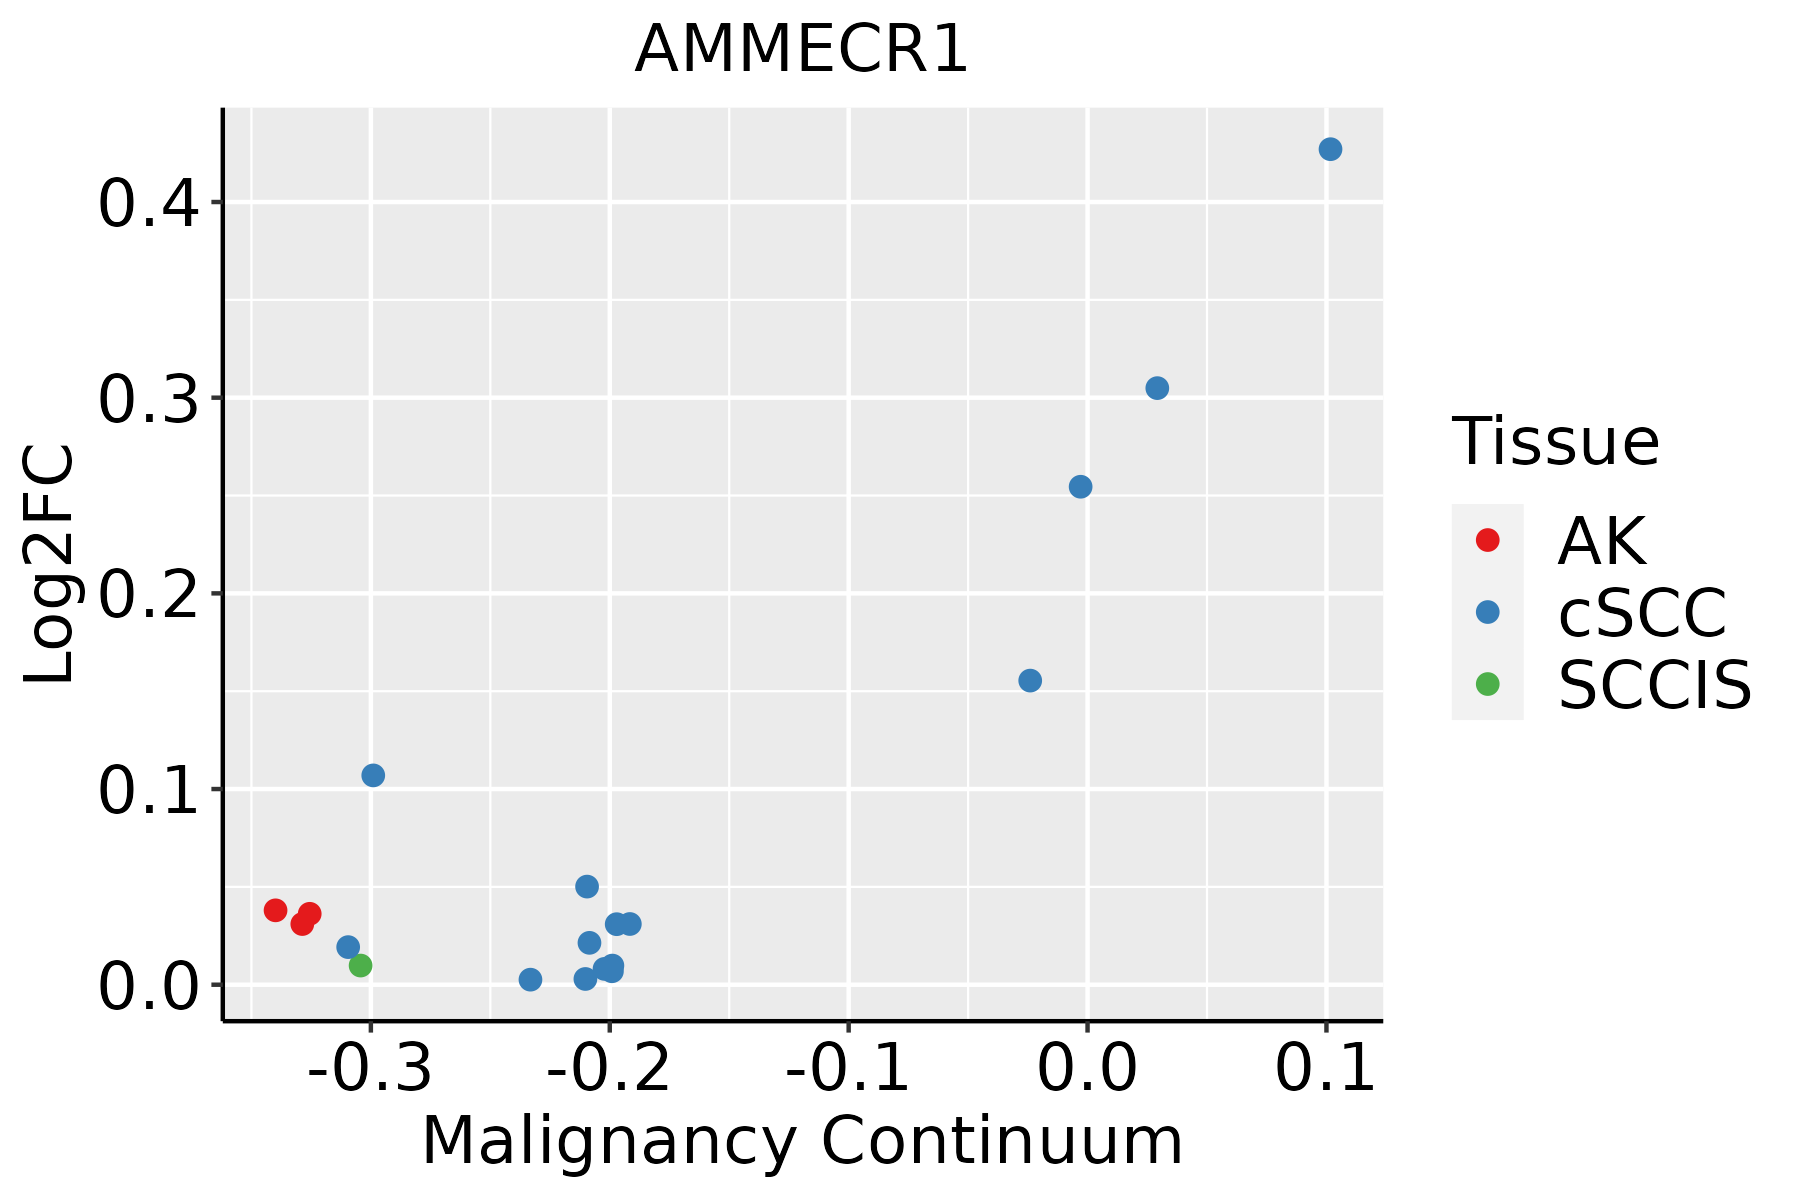 | AK: Actinic keratosis |
| cSCC: Cutaneous squamous cell carcinoma | ||
| SCCIS:squamous cell carcinoma in situ |
| ∗log2FC in expression of this searched gene in stem-like cells from each diseased tissue sample relative to stem-like cells in normal samples in each tissue plotted against the malignancy continuum. Samples are colored based on if they are from different disease stage. |
Top |
Malignant transformation related pathway analysis |
| Find out the enriched GO biological processes and KEGG pathways involved in transition from healthy to precancer to cancer |
| Tissue | Disease Stage | Enriched GO biological Processes |
| Colorectum | AD |  |
| Colorectum | SER |  |
| Colorectum | MSS |  |
| Colorectum | MSI-H |  |
| Colorectum | FAP |  |
| ∗Top 15 enriched GO BP terms are showed in the bar plot of each disease state in each tissue. Each row represents a significant GO biological process which is colored according to the -log10(p.adjust). |
| Page: 1 2 3 4 5 6 7 8 9 |
| GO ID | Tissue | Disease Stage | Description | Gene Ratio | Bg Ratio | pvalue | p.adjust | Count |
| Page: 1 |
| Pathway ID | Tissue | Disease Stage | Description | Gene Ratio | Bg Ratio | pvalue | p.adjust | qvalue | Count |
| Page: 1 |
Top |
Cell-cell communication analysis |
| Identification of potential cell-cell interactions between two cell types and their ligand-receptor pairs for different disease states |
| Ligand | Receptor | LRpair | Pathway | Tissue | Disease Stage |
| Page: 1 |
Top |
Single-cell gene regulatory network inference analysis |
| Find out the significant the regulons (TFs) and the target genes of each regulon across cell types for different disease states |
| TF | Cell Type | Tissue | Disease Stage | Target Gene | RSS | Regulon Activity |
| ∗The dot plots of a searched regulon are shown for all cell subpopulations in each disease state of each tissue based on the regulon specific score inferred using pySCENIC and by calculating the average expression. |
| Page: 1 |
Top |
Somatic mutation of malignant transformation related genes |
| Annotation of somatic variants for genes involved in malignant transformation |
| Hugo Symbol | Variant Class | Variant Classification | dbSNP RS | HGVSc | HGVSp | HGVSp Short | SWISSPROT | BIOTYPE | SIFT | PolyPhen | Tumor Sample Barcode | Tissue | Histology | Sex | Age | Stage | Therapy Types | Drugs | Outcome |
| AMMECR1 | SNV | Missense_Mutation | c.275G>C | p.Gly92Ala | p.G92A | Q9Y4X0 | protein_coding | tolerated(0.06) | benign(0.037) | TCGA-IR-A3LH-01 | Cervix | cervical & endocervical cancer | Female | <65 | I/II | Chemotherapy | cisplatin | CR | |
| AMMECR1 | SNV | Missense_Mutation | novel | c.548N>C | p.Asn183Thr | p.N183T | Q9Y4X0 | protein_coding | tolerated(0.08) | benign(0.261) | TCGA-AA-3984-01 | Colorectum | colon adenocarcinoma | Female | <65 | I/II | Unknown | Unknown | SD |
| AMMECR1 | SNV | Missense_Mutation | novel | c.181N>A | p.Gly61Arg | p.G61R | Q9Y4X0 | protein_coding | deleterious_low_confidence(0.05) | benign(0) | TCGA-CK-4951-01 | Colorectum | colon adenocarcinoma | Female | >=65 | I/II | Unknown | Unknown | PD |
| AMMECR1 | SNV | Missense_Mutation | c.764N>G | p.Tyr255Cys | p.Y255C | Q9Y4X0 | protein_coding | deleterious(0) | probably_damaging(0.996) | TCGA-DM-A1D0-01 | Colorectum | colon adenocarcinoma | Female | >=65 | I/II | Unknown | Unknown | SD | |
| AMMECR1 | SNV | Missense_Mutation | c.989A>G | p.Asn330Ser | p.N330S | Q9Y4X0 | protein_coding | deleterious_low_confidence(0.01) | benign(0.214) | TCGA-G4-6302-01 | Colorectum | colon adenocarcinoma | Female | >=65 | I/II | Unknown | Unknown | SD | |
| AMMECR1 | SNV | Missense_Mutation | c.299N>T | p.Pro100Leu | p.P100L | Q9Y4X0 | protein_coding | tolerated(0.16) | benign(0.019) | TCGA-QG-A5YW-01 | Colorectum | colon adenocarcinoma | Female | <65 | III/IV | Chemotherapy | capecitabine | CR | |
| AMMECR1 | deletion | Frame_Shift_Del | c.893delN | p.Arg298LeufsTer5 | p.R298Lfs*5 | Q9Y4X0 | protein_coding | TCGA-AZ-6598-01 | Colorectum | colon adenocarcinoma | Female | >=65 | I/II | Unknown | Unknown | SD | |||
| AMMECR1 | SNV | Missense_Mutation | novel | c.302C>T | p.Ala101Val | p.A101V | Q9Y4X0 | protein_coding | tolerated(0.22) | benign(0.01) | TCGA-A5-A1OF-01 | Endometrium | uterine corpus endometrioid carcinoma | Female | <65 | I/II | Unknown | Unknown | SD |
| AMMECR1 | SNV | Missense_Mutation | novel | c.546N>T | p.Met182Ile | p.M182I | Q9Y4X0 | protein_coding | deleterious(0.05) | benign(0.261) | TCGA-AJ-A3EL-01 | Endometrium | uterine corpus endometrioid carcinoma | Female | <65 | I/II | Unknown | Unknown | SD |
| AMMECR1 | SNV | Missense_Mutation | novel | c.602N>A | p.Arg201His | p.R201H | Q9Y4X0 | protein_coding | deleterious(0) | probably_damaging(0.999) | TCGA-AJ-A8CW-01 | Endometrium | uterine corpus endometrioid carcinoma | Female | <65 | I/II | Unknown | Unknown | SD |
| Page: 1 2 3 4 |
Top |
Related drugs of malignant transformation related genes |
| Identification of chemicals and drugs interact with genes involved in malignant transfromation |
| (DGIdb 4.0) |
| Entrez ID | Symbol | Category | Interaction Types | Drug Claim Name | Drug Name | PMIDs |
| Page: 1 |

Copyright 2023-Present -The University of Texas Health Science Center at Houston |