
|
|||||
|
 | |
| |
| |
| |
| |
| |
|
Gene: AMIGO2 |
Gene summary for AMIGO2 |
| Gene information | Species | Human | Gene symbol | AMIGO2 | Gene ID | 347902 |
| Gene name | adhesion molecule with Ig like domain 2 | |
| Gene Alias | ALI1 | |
| Cytomap | 12q13.11 | |
| Gene Type | protein-coding | GO ID | GO:0006915 | UniProtAcc | A0A024R127 |
Top |
Malignant transformation analysis |
| Identification of the aberrant gene expression in precancerous and cancerous lesions by comparing the gene expression of stem-like cells in diseased tissues with normal stem cells |
| Entrez ID | Symbol | Replicates | Species | Organ | Tissue | Adj P-value | Log2FC | Malignancy |
| 347902 | AMIGO2 | LZE20T | Human | Esophagus | ESCC | 5.12e-04 | 2.17e-01 | 0.0662 |
| 347902 | AMIGO2 | P5T-E | Human | Esophagus | ESCC | 5.37e-43 | 8.43e-01 | 0.1327 |
| 347902 | AMIGO2 | P8T-E | Human | Esophagus | ESCC | 5.07e-03 | 3.61e-02 | 0.0889 |
| 347902 | AMIGO2 | P9T-E | Human | Esophagus | ESCC | 2.44e-03 | 6.09e-02 | 0.1131 |
| 347902 | AMIGO2 | P11T-E | Human | Esophagus | ESCC | 1.39e-04 | 2.96e-01 | 0.1426 |
| 347902 | AMIGO2 | P12T-E | Human | Esophagus | ESCC | 8.30e-09 | 1.31e-01 | 0.1122 |
| 347902 | AMIGO2 | P15T-E | Human | Esophagus | ESCC | 1.58e-02 | 4.46e-02 | 0.1149 |
| 347902 | AMIGO2 | P16T-E | Human | Esophagus | ESCC | 4.72e-03 | 4.60e-02 | 0.1153 |
| 347902 | AMIGO2 | P17T-E | Human | Esophagus | ESCC | 3.92e-02 | 1.46e-01 | 0.1278 |
| 347902 | AMIGO2 | P21T-E | Human | Esophagus | ESCC | 1.07e-15 | 3.09e-01 | 0.1617 |
| 347902 | AMIGO2 | P24T-E | Human | Esophagus | ESCC | 1.47e-02 | 9.05e-02 | 0.1287 |
| 347902 | AMIGO2 | P26T-E | Human | Esophagus | ESCC | 7.07e-03 | 6.48e-02 | 0.1276 |
| 347902 | AMIGO2 | P31T-E | Human | Esophagus | ESCC | 1.38e-05 | 2.40e-01 | 0.1251 |
| 347902 | AMIGO2 | P32T-E | Human | Esophagus | ESCC | 5.71e-19 | 4.80e-01 | 0.1666 |
| 347902 | AMIGO2 | P37T-E | Human | Esophagus | ESCC | 1.99e-21 | 6.83e-01 | 0.1371 |
| 347902 | AMIGO2 | P42T-E | Human | Esophagus | ESCC | 3.26e-02 | 1.65e-01 | 0.1175 |
| 347902 | AMIGO2 | P44T-E | Human | Esophagus | ESCC | 6.30e-05 | 1.26e-01 | 0.1096 |
| 347902 | AMIGO2 | P47T-E | Human | Esophagus | ESCC | 6.83e-04 | 6.91e-02 | 0.1067 |
| 347902 | AMIGO2 | P48T-E | Human | Esophagus | ESCC | 1.01e-06 | 5.85e-02 | 0.0959 |
| 347902 | AMIGO2 | P52T-E | Human | Esophagus | ESCC | 8.27e-03 | 9.75e-02 | 0.1555 |
| Page: 1 2 3 |
| Tissue | Expression Dynamics | Abbreviation |
| Esophagus | 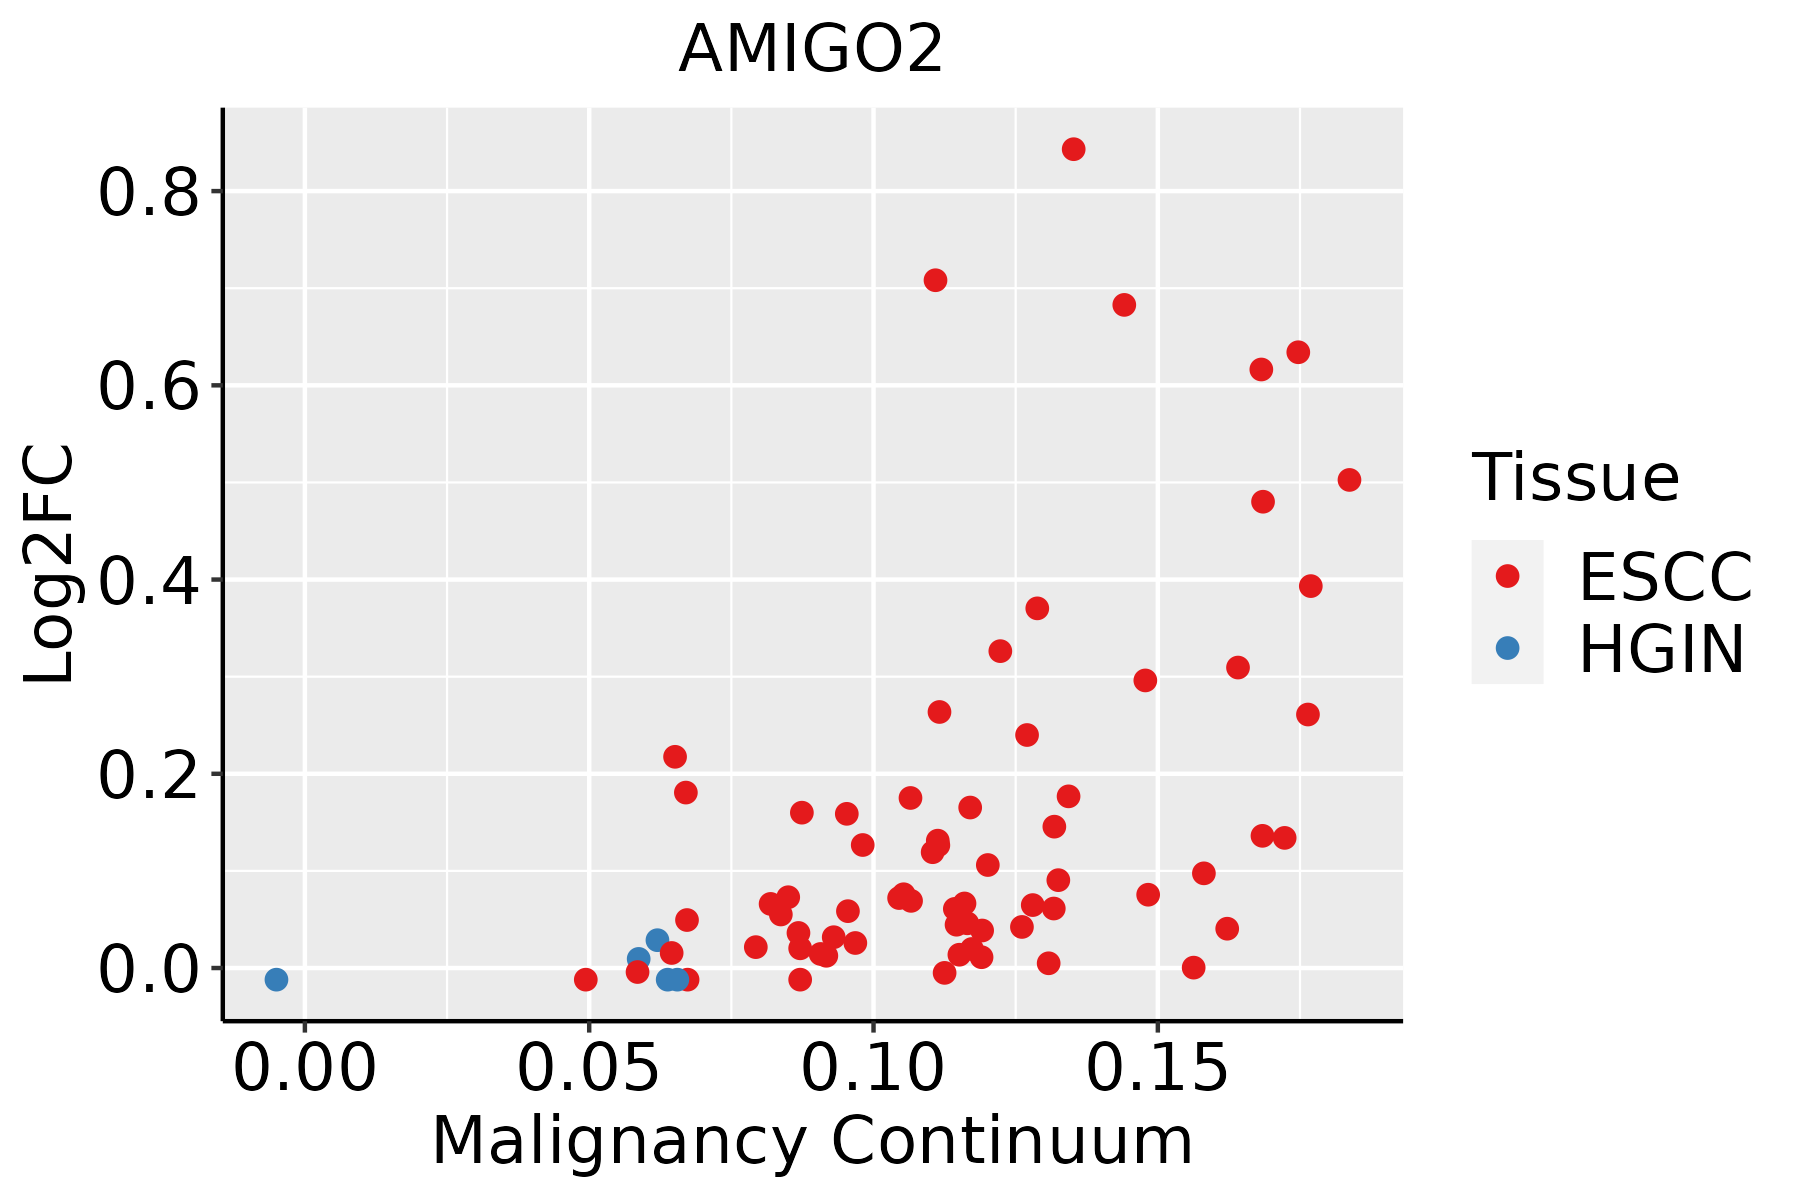 | ESCC: Esophageal squamous cell carcinoma |
| HGIN: High-grade intraepithelial neoplasias | ||
| LGIN: Low-grade intraepithelial neoplasias | ||
| Oral Cavity | 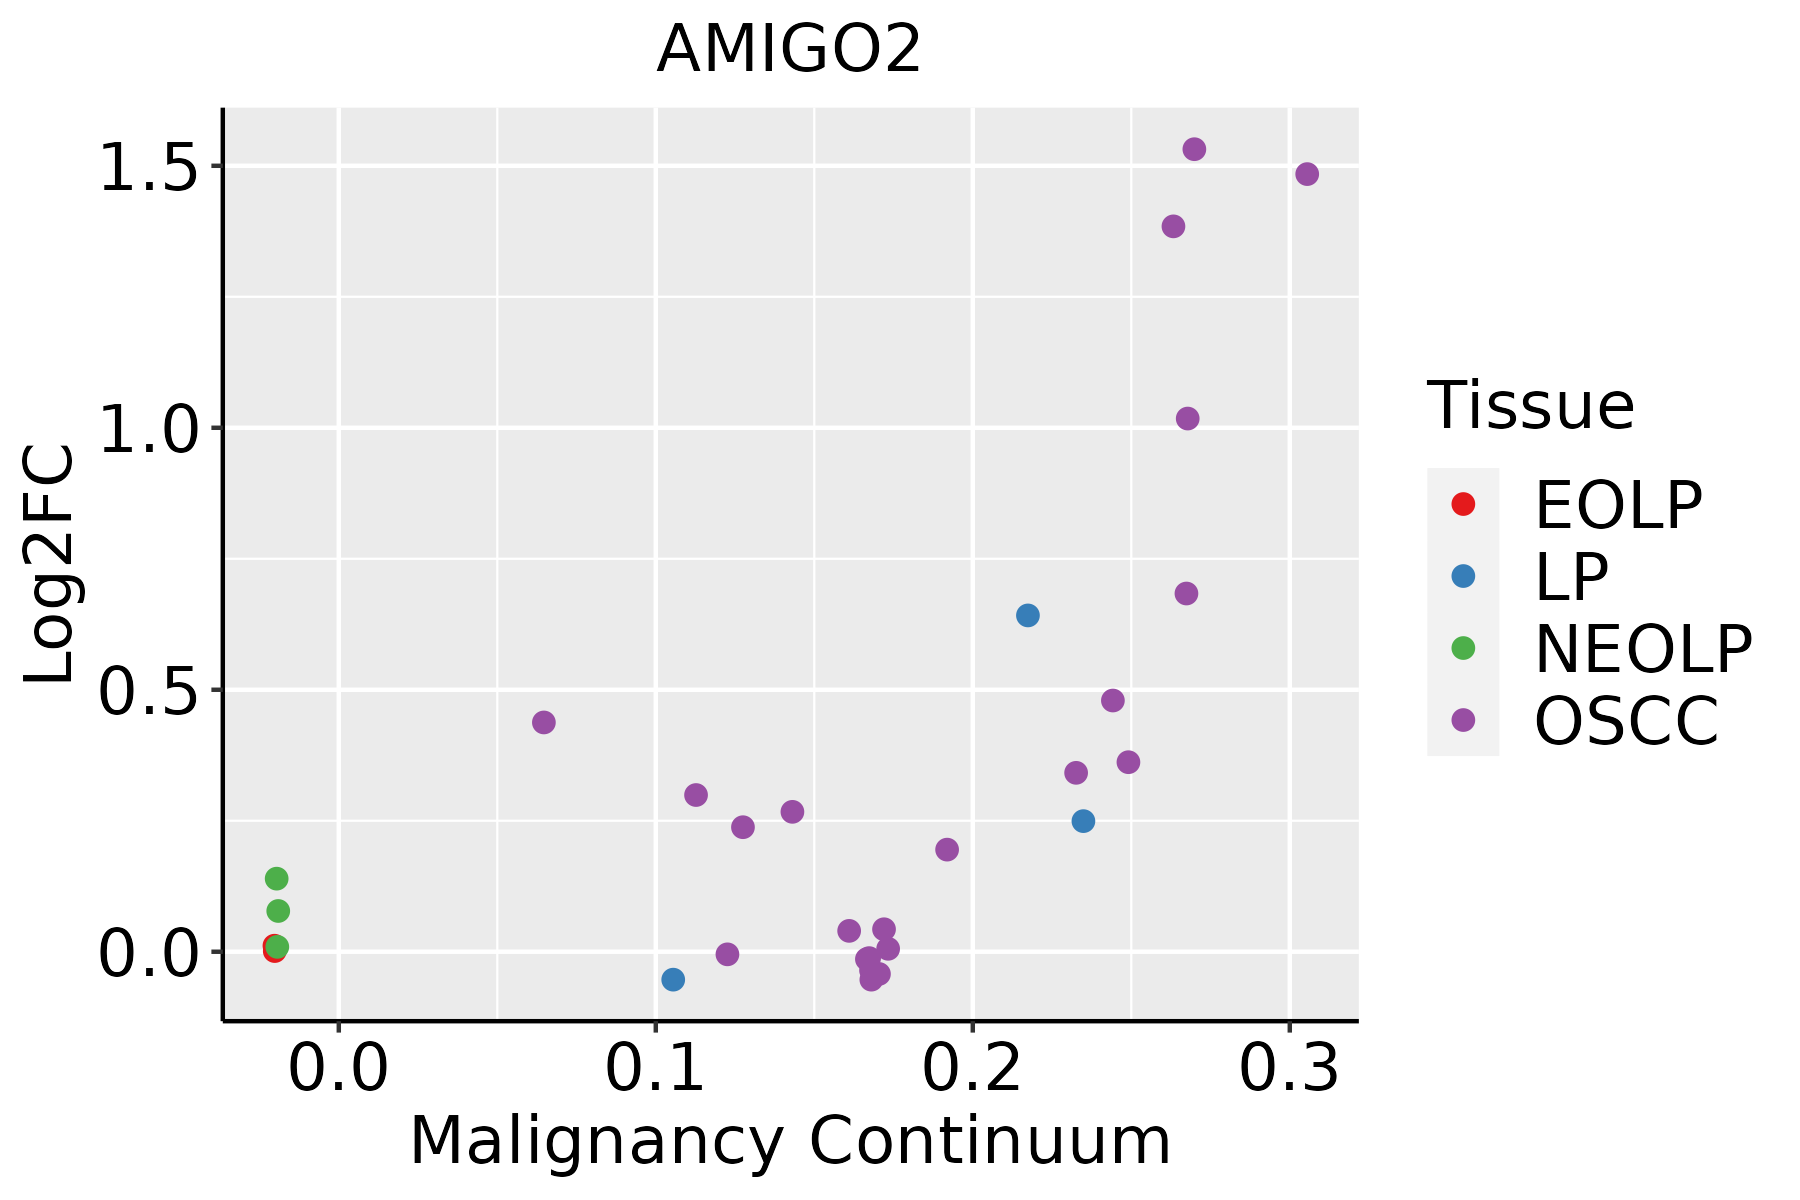 | EOLP: Erosive Oral lichen planus |
| LP: leukoplakia | ||
| NEOLP: Non-erosive oral lichen planus | ||
| OSCC: Oral squamous cell carcinoma | ||
| Thyroid | 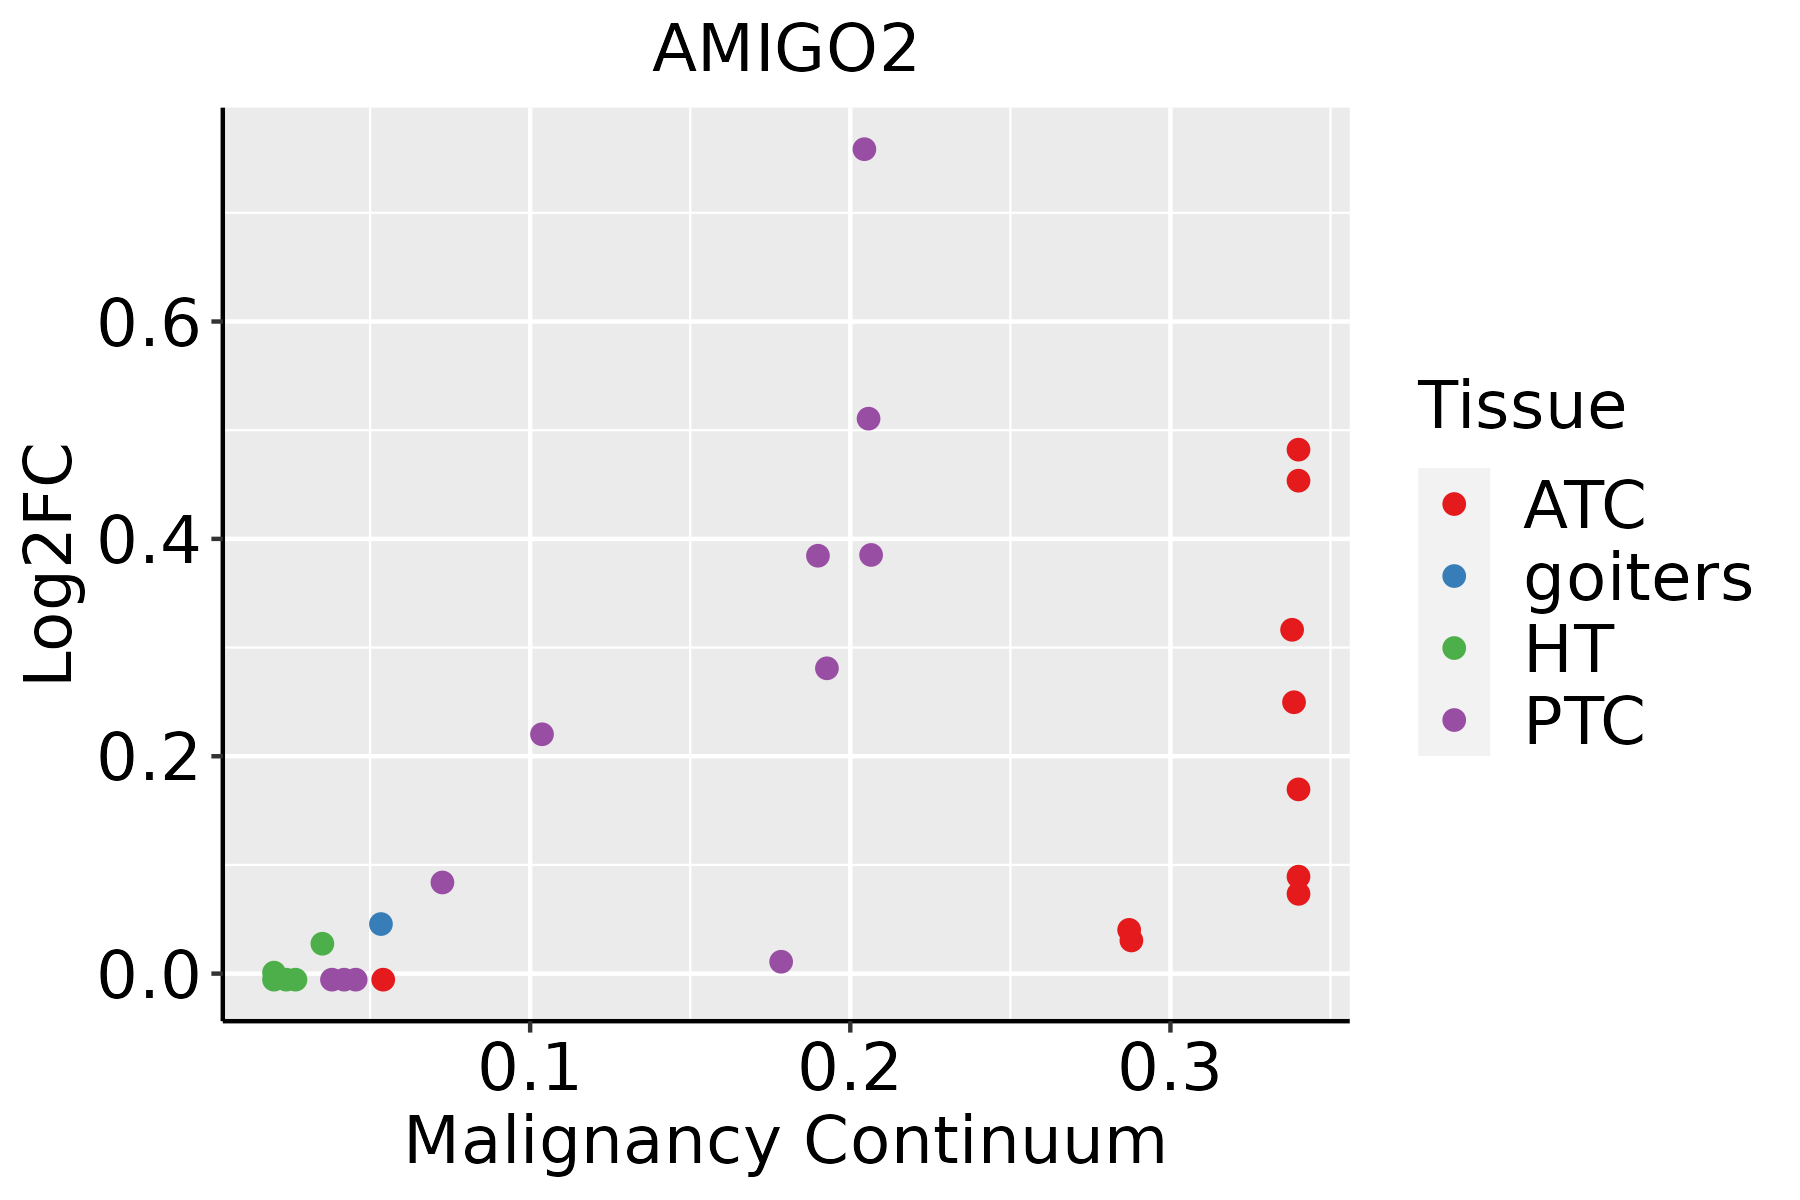 | ATC: Anaplastic thyroid cancer |
| HT: Hashimoto's thyroiditis | ||
| PTC: Papillary thyroid cancer |
| ∗log2FC in expression of this searched gene in stem-like cells from each diseased tissue sample relative to stem-like cells in normal samples in each tissue plotted against the malignancy continuum. Samples are colored based on if they are from different disease stage. |
Top |
Malignant transformation related pathway analysis |
| Find out the enriched GO biological processes and KEGG pathways involved in transition from healthy to precancer to cancer |
| Tissue | Disease Stage | Enriched GO biological Processes |
| Colorectum | AD |  |
| Colorectum | SER |  |
| Colorectum | MSS |  |
| Colorectum | MSI-H |  |
| Colorectum | FAP |  |
| ∗Top 15 enriched GO BP terms are showed in the bar plot of each disease state in each tissue. Each row represents a significant GO biological process which is colored according to the -log10(p.adjust). |
| Page: 1 2 3 4 5 6 7 8 9 |
| GO ID | Tissue | Disease Stage | Description | Gene Ratio | Bg Ratio | pvalue | p.adjust | Count |
| GO:003432918 | Esophagus | ESCC | cell junction assembly | 227/8552 | 420/18723 | 3.06e-04 | 1.83e-03 | 227 |
| GO:00519606 | Esophagus | ESCC | regulation of nervous system development | 237/8552 | 443/18723 | 5.02e-04 | 2.78e-03 | 237 |
| GO:00519625 | Esophagus | ESCC | positive regulation of nervous system development | 149/8552 | 272/18723 | 1.50e-03 | 7.06e-03 | 149 |
| GO:190188810 | Esophagus | ESCC | regulation of cell junction assembly | 109/8552 | 204/18723 | 1.53e-02 | 4.96e-02 | 109 |
| GO:00519624 | Oral cavity | OSCC | positive regulation of nervous system development | 135/7305 | 272/18723 | 2.20e-04 | 1.44e-03 | 135 |
| GO:00519605 | Oral cavity | OSCC | regulation of nervous system development | 205/7305 | 443/18723 | 9.80e-04 | 5.11e-03 | 205 |
| GO:003432916 | Oral cavity | OSCC | cell junction assembly | 190/7305 | 420/18723 | 4.99e-03 | 1.96e-02 | 190 |
| GO:0034329111 | Thyroid | PTC | cell junction assembly | 180/5968 | 420/18723 | 1.17e-06 | 1.69e-05 | 180 |
| GO:005196214 | Thyroid | PTC | positive regulation of nervous system development | 117/5968 | 272/18723 | 6.72e-05 | 5.89e-04 | 117 |
| GO:00519608 | Thyroid | PTC | regulation of nervous system development | 177/5968 | 443/18723 | 1.72e-04 | 1.32e-03 | 177 |
| GO:190188817 | Thyroid | PTC | regulation of cell junction assembly | 88/5968 | 204/18723 | 4.50e-04 | 2.97e-03 | 88 |
| GO:00508089 | Thyroid | PTC | synapse organization | 161/5968 | 426/18723 | 5.11e-03 | 2.36e-02 | 161 |
| GO:00508074 | Thyroid | PTC | regulation of synapse organization | 84/5968 | 211/18723 | 8.72e-03 | 3.64e-02 | 84 |
| GO:00508032 | Thyroid | PTC | regulation of synapse structure or activity | 86/5968 | 218/18723 | 1.05e-02 | 4.23e-02 | 86 |
| GO:003432924 | Thyroid | ATC | cell junction assembly | 187/6293 | 420/18723 | 1.71e-06 | 2.08e-05 | 187 |
| GO:005196014 | Thyroid | ATC | regulation of nervous system development | 195/6293 | 443/18723 | 2.62e-06 | 3.06e-05 | 195 |
| GO:005196221 | Thyroid | ATC | positive regulation of nervous system development | 126/6293 | 272/18723 | 8.17e-06 | 8.27e-05 | 126 |
| GO:190188818 | Thyroid | ATC | regulation of cell junction assembly | 94/6293 | 204/18723 | 1.38e-04 | 9.65e-04 | 94 |
| GO:005080712 | Thyroid | ATC | regulation of synapse organization | 87/6293 | 211/18723 | 1.20e-02 | 4.27e-02 | 87 |
| Page: 1 |
| Pathway ID | Tissue | Disease Stage | Description | Gene Ratio | Bg Ratio | pvalue | p.adjust | qvalue | Count |
| Page: 1 |
Top |
Cell-cell communication analysis |
| Identification of potential cell-cell interactions between two cell types and their ligand-receptor pairs for different disease states |
| Ligand | Receptor | LRpair | Pathway | Tissue | Disease Stage |
| Page: 1 |
Top |
Single-cell gene regulatory network inference analysis |
| Find out the significant the regulons (TFs) and the target genes of each regulon across cell types for different disease states |
| TF | Cell Type | Tissue | Disease Stage | Target Gene | RSS | Regulon Activity |
| ∗The dot plots of a searched regulon are shown for all cell subpopulations in each disease state of each tissue based on the regulon specific score inferred using pySCENIC and by calculating the average expression. |
| Page: 1 |
Top |
Somatic mutation of malignant transformation related genes |
| Annotation of somatic variants for genes involved in malignant transformation |
| Hugo Symbol | Variant Class | Variant Classification | dbSNP RS | HGVSc | HGVSp | HGVSp Short | SWISSPROT | BIOTYPE | SIFT | PolyPhen | Tumor Sample Barcode | Tissue | Histology | Sex | Age | Stage | Therapy Types | Drugs | Outcome |
| AMIGO2 | SNV | Missense_Mutation | rs765326741 | c.1159N>A | p.Val387Ile | p.V387I | Q86SJ2 | protein_coding | tolerated(0.51) | benign(0) | TCGA-A2-A0EX-01 | Breast | breast invasive carcinoma | Female | <65 | I/II | Hormone Therapy | tamoxiphen | SD |
| AMIGO2 | SNV | Missense_Mutation | rs140364757 | c.1429N>A | p.Ala477Thr | p.A477T | Q86SJ2 | protein_coding | tolerated(0.34) | benign(0) | TCGA-AN-A0FJ-01 | Breast | breast invasive carcinoma | Female | <65 | III/IV | Unknown | Unknown | SD |
| AMIGO2 | insertion | Frame_Shift_Ins | novel | c.84_85insGAAGTGCTTCTGCTTTACAACA | p.Ile29GlufsTer29 | p.I29Efs*29 | Q86SJ2 | protein_coding | TCGA-A7-A0CG-01 | Breast | breast invasive carcinoma | Female | >=65 | I/II | Unknown | Unknown | SD | ||
| AMIGO2 | deletion | Frame_Shift_Del | novel | c.1461delN | p.Ser488AlafsTer4 | p.S488Afs*4 | Q86SJ2 | protein_coding | TCGA-EW-A2FV-01 | Breast | breast invasive carcinoma | Female | <65 | III/IV | Chemotherapy | docetaxel | SD | ||
| AMIGO2 | SNV | Missense_Mutation | c.316A>G | p.Thr106Ala | p.T106A | Q86SJ2 | protein_coding | tolerated(0.55) | benign(0.007) | TCGA-A6-3809-01 | Colorectum | colon adenocarcinoma | Female | >=65 | I/II | Unknown | Unknown | SD | |
| AMIGO2 | SNV | Missense_Mutation | novel | c.142G>A | p.Ala48Thr | p.A48T | Q86SJ2 | protein_coding | deleterious(0) | probably_damaging(0.996) | TCGA-AA-3947-01 | Colorectum | colon adenocarcinoma | Female | <65 | I/II | Unknown | Unknown | SD |
| AMIGO2 | SNV | Missense_Mutation | c.608N>A | p.Arg203Gln | p.R203Q | Q86SJ2 | protein_coding | tolerated(0.11) | benign(0.011) | TCGA-AA-A00N-01 | Colorectum | colon adenocarcinoma | Male | >=65 | I/II | Unknown | Unknown | PD | |
| AMIGO2 | SNV | Missense_Mutation | rs865785572 | c.301N>T | p.Arg101Cys | p.R101C | Q86SJ2 | protein_coding | deleterious(0.04) | benign(0.039) | TCGA-AA-A00N-01 | Colorectum | colon adenocarcinoma | Male | >=65 | I/II | Unknown | Unknown | PD |
| AMIGO2 | SNV | Missense_Mutation | c.1293N>T | p.Gln431His | p.Q431H | Q86SJ2 | protein_coding | deleterious(0.04) | benign(0.188) | TCGA-AD-5900-01 | Colorectum | colon adenocarcinoma | Male | >=65 | I/II | Unknown | Unknown | SD | |
| AMIGO2 | SNV | Missense_Mutation | novel | c.589N>G | p.Leu197Val | p.L197V | Q86SJ2 | protein_coding | deleterious(0) | probably_damaging(0.993) | TCGA-CA-6717-01 | Colorectum | colon adenocarcinoma | Male | <65 | I/II | Chemotherapy | oxaliplatin | CR |
| Page: 1 2 3 4 5 6 |
Top |
Related drugs of malignant transformation related genes |
| Identification of chemicals and drugs interact with genes involved in malignant transfromation |
| (DGIdb 4.0) |
| Entrez ID | Symbol | Category | Interaction Types | Drug Claim Name | Drug Name | PMIDs |
| Page: 1 |

Copyright 2023-Present -The University of Texas Health Science Center at Houston |