
|
|||||
|
 | |
| |
| |
| |
| |
| |
|
Gene: AMFR |
Gene summary for AMFR |
| Gene information | Species | Human | Gene symbol | AMFR | Gene ID | 267 |
| Gene name | autocrine motility factor receptor | |
| Gene Alias | GP78 | |
| Cytomap | 16q13 | |
| Gene Type | protein-coding | GO ID | GO:0000209 | UniProtAcc | Q9UKV5 |
Top |
Malignant transformation analysis |
| Identification of the aberrant gene expression in precancerous and cancerous lesions by comparing the gene expression of stem-like cells in diseased tissues with normal stem cells |
| Entrez ID | Symbol | Replicates | Species | Organ | Tissue | Adj P-value | Log2FC | Malignancy |
| 267 | AMFR | LZE24T | Human | Esophagus | ESCC | 9.08e-08 | 5.26e-02 | 0.0596 |
| 267 | AMFR | P1T-E | Human | Esophagus | ESCC | 3.93e-06 | 3.18e-01 | 0.0875 |
| 267 | AMFR | P2T-E | Human | Esophagus | ESCC | 8.90e-12 | 1.48e-01 | 0.1177 |
| 267 | AMFR | P4T-E | Human | Esophagus | ESCC | 1.48e-12 | 1.82e-01 | 0.1323 |
| 267 | AMFR | P5T-E | Human | Esophagus | ESCC | 4.04e-13 | 2.31e-02 | 0.1327 |
| 267 | AMFR | P8T-E | Human | Esophagus | ESCC | 6.02e-12 | 1.78e-01 | 0.0889 |
| 267 | AMFR | P9T-E | Human | Esophagus | ESCC | 2.92e-04 | 1.10e-02 | 0.1131 |
| 267 | AMFR | P10T-E | Human | Esophagus | ESCC | 1.03e-07 | 2.79e-02 | 0.116 |
| 267 | AMFR | P12T-E | Human | Esophagus | ESCC | 1.96e-09 | 1.05e-01 | 0.1122 |
| 267 | AMFR | P15T-E | Human | Esophagus | ESCC | 3.07e-14 | 1.77e-01 | 0.1149 |
| 267 | AMFR | P16T-E | Human | Esophagus | ESCC | 6.81e-05 | 2.24e-02 | 0.1153 |
| 267 | AMFR | P17T-E | Human | Esophagus | ESCC | 2.03e-04 | 2.17e-01 | 0.1278 |
| 267 | AMFR | P19T-E | Human | Esophagus | ESCC | 4.90e-03 | 2.48e-01 | 0.1662 |
| 267 | AMFR | P20T-E | Human | Esophagus | ESCC | 9.29e-15 | 1.94e-01 | 0.1124 |
| 267 | AMFR | P21T-E | Human | Esophagus | ESCC | 8.59e-13 | 1.66e-01 | 0.1617 |
| 267 | AMFR | P22T-E | Human | Esophagus | ESCC | 3.00e-18 | 1.48e-01 | 0.1236 |
| 267 | AMFR | P23T-E | Human | Esophagus | ESCC | 1.24e-14 | 2.33e-01 | 0.108 |
| 267 | AMFR | P24T-E | Human | Esophagus | ESCC | 2.90e-11 | 1.26e-01 | 0.1287 |
| 267 | AMFR | P26T-E | Human | Esophagus | ESCC | 1.05e-10 | 1.87e-01 | 0.1276 |
| 267 | AMFR | P27T-E | Human | Esophagus | ESCC | 1.84e-11 | 3.81e-02 | 0.1055 |
| Page: 1 2 3 4 5 |
| Tissue | Expression Dynamics | Abbreviation |
| Esophagus | 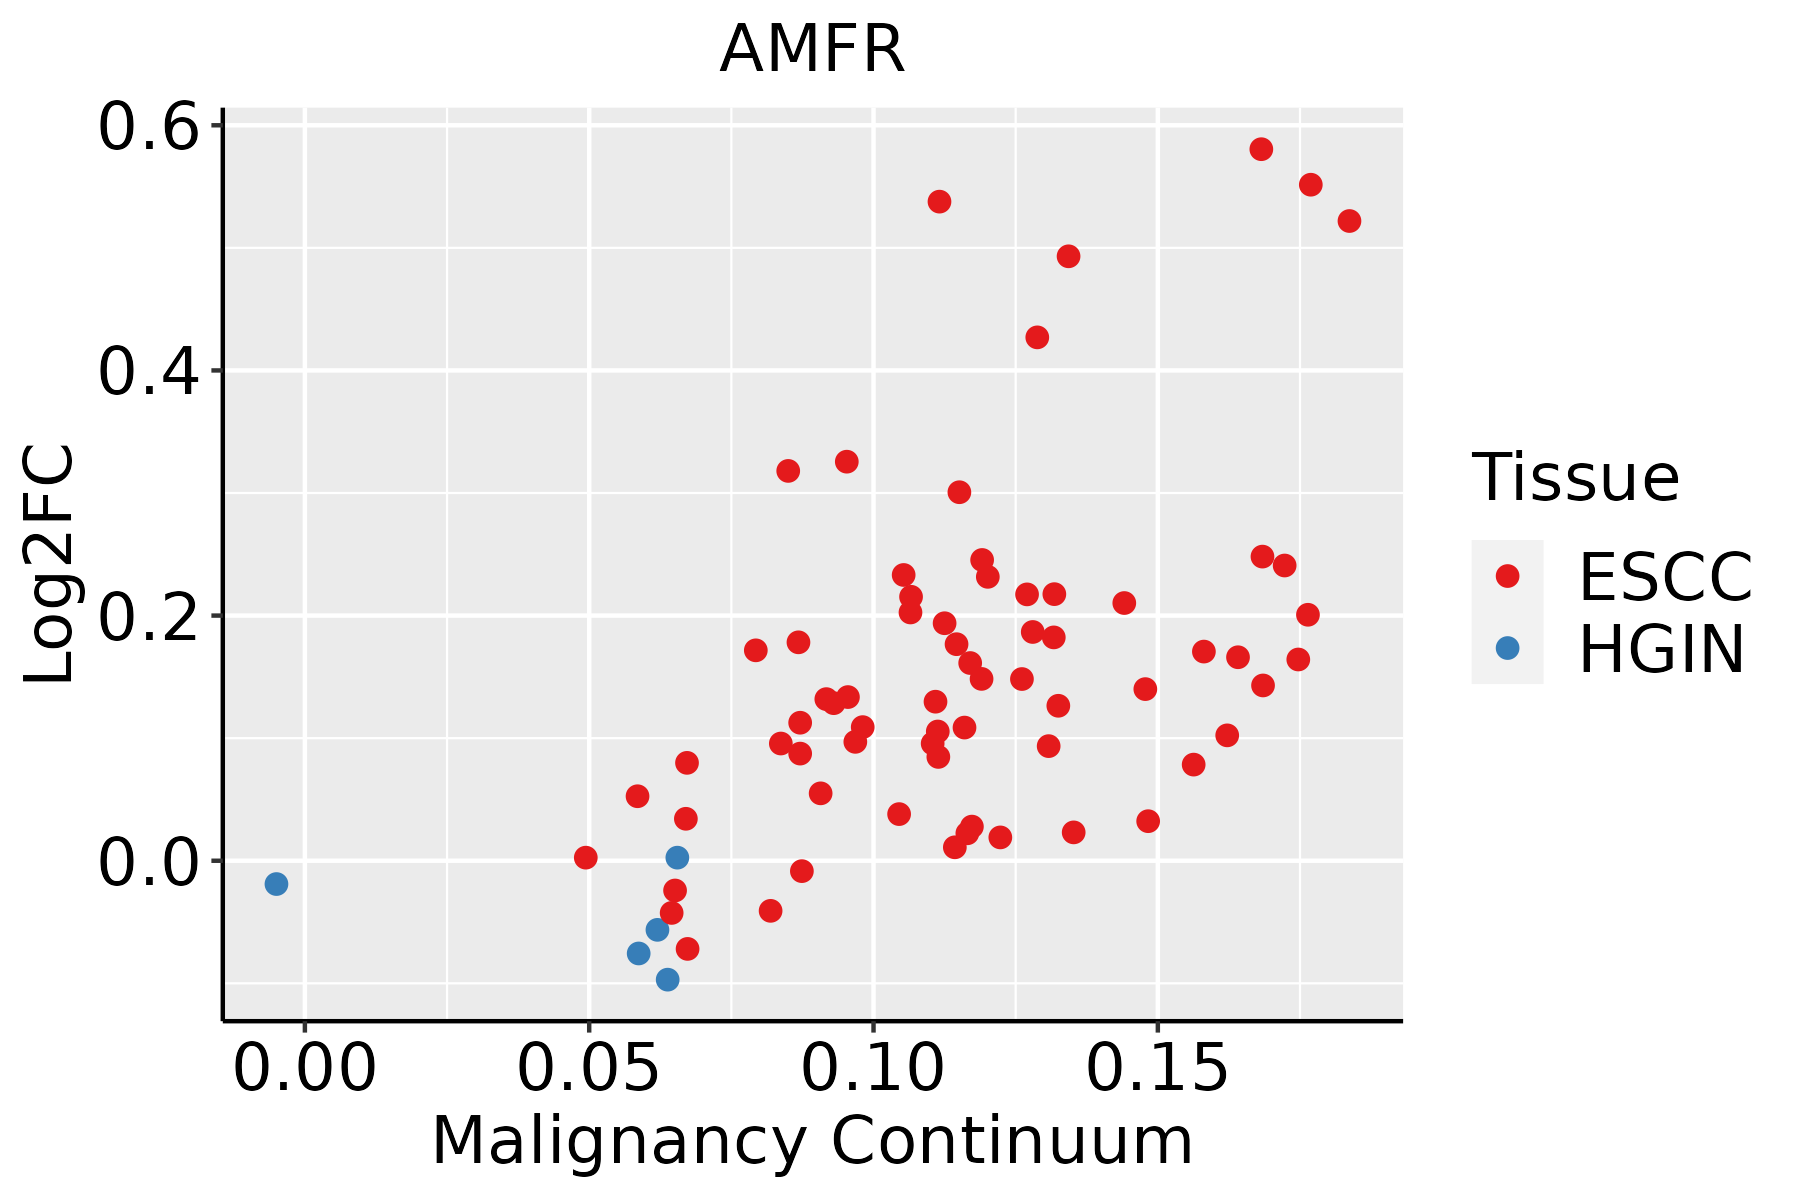 | ESCC: Esophageal squamous cell carcinoma |
| HGIN: High-grade intraepithelial neoplasias | ||
| LGIN: Low-grade intraepithelial neoplasias | ||
| Liver |  | HCC: Hepatocellular carcinoma |
| NAFLD: Non-alcoholic fatty liver disease | ||
| Oral Cavity |  | EOLP: Erosive Oral lichen planus |
| LP: leukoplakia | ||
| NEOLP: Non-erosive oral lichen planus | ||
| OSCC: Oral squamous cell carcinoma | ||
| Thyroid |  | ATC: Anaplastic thyroid cancer |
| HT: Hashimoto's thyroiditis | ||
| PTC: Papillary thyroid cancer |
| ∗log2FC in expression of this searched gene in stem-like cells from each diseased tissue sample relative to stem-like cells in normal samples in each tissue plotted against the malignancy continuum. Samples are colored based on if they are from different disease stage. |
Top |
Malignant transformation related pathway analysis |
| Find out the enriched GO biological processes and KEGG pathways involved in transition from healthy to precancer to cancer |
| Tissue | Disease Stage | Enriched GO biological Processes |
| Colorectum | AD |  |
| Colorectum | SER |  |
| Colorectum | MSS |  |
| Colorectum | MSI-H |  |
| Colorectum | FAP |  |
| ∗Top 15 enriched GO BP terms are showed in the bar plot of each disease state in each tissue. Each row represents a significant GO biological process which is colored according to the -log10(p.adjust). |
| Page: 1 2 3 4 5 6 7 8 9 |
| GO ID | Tissue | Disease Stage | Description | Gene Ratio | Bg Ratio | pvalue | p.adjust | Count |
| GO:0010498111 | Esophagus | ESCC | proteasomal protein catabolic process | 369/8552 | 490/18723 | 1.13e-41 | 1.80e-38 | 369 |
| GO:0043161111 | Esophagus | ESCC | proteasome-mediated ubiquitin-dependent protein catabolic process | 312/8552 | 412/18723 | 3.53e-36 | 4.48e-33 | 312 |
| GO:0034976111 | Esophagus | ESCC | response to endoplasmic reticulum stress | 192/8552 | 256/18723 | 7.15e-22 | 1.30e-19 | 192 |
| GO:0051098111 | Esophagus | ESCC | regulation of binding | 251/8552 | 363/18723 | 6.73e-20 | 8.46e-18 | 251 |
| GO:0035966111 | Esophagus | ESCC | response to topologically incorrect protein | 125/8552 | 159/18723 | 1.44e-17 | 1.27e-15 | 125 |
| GO:000020917 | Esophagus | ESCC | protein polyubiquitination | 170/8552 | 236/18723 | 1.40e-16 | 1.09e-14 | 170 |
| GO:0006986111 | Esophagus | ESCC | response to unfolded protein | 107/8552 | 137/18723 | 7.01e-15 | 3.87e-13 | 107 |
| GO:0035967111 | Esophagus | ESCC | cellular response to topologically incorrect protein | 90/8552 | 116/18723 | 1.94e-12 | 8.11e-11 | 90 |
| GO:0051099111 | Esophagus | ESCC | positive regulation of binding | 122/8552 | 173/18723 | 2.79e-11 | 9.45e-10 | 122 |
| GO:004339320 | Esophagus | ESCC | regulation of protein binding | 135/8552 | 196/18723 | 3.69e-11 | 1.22e-09 | 135 |
| GO:003650315 | Esophagus | ESCC | ERAD pathway | 82/8552 | 107/18723 | 5.80e-11 | 1.84e-09 | 82 |
| GO:007093617 | Esophagus | ESCC | protein K48-linked ubiquitination | 55/8552 | 65/18723 | 8.42e-11 | 2.58e-09 | 55 |
| GO:001605517 | Esophagus | ESCC | Wnt signaling pathway | 268/8552 | 444/18723 | 2.32e-10 | 6.58e-09 | 268 |
| GO:019873817 | Esophagus | ESCC | cell-cell signaling by wnt | 269/8552 | 446/18723 | 2.41e-10 | 6.79e-09 | 269 |
| GO:0034620111 | Esophagus | ESCC | cellular response to unfolded protein | 74/8552 | 96/18723 | 3.10e-10 | 8.66e-09 | 74 |
| GO:003043314 | Esophagus | ESCC | ubiquitin-dependent ERAD pathway | 66/8552 | 85/18723 | 1.64e-09 | 3.78e-08 | 66 |
| GO:003096818 | Esophagus | ESCC | endoplasmic reticulum unfolded protein response | 59/8552 | 74/18723 | 1.90e-09 | 4.36e-08 | 59 |
| GO:00091002 | Esophagus | ESCC | glycoprotein metabolic process | 226/8552 | 387/18723 | 2.64e-07 | 3.94e-06 | 226 |
| GO:000756820 | Esophagus | ESCC | aging | 201/8552 | 339/18723 | 2.64e-07 | 3.94e-06 | 201 |
| GO:000698416 | Esophagus | ESCC | ER-nucleus signaling pathway | 38/8552 | 46/18723 | 2.70e-07 | 4.00e-06 | 38 |
| Page: 1 2 3 4 5 6 7 8 9 |
| Pathway ID | Tissue | Disease Stage | Description | Gene Ratio | Bg Ratio | pvalue | p.adjust | qvalue | Count |
| hsa04141211 | Esophagus | ESCC | Protein processing in endoplasmic reticulum | 147/4205 | 174/8465 | 3.29e-22 | 1.10e-19 | 5.64e-20 | 147 |
| hsa04141310 | Esophagus | ESCC | Protein processing in endoplasmic reticulum | 147/4205 | 174/8465 | 3.29e-22 | 1.10e-19 | 5.64e-20 | 147 |
| hsa0414114 | Liver | Cirrhotic | Protein processing in endoplasmic reticulum | 114/2530 | 174/8465 | 1.16e-22 | 9.67e-21 | 5.96e-21 | 114 |
| hsa0414115 | Liver | Cirrhotic | Protein processing in endoplasmic reticulum | 114/2530 | 174/8465 | 1.16e-22 | 9.67e-21 | 5.96e-21 | 114 |
| hsa0414122 | Liver | HCC | Protein processing in endoplasmic reticulum | 146/4020 | 174/8465 | 7.34e-24 | 2.46e-21 | 1.37e-21 | 146 |
| hsa0414132 | Liver | HCC | Protein processing in endoplasmic reticulum | 146/4020 | 174/8465 | 7.34e-24 | 2.46e-21 | 1.37e-21 | 146 |
| Page: 1 |
Top |
Cell-cell communication analysis |
| Identification of potential cell-cell interactions between two cell types and their ligand-receptor pairs for different disease states |
| Ligand | Receptor | LRpair | Pathway | Tissue | Disease Stage |
| Page: 1 |
Top |
Single-cell gene regulatory network inference analysis |
| Find out the significant the regulons (TFs) and the target genes of each regulon across cell types for different disease states |
| TF | Cell Type | Tissue | Disease Stage | Target Gene | RSS | Regulon Activity |
| ∗The dot plots of a searched regulon are shown for all cell subpopulations in each disease state of each tissue based on the regulon specific score inferred using pySCENIC and by calculating the average expression. |
| Page: 1 |
Top |
Somatic mutation of malignant transformation related genes |
| Annotation of somatic variants for genes involved in malignant transformation |
| Hugo Symbol | Variant Class | Variant Classification | dbSNP RS | HGVSc | HGVSp | HGVSp Short | SWISSPROT | BIOTYPE | SIFT | PolyPhen | Tumor Sample Barcode | Tissue | Histology | Sex | Age | Stage | Therapy Types | Drugs | Outcome |
| AMFR | deletion | Frame_Shift_Del | novel | c.1813delG | p.Asp605MetfsTer18 | p.D605Mfs*18 | Q9UKV5 | protein_coding | TCGA-D8-A27V-01 | Breast | breast invasive carcinoma | Female | <65 | I/II | Hormone Therapy | tamoxiphen | SD | ||
| AMFR | SNV | Missense_Mutation | novel | c.1097G>A | p.Arg366His | p.R366H | Q9UKV5 | protein_coding | deleterious(0) | probably_damaging(0.922) | TCGA-2W-A8YY-01 | Cervix | cervical & endocervical cancer | Female | <65 | I/II | Chemotherapy | cisplatin | CR |
| AMFR | SNV | Missense_Mutation | rs145747194 | c.1903N>T | p.Arg635Trp | p.R635W | Q9UKV5 | protein_coding | deleterious_low_confidence(0.04) | probably_damaging(0.993) | TCGA-C5-A2LZ-01 | Cervix | cervical & endocervical cancer | Female | >=65 | III/IV | Unknown | Unknown | PD |
| AMFR | SNV | Missense_Mutation | c.1739N>A | p.Arg580His | p.R580H | Q9UKV5 | protein_coding | tolerated(0.13) | benign(0.02) | TCGA-A6-5661-01 | Colorectum | colon adenocarcinoma | Female | >=65 | I/II | Unknown | Unknown | SD | |
| AMFR | SNV | Missense_Mutation | rs764962608 | c.1700N>A | p.Arg567His | p.R567H | Q9UKV5 | protein_coding | tolerated(0.33) | possibly_damaging(0.655) | TCGA-AA-3811-01 | Colorectum | colon adenocarcinoma | Female | >=65 | III/IV | Unknown | Unknown | PD |
| AMFR | SNV | Missense_Mutation | rs770366707 | c.1228N>A | p.Glu410Lys | p.E410K | Q9UKV5 | protein_coding | tolerated(0.41) | benign(0.074) | TCGA-AA-A00N-01 | Colorectum | colon adenocarcinoma | Male | >=65 | I/II | Unknown | Unknown | PD |
| AMFR | SNV | Missense_Mutation | c.326N>G | p.Pro109Arg | p.P109R | Q9UKV5 | protein_coding | deleterious(0.05) | benign(0.017) | TCGA-AD-6888-01 | Colorectum | colon adenocarcinoma | Male | >=65 | III/IV | Unknown | Unknown | PD | |
| AMFR | SNV | Missense_Mutation | c.358N>T | p.Asp120Tyr | p.D120Y | Q9UKV5 | protein_coding | deleterious(0) | probably_damaging(0.995) | TCGA-AG-A002-01 | Colorectum | rectum adenocarcinoma | Male | <65 | I/II | Unknown | Unknown | SD | |
| AMFR | SNV | Missense_Mutation | novel | c.1024N>A | p.Ala342Thr | p.A342T | Q9UKV5 | protein_coding | deleterious(0) | probably_damaging(0.977) | TCGA-A5-A0G1-01 | Endometrium | uterine corpus endometrioid carcinoma | Female | >=65 | I/II | Unknown | Unknown | SD |
| AMFR | SNV | Missense_Mutation | rs756216374 | c.1055N>A | p.Arg352Gln | p.R352Q | Q9UKV5 | protein_coding | deleterious(0) | probably_damaging(0.994) | TCGA-A5-A0G2-01 | Endometrium | uterine corpus endometrioid carcinoma | Female | <65 | III/IV | Unknown | Unknown | SD |
| Page: 1 2 3 4 5 |
Top |
Related drugs of malignant transformation related genes |
| Identification of chemicals and drugs interact with genes involved in malignant transfromation |
| (DGIdb 4.0) |
| Entrez ID | Symbol | Category | Interaction Types | Drug Claim Name | Drug Name | PMIDs |
| Page: 1 |

Copyright 2023-Present -The University of Texas Health Science Center at Houston |