
|
|||||
|
 | |
| |
| |
| |
| |
| |
|
Gene: AMDHD2 |
Gene summary for AMDHD2 |
| Gene information | Species | Human | Gene symbol | AMDHD2 | Gene ID | 51005 |
| Gene name | amidohydrolase domain containing 2 | |
| Gene Alias | CGI-14 | |
| Cytomap | 16p13.3 | |
| Gene Type | protein-coding | GO ID | GO:0005975 | UniProtAcc | Q9Y303 |
Top |
Malignant transformation analysis |
| Identification of the aberrant gene expression in precancerous and cancerous lesions by comparing the gene expression of stem-like cells in diseased tissues with normal stem cells |
| Entrez ID | Symbol | Replicates | Species | Organ | Tissue | Adj P-value | Log2FC | Malignancy |
| 51005 | AMDHD2 | C04 | Human | Oral cavity | OSCC | 5.16e-07 | 4.17e-01 | 0.2633 |
| 51005 | AMDHD2 | C21 | Human | Oral cavity | OSCC | 2.78e-33 | 8.36e-01 | 0.2678 |
| 51005 | AMDHD2 | C30 | Human | Oral cavity | OSCC | 3.05e-26 | 9.36e-01 | 0.3055 |
| 51005 | AMDHD2 | C38 | Human | Oral cavity | OSCC | 2.16e-03 | 5.00e-01 | 0.172 |
| 51005 | AMDHD2 | C46 | Human | Oral cavity | OSCC | 2.17e-06 | 2.37e-01 | 0.1673 |
| 51005 | AMDHD2 | C51 | Human | Oral cavity | OSCC | 2.18e-09 | 5.24e-01 | 0.2674 |
| 51005 | AMDHD2 | C06 | Human | Oral cavity | OSCC | 2.04e-02 | 5.07e-01 | 0.2699 |
| 51005 | AMDHD2 | C08 | Human | Oral cavity | OSCC | 1.73e-10 | 2.98e-01 | 0.1919 |
| 51005 | AMDHD2 | LN46 | Human | Oral cavity | OSCC | 1.45e-05 | 3.68e-01 | 0.1666 |
| 51005 | AMDHD2 | SYSMH2 | Human | Oral cavity | OSCC | 9.85e-06 | 2.89e-01 | 0.2326 |
| 51005 | AMDHD2 | SYSMH3 | Human | Oral cavity | OSCC | 8.32e-10 | 3.70e-01 | 0.2442 |
| 51005 | AMDHD2 | PTC01 | Human | Thyroid | PTC | 1.87e-04 | 9.18e-02 | 0.1899 |
| 51005 | AMDHD2 | PTC04 | Human | Thyroid | PTC | 7.38e-03 | 9.67e-02 | 0.1927 |
| 51005 | AMDHD2 | PTC05 | Human | Thyroid | PTC | 7.64e-08 | 2.41e-01 | 0.2065 |
| 51005 | AMDHD2 | PTC06 | Human | Thyroid | PTC | 3.55e-06 | 1.80e-01 | 0.2057 |
| 51005 | AMDHD2 | PTC07 | Human | Thyroid | PTC | 4.29e-10 | 2.05e-01 | 0.2044 |
| 51005 | AMDHD2 | ATC09 | Human | Thyroid | ATC | 1.31e-07 | 3.33e-01 | 0.2871 |
| 51005 | AMDHD2 | ATC12 | Human | Thyroid | ATC | 7.69e-25 | 5.23e-01 | 0.34 |
| 51005 | AMDHD2 | ATC1 | Human | Thyroid | ATC | 1.51e-06 | 3.46e-01 | 0.2878 |
| 51005 | AMDHD2 | ATC4 | Human | Thyroid | ATC | 1.37e-31 | 6.28e-01 | 0.34 |
| Page: 1 |
| Tissue | Expression Dynamics | Abbreviation |
| Oral Cavity |  | EOLP: Erosive Oral lichen planus |
| LP: leukoplakia | ||
| NEOLP: Non-erosive oral lichen planus | ||
| OSCC: Oral squamous cell carcinoma | ||
| Thyroid | 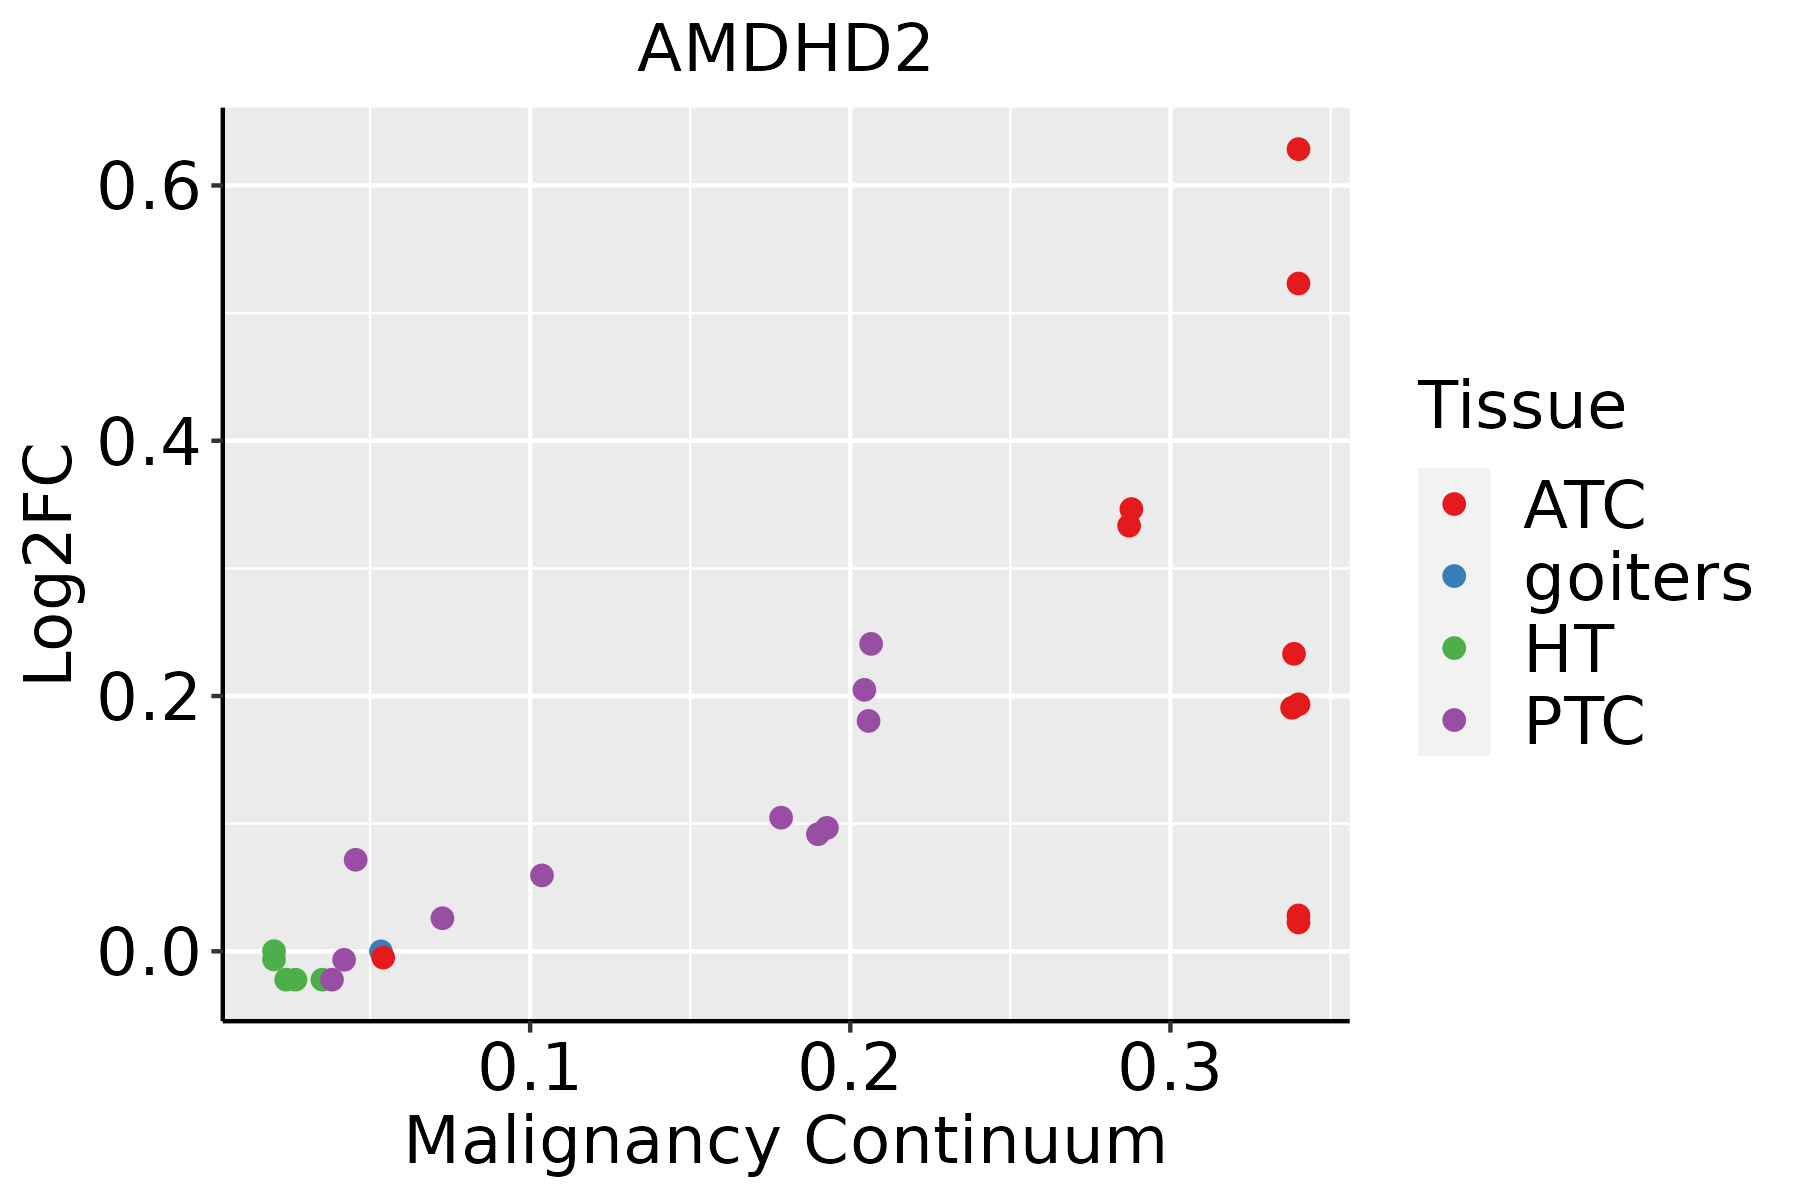 | ATC: Anaplastic thyroid cancer |
| HT: Hashimoto's thyroiditis | ||
| PTC: Papillary thyroid cancer |
| ∗log2FC in expression of this searched gene in stem-like cells from each diseased tissue sample relative to stem-like cells in normal samples in each tissue plotted against the malignancy continuum. Samples are colored based on if they are from different disease stage. |
Top |
Malignant transformation related pathway analysis |
| Find out the enriched GO biological processes and KEGG pathways involved in transition from healthy to precancer to cancer |
| Tissue | Disease Stage | Enriched GO biological Processes |
| Colorectum | AD |  |
| Colorectum | SER |  |
| Colorectum | MSS |  |
| Colorectum | MSI-H |  |
| Colorectum | FAP |  |
| ∗Top 15 enriched GO BP terms are showed in the bar plot of each disease state in each tissue. Each row represents a significant GO biological process which is colored according to the -log10(p.adjust). |
| Page: 1 2 3 4 5 6 7 8 9 |
| GO ID | Tissue | Disease Stage | Description | Gene Ratio | Bg Ratio | pvalue | p.adjust | Count |
| GO:00092255 | Oral cavity | OSCC | nucleotide-sugar metabolic process | 26/7305 | 36/18723 | 5.44e-05 | 4.51e-04 | 26 |
| GO:19011361 | Oral cavity | OSCC | carbohydrate derivative catabolic process | 89/7305 | 172/18723 | 4.52e-04 | 2.73e-03 | 89 |
| GO:00442826 | Oral cavity | OSCC | small molecule catabolic process | 174/7305 | 376/18723 | 2.25e-03 | 1.00e-02 | 174 |
| GO:00092261 | Oral cavity | OSCC | nucleotide-sugar biosynthetic process | 14/7305 | 19/18723 | 2.31e-03 | 1.02e-02 | 14 |
| GO:0006040 | Oral cavity | OSCC | amino sugar metabolic process | 24/7305 | 42/18723 | 1.30e-02 | 4.34e-02 | 24 |
| GO:0006047 | Oral cavity | OSCC | UDP-N-acetylglucosamine metabolic process | 10/7305 | 14/18723 | 1.44e-02 | 4.69e-02 | 10 |
| GO:0046348 | Oral cavity | OSCC | amino sugar catabolic process | 10/7305 | 14/18723 | 1.44e-02 | 4.69e-02 | 10 |
| GO:00092257 | Thyroid | PTC | nucleotide-sugar metabolic process | 23/5968 | 36/18723 | 7.78e-05 | 6.66e-04 | 23 |
| GO:00060472 | Thyroid | PTC | UDP-N-acetylglucosamine metabolic process | 9/5968 | 14/18723 | 1.27e-02 | 4.92e-02 | 9 |
| GO:000922511 | Thyroid | ATC | nucleotide-sugar metabolic process | 24/6293 | 36/18723 | 5.10e-05 | 3.99e-04 | 24 |
| GO:00060471 | Thyroid | ATC | UDP-N-acetylglucosamine metabolic process | 10/6293 | 14/18723 | 4.31e-03 | 1.80e-02 | 10 |
| GO:00092263 | Thyroid | ATC | nucleotide-sugar biosynthetic process | 12/6293 | 19/18723 | 7.97e-03 | 3.08e-02 | 12 |
| GO:19011363 | Thyroid | ATC | carbohydrate derivative catabolic process | 73/6293 | 172/18723 | 9.43e-03 | 3.47e-02 | 73 |
| Page: 1 |
| Pathway ID | Tissue | Disease Stage | Description | Gene Ratio | Bg Ratio | pvalue | p.adjust | qvalue | Count |
| Page: 1 |
Top |
Cell-cell communication analysis |
| Identification of potential cell-cell interactions between two cell types and their ligand-receptor pairs for different disease states |
| Ligand | Receptor | LRpair | Pathway | Tissue | Disease Stage |
| Page: 1 |
Top |
Single-cell gene regulatory network inference analysis |
| Find out the significant the regulons (TFs) and the target genes of each regulon across cell types for different disease states |
| TF | Cell Type | Tissue | Disease Stage | Target Gene | RSS | Regulon Activity |
| ∗The dot plots of a searched regulon are shown for all cell subpopulations in each disease state of each tissue based on the regulon specific score inferred using pySCENIC and by calculating the average expression. |
| Page: 1 |
Top |
Somatic mutation of malignant transformation related genes |
| Annotation of somatic variants for genes involved in malignant transformation |
| Hugo Symbol | Variant Class | Variant Classification | dbSNP RS | HGVSc | HGVSp | HGVSp Short | SWISSPROT | BIOTYPE | SIFT | PolyPhen | Tumor Sample Barcode | Tissue | Histology | Sex | Age | Stage | Therapy Types | Drugs | Outcome |
| AMDHD2 | SNV | Missense_Mutation | c.1576N>A | p.Trp526Arg | p.W526R | Q9Y303 | protein_coding | deleterious_low_confidence(0) | benign(0.082) | TCGA-A2-A1FW-01 | Breast | breast invasive carcinoma | Female | <65 | III/IV | Chemotherapy | cytoxan | SD | |
| AMDHD2 | SNV | Missense_Mutation | rs781408663 | c.715N>T | p.Pro239Ser | p.P239S | Q9Y303 | protein_coding | tolerated(0.09) | possibly_damaging(0.664) | TCGA-A8-A09Z-01 | Breast | breast invasive carcinoma | Female | >=65 | I/II | Unknown | Unknown | SD |
| AMDHD2 | SNV | Missense_Mutation | rs766892434 | c.1382N>A | p.Ser461Tyr | p.S461Y | Q9Y303 | protein_coding | deleterious_low_confidence(0) | benign(0.1) | TCGA-AC-A23H-01 | Breast | breast invasive carcinoma | Female | >=65 | I/II | Unknown | Unknown | PD |
| AMDHD2 | insertion | In_Frame_Ins | novel | c.1716_1717insTTT | p.Met572_Val573insPhe | p.M572_V573insF | Q9Y303 | protein_coding | TCGA-A8-A09K-01 | Breast | breast invasive carcinoma | Female | >=65 | I/II | Unknown | Unknown | SD | ||
| AMDHD2 | insertion | In_Frame_Ins | novel | c.1717_1718insCTT | p.Val573delinsAlaPhe | p.V573delinsAF | Q9Y303 | protein_coding | TCGA-A8-A09K-01 | Breast | breast invasive carcinoma | Female | >=65 | I/II | Unknown | Unknown | SD | ||
| AMDHD2 | SNV | Missense_Mutation | c.952N>G | p.Leu318Val | p.L318V | Q9Y303 | protein_coding | tolerated(0.36) | possibly_damaging(0.775) | TCGA-IR-A3LK-01 | Cervix | cervical & endocervical cancer | Female | >=65 | I/II | Chemotherapy | cisplatin | PD | |
| AMDHD2 | SNV | Missense_Mutation | c.779N>A | p.Arg260His | p.R260H | Q9Y303 | protein_coding | deleterious(0.05) | benign(0.052) | TCGA-A6-6649-01 | Colorectum | colon adenocarcinoma | Male | >=65 | III/IV | Chemotherapy | fluorouracil | SD | |
| AMDHD2 | SNV | Missense_Mutation | novel | c.920C>T | p.Thr307Met | p.T307M | Q9Y303 | protein_coding | tolerated(0.05) | probably_damaging(0.949) | TCGA-AA-3947-01 | Colorectum | colon adenocarcinoma | Female | <65 | I/II | Unknown | Unknown | SD |
| AMDHD2 | SNV | Missense_Mutation | novel | c.998N>A | p.Arg333Lys | p.R333K | Q9Y303 | protein_coding | tolerated(0.23) | benign(0.035) | TCGA-CM-5341-01 | Colorectum | colon adenocarcinoma | Female | >=65 | III/IV | Chemotherapy | fluorouracil | SD |
| AMDHD2 | SNV | Missense_Mutation | rs753259185 | c.1027N>A | p.Asp343Asn | p.D343N | Q9Y303 | protein_coding | tolerated(0.18) | benign(0) | TCGA-F4-6570-01 | Colorectum | colon adenocarcinoma | Female | >=65 | I/II | Unknown | Unknown | SD |
| Page: 1 2 3 4 5 6 |
Top |
Related drugs of malignant transformation related genes |
| Identification of chemicals and drugs interact with genes involved in malignant transfromation |
| (DGIdb 4.0) |
| Entrez ID | Symbol | Category | Interaction Types | Drug Claim Name | Drug Name | PMIDs |
| Page: 1 |

Copyright 2023-Present -The University of Texas Health Science Center at Houston |