| Tissue | Expression Dynamics | Abbreviation |
| Endometrium | 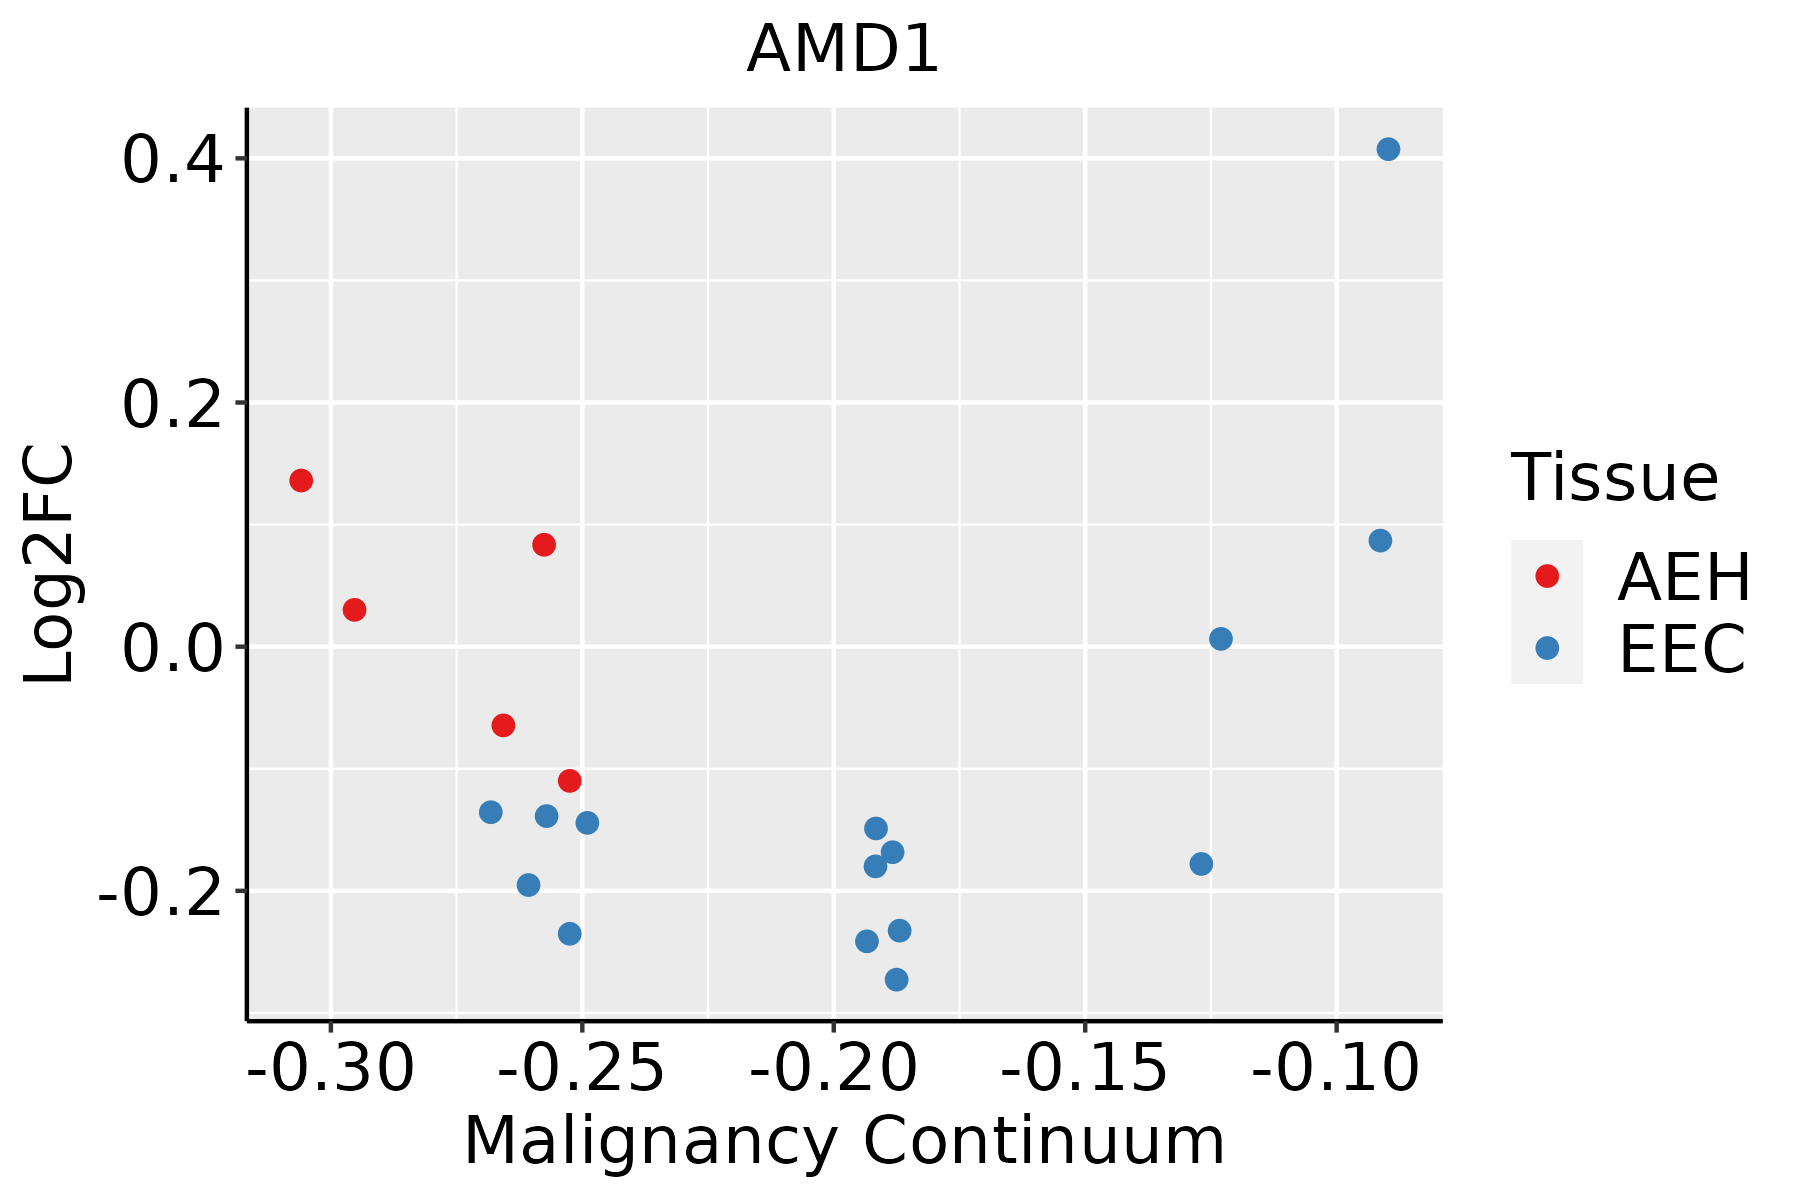 | AEH: Atypical endometrial hyperplasia |
| EEC: Endometrioid Cancer |
| Esophagus | 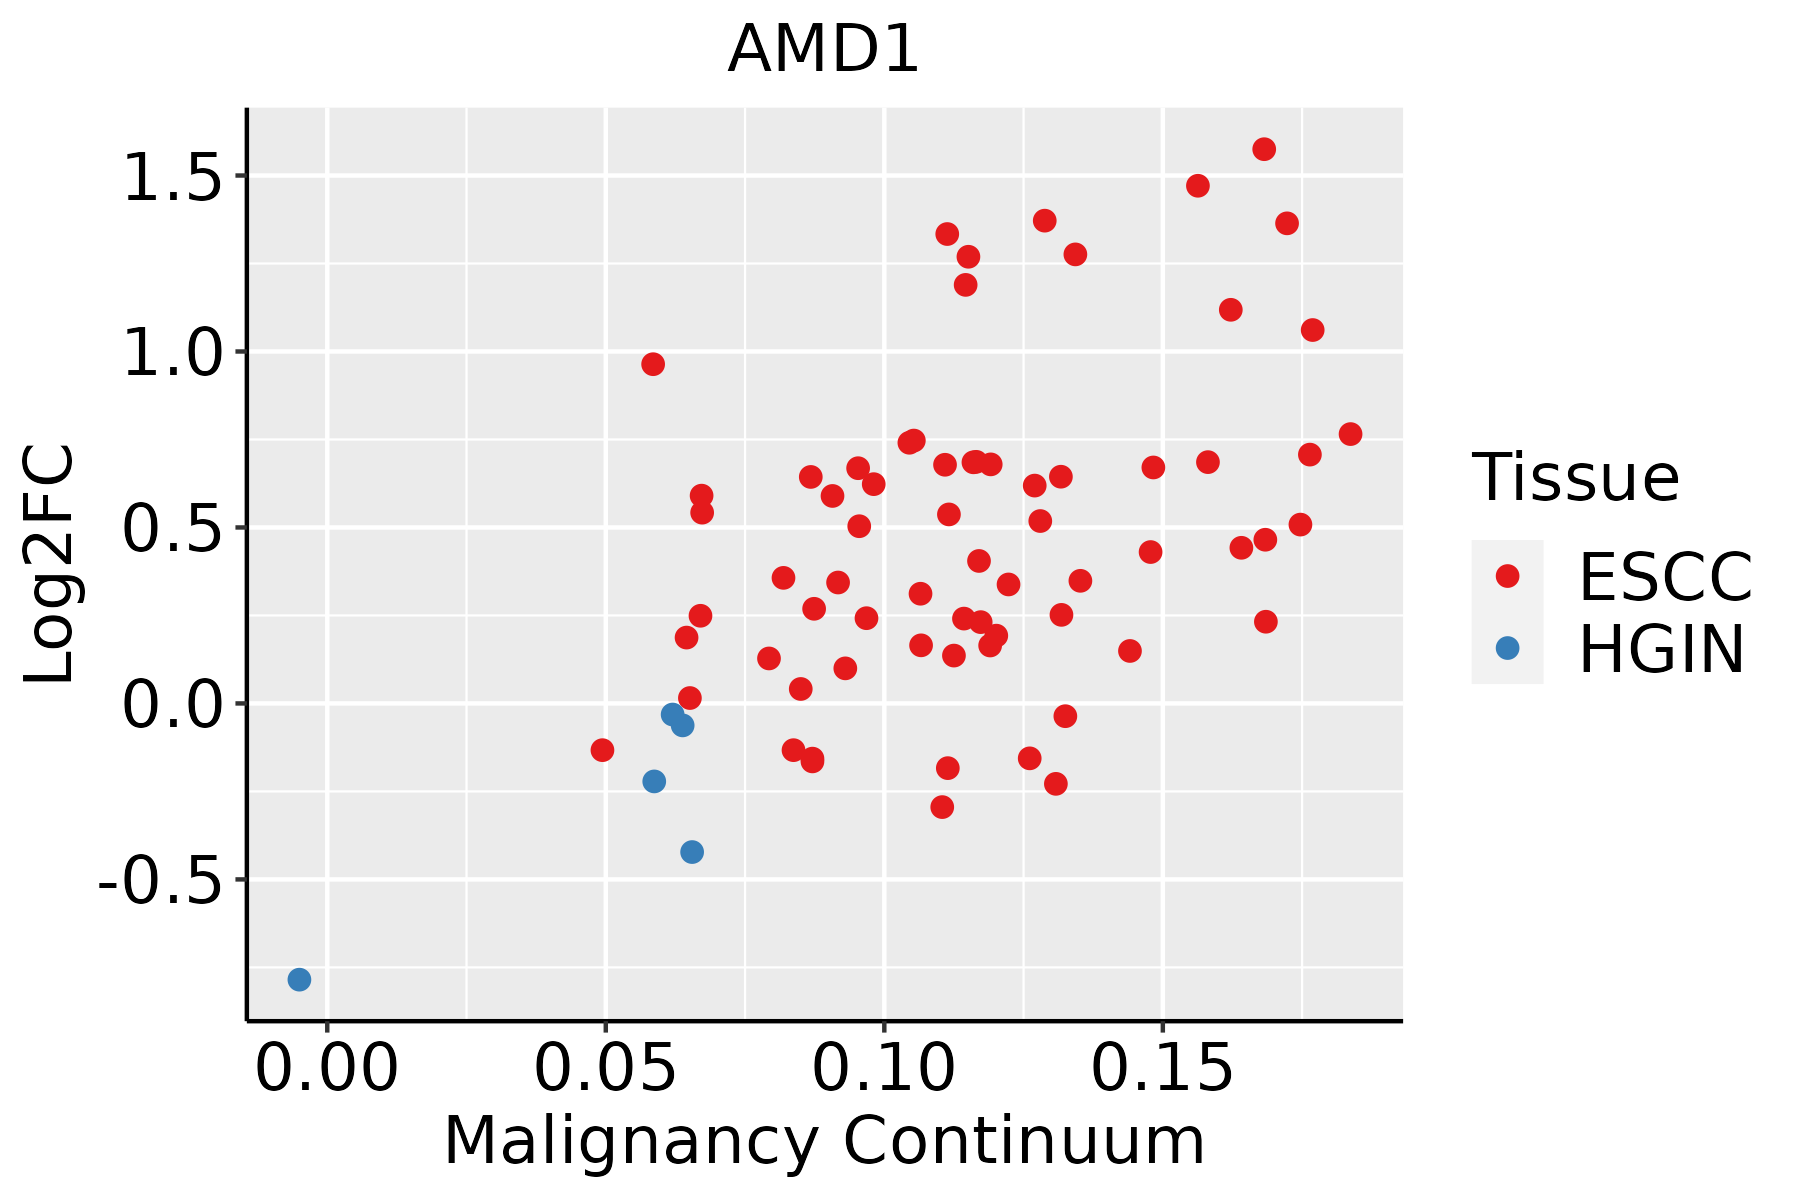 | ESCC: Esophageal squamous cell carcinoma |
| HGIN: High-grade intraepithelial neoplasias |
| LGIN: Low-grade intraepithelial neoplasias |
| Liver | 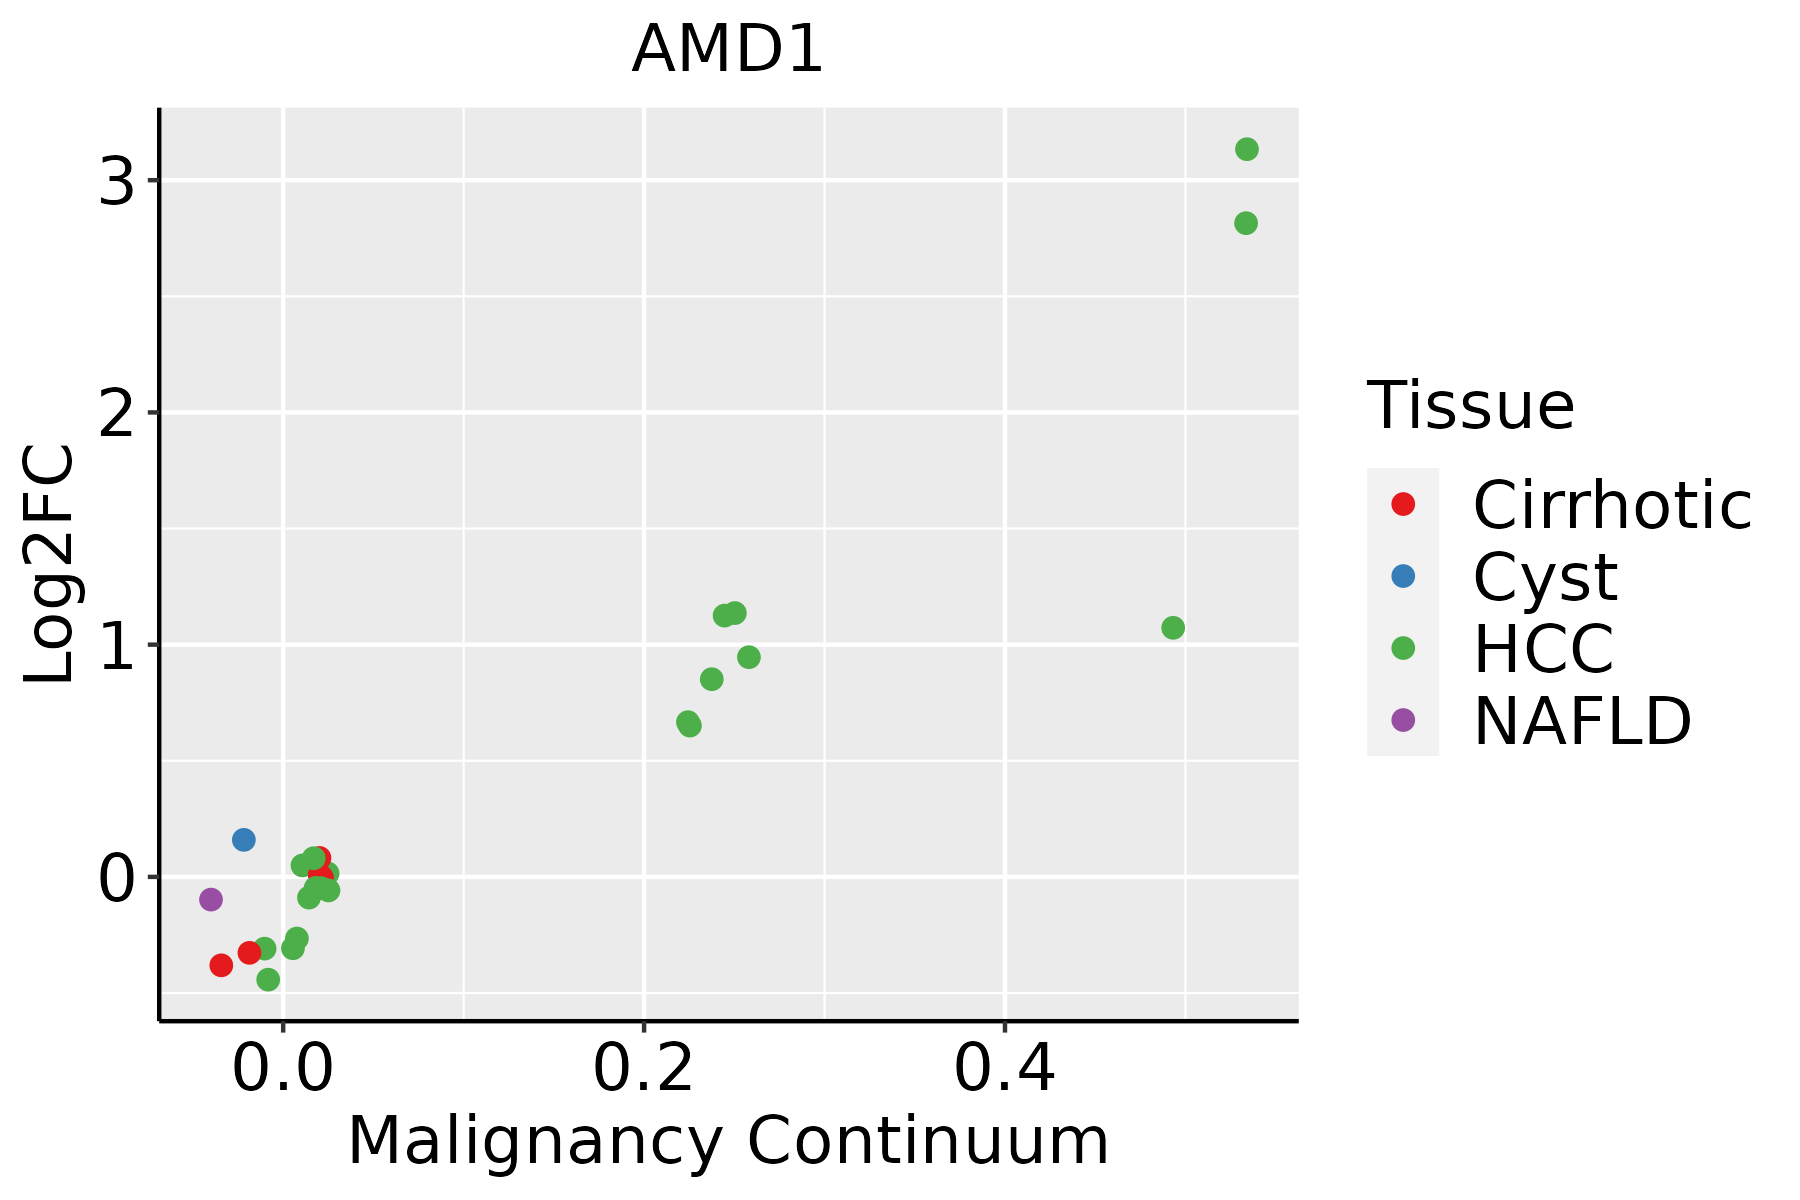 | HCC: Hepatocellular carcinoma |
| NAFLD: Non-alcoholic fatty liver disease |
| Oral Cavity | 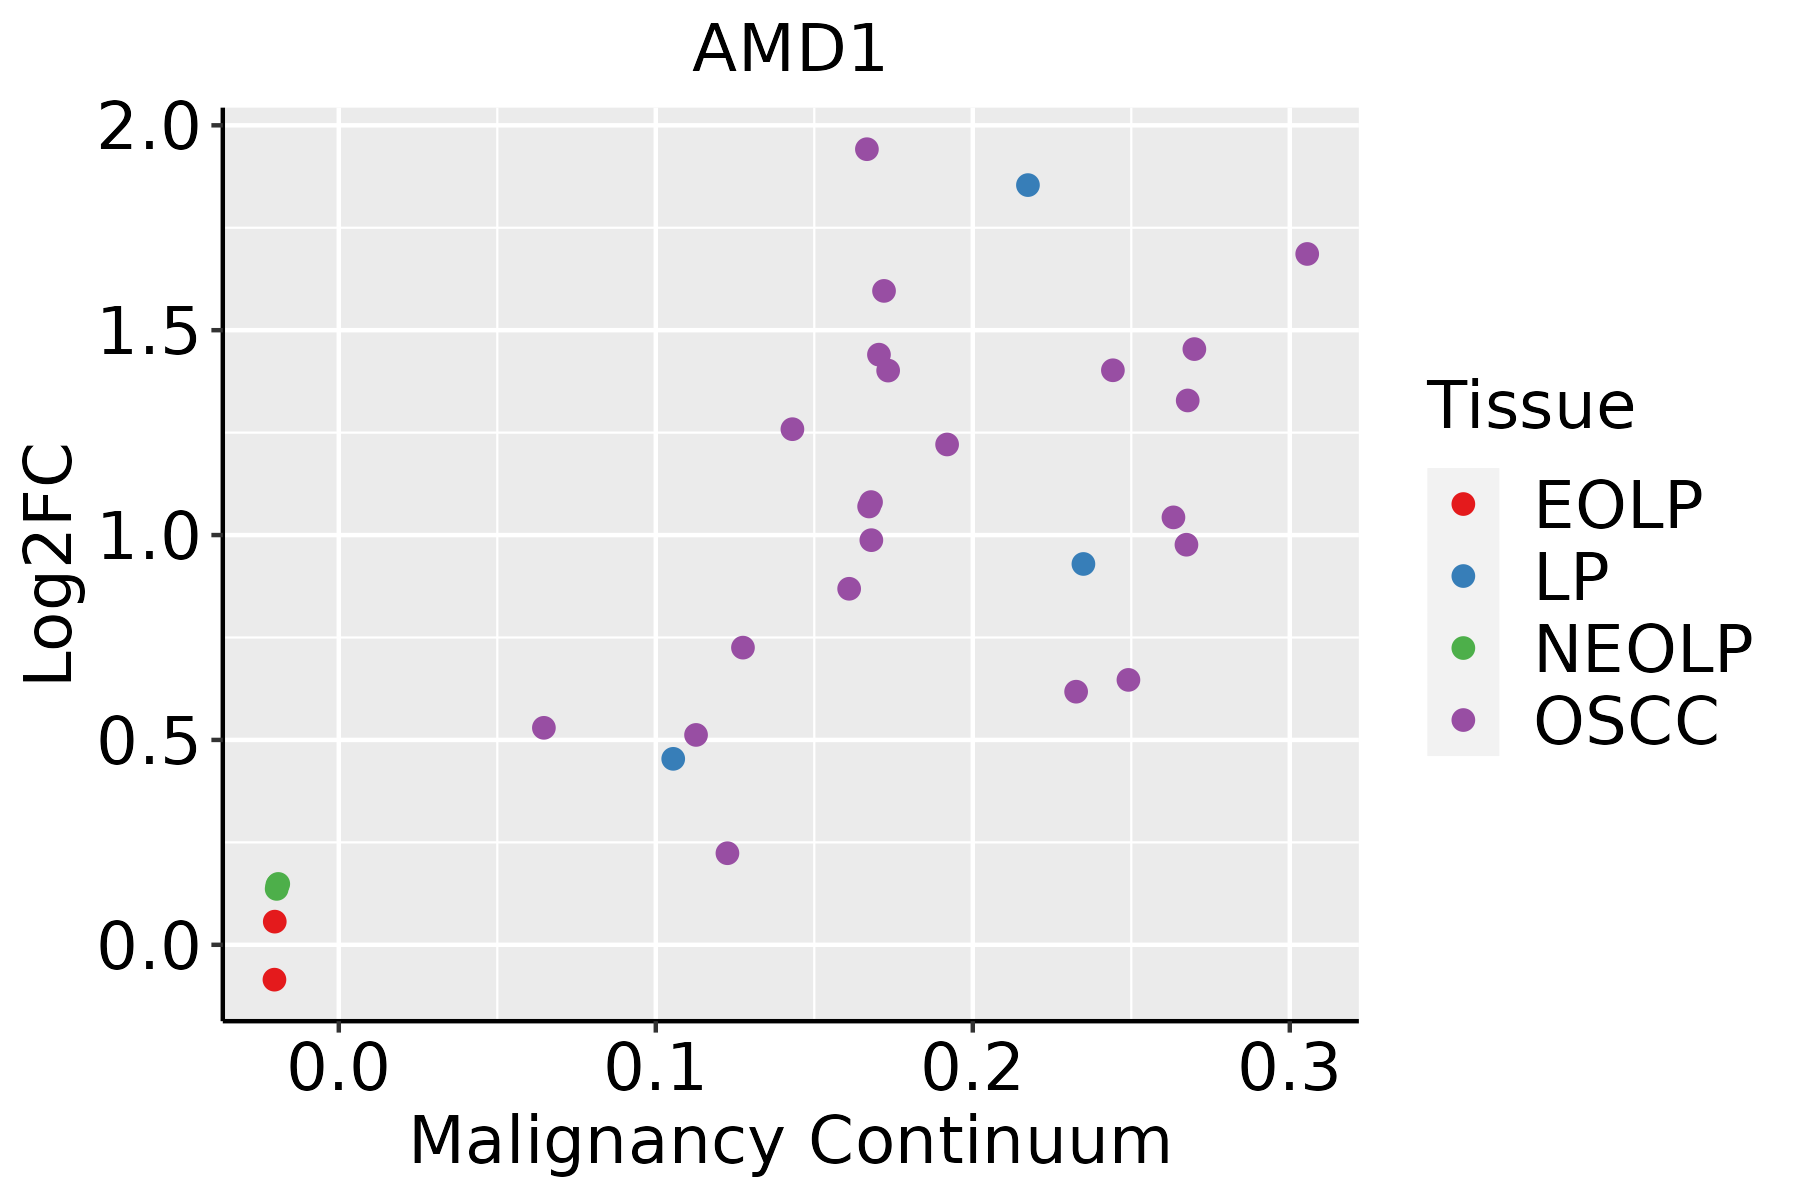 | EOLP: Erosive Oral lichen planus |
| LP: leukoplakia |
| NEOLP: Non-erosive oral lichen planus |
| OSCC: Oral squamous cell carcinoma |
| Prostate | 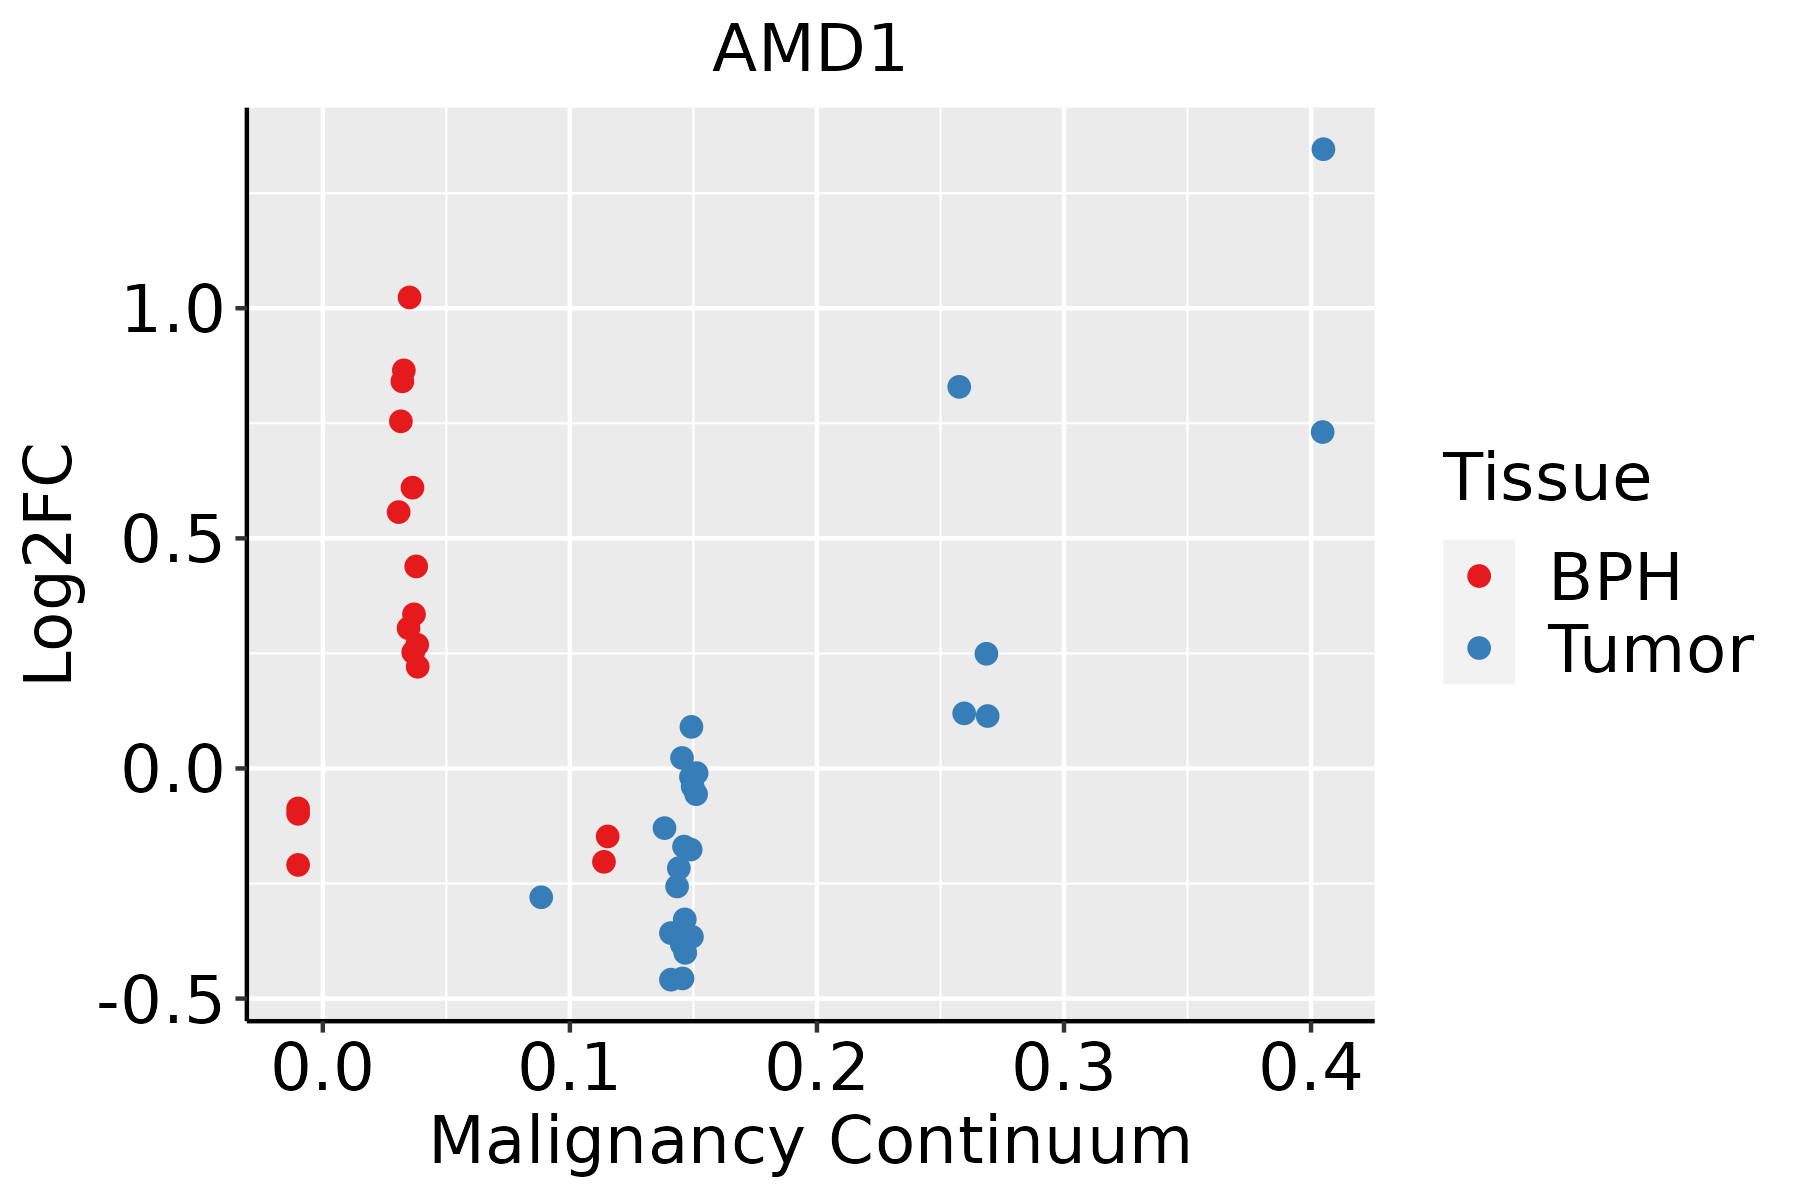 | BPH: Benign Prostatic Hyperplasia |
| Skin | 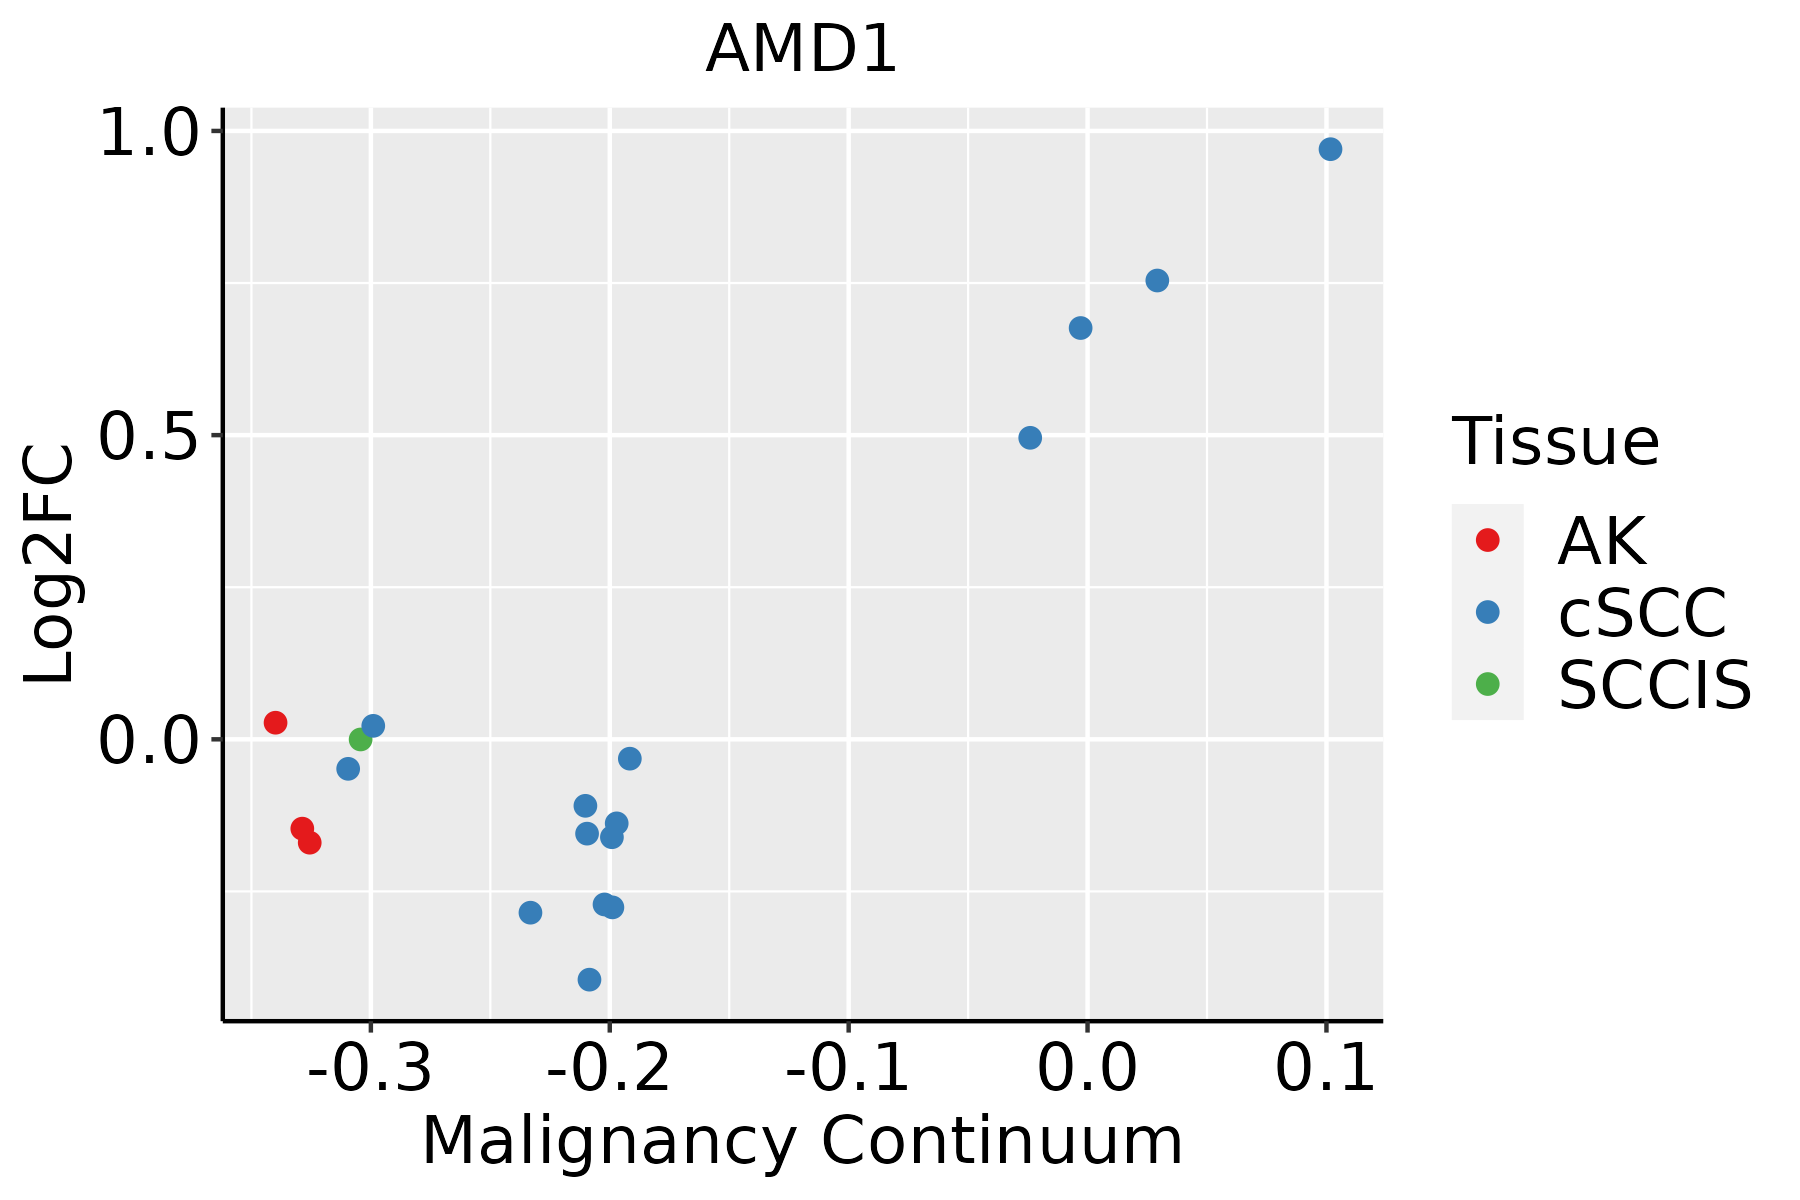 | AK: Actinic keratosis |
| cSCC: Cutaneous squamous cell carcinoma |
| SCCIS:squamous cell carcinoma in situ |
| Thyroid | 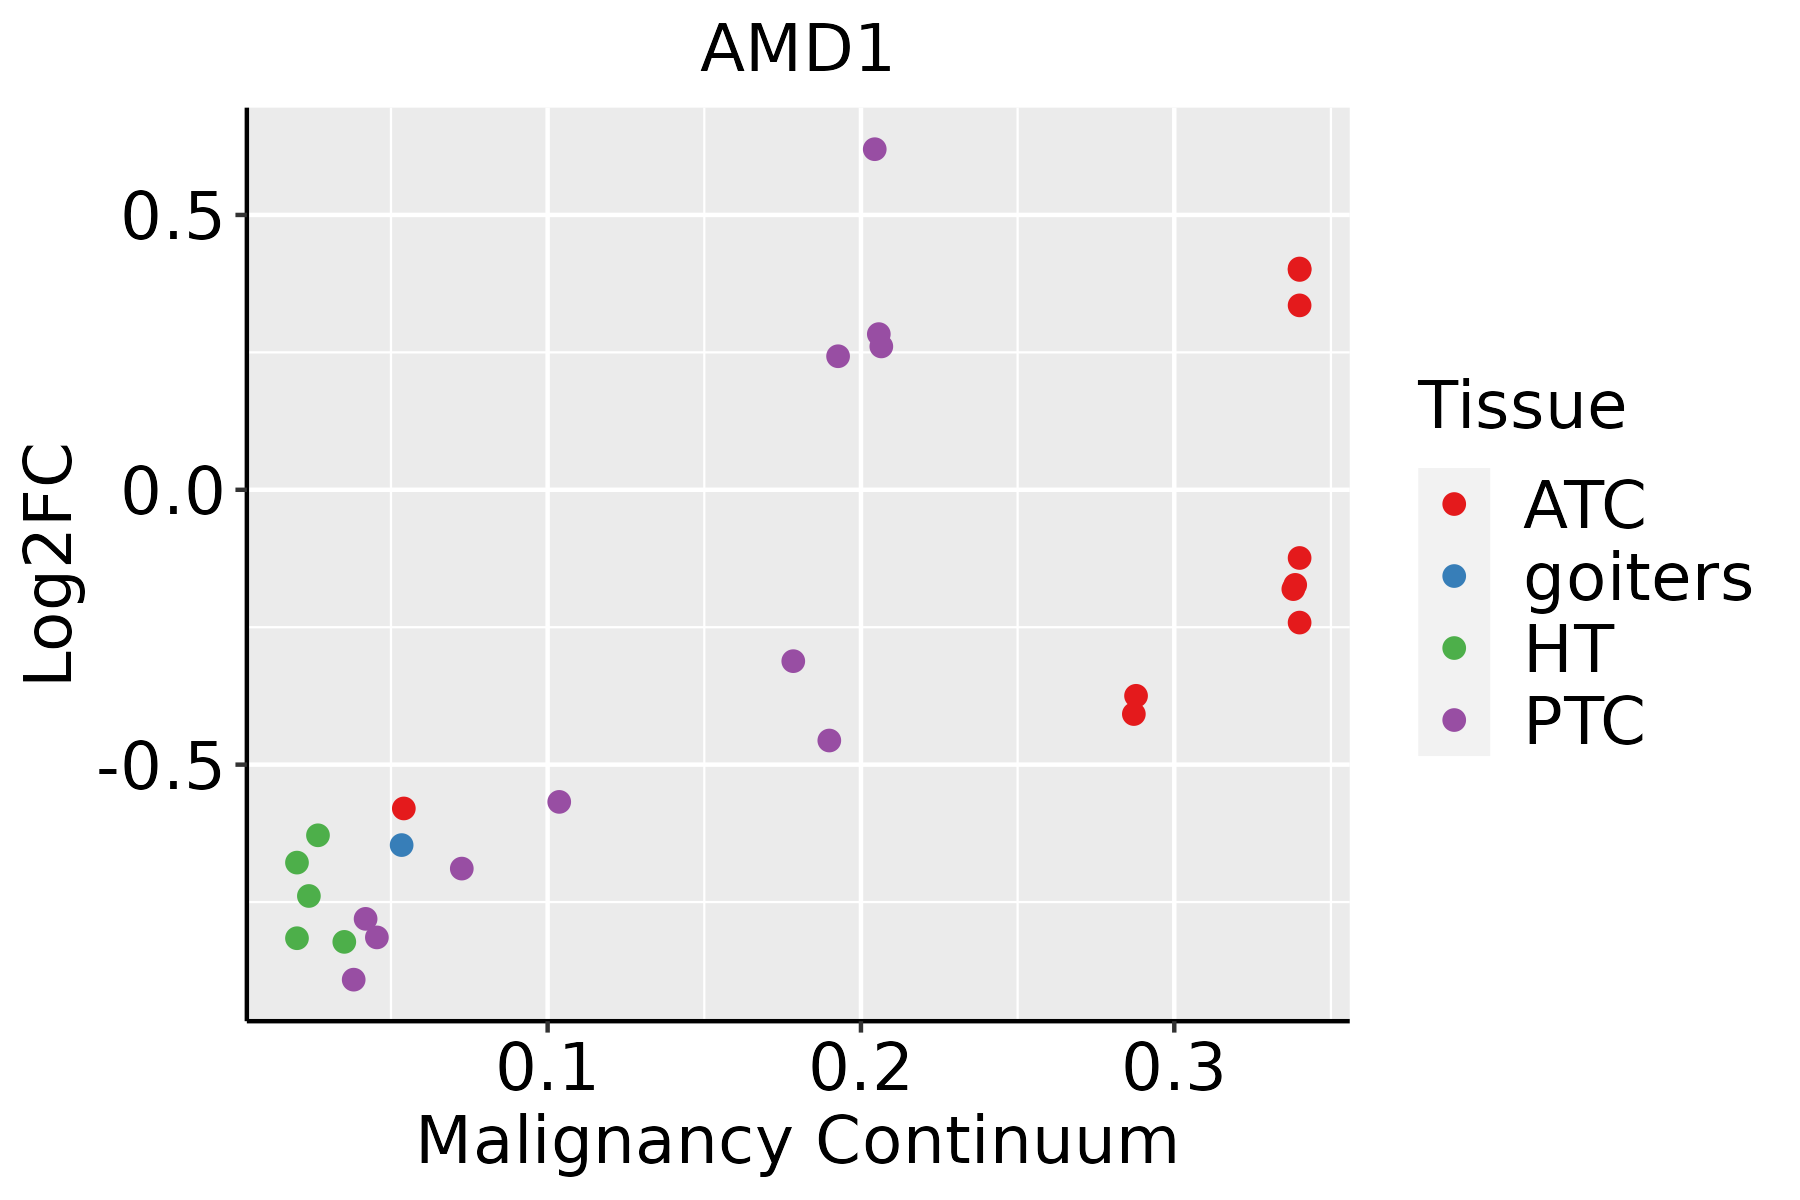 | ATC: Anaplastic thyroid cancer |
| HT: Hashimoto's thyroiditis |
| PTC: Papillary thyroid cancer |
| GO ID | Tissue | Disease Stage | Description | Gene Ratio | Bg Ratio | pvalue | p.adjust | Count |
| GO:0010876 | Colorectum | AD | lipid localization | 120/3918 | 448/18723 | 1.59e-03 | 1.33e-02 | 120 |
| GO:0006869 | Colorectum | AD | lipid transport | 108/3918 | 398/18723 | 1.67e-03 | 1.39e-02 | 108 |
| GO:0097305 | Colorectum | AD | response to alcohol | 71/3918 | 253/18723 | 4.01e-03 | 2.80e-02 | 71 |
| GO:00973051 | Colorectum | MSS | response to alcohol | 66/3467 | 253/18723 | 1.73e-03 | 1.54e-02 | 66 |
| GO:00108761 | Colorectum | MSS | lipid localization | 104/3467 | 448/18723 | 6.76e-03 | 4.38e-02 | 104 |
| GO:00973052 | Colorectum | MSI-H | response to alcohol | 33/1319 | 253/18723 | 4.53e-04 | 9.61e-03 | 33 |
| GO:00068691 | Colorectum | FAP | lipid transport | 81/2622 | 398/18723 | 2.84e-04 | 3.76e-03 | 81 |
| GO:00973053 | Colorectum | FAP | response to alcohol | 55/2622 | 253/18723 | 5.05e-04 | 5.78e-03 | 55 |
| GO:0097306 | Colorectum | FAP | cellular response to alcohol | 25/2622 | 93/18723 | 7.87e-04 | 8.29e-03 | 25 |
| GO:00108762 | Colorectum | FAP | lipid localization | 85/2622 | 448/18723 | 1.92e-03 | 1.63e-02 | 85 |
| GO:007252117 | Endometrium | EEC | purine-containing compound metabolic process | 73/2168 | 416/18723 | 1.82e-04 | 2.24e-03 | 73 |
| GO:007252214 | Endometrium | EEC | purine-containing compound biosynthetic process | 37/2168 | 200/18723 | 2.62e-03 | 1.90e-02 | 37 |
| GO:00065952 | Endometrium | EEC | polyamine metabolic process | 7/2168 | 18/18723 | 2.76e-03 | 1.97e-02 | 7 |
| GO:00067906 | Esophagus | ESCC | sulfur compound metabolic process | 201/8552 | 339/18723 | 2.64e-07 | 3.94e-06 | 201 |
| GO:0072521111 | Esophagus | ESCC | purine-containing compound metabolic process | 238/8552 | 416/18723 | 1.20e-06 | 1.49e-05 | 238 |
| GO:00442725 | Esophagus | ESCC | sulfur compound biosynthetic process | 96/8552 | 148/18723 | 1.86e-06 | 2.16e-05 | 96 |
| GO:007252217 | Esophagus | ESCC | purine-containing compound biosynthetic process | 120/8552 | 200/18723 | 3.02e-05 | 2.51e-04 | 120 |
| GO:19016574 | Esophagus | ESCC | glycosyl compound metabolic process | 57/8552 | 88/18723 | 2.32e-04 | 1.44e-03 | 57 |
| GO:0097305111 | Esophagus | ESCC | response to alcohol | 138/8552 | 253/18723 | 2.70e-03 | 1.14e-02 | 138 |
| GO:00091163 | Esophagus | ESCC | nucleoside metabolic process | 39/8552 | 62/18723 | 4.68e-03 | 1.82e-02 | 39 |
| Pathway ID | Tissue | Disease Stage | Description | Gene Ratio | Bg Ratio | pvalue | p.adjust | qvalue | Count |
| hsa002704 | Endometrium | EEC | Cysteine and methionine metabolism | 15/1237 | 52/8465 | 6.02e-03 | 3.12e-02 | 2.33e-02 | 15 |
| hsa0027011 | Endometrium | EEC | Cysteine and methionine metabolism | 15/1237 | 52/8465 | 6.02e-03 | 3.12e-02 | 2.33e-02 | 15 |
| hsa00270 | Liver | Cirrhotic | Cysteine and methionine metabolism | 27/2530 | 52/8465 | 6.98e-04 | 4.15e-03 | 2.56e-03 | 27 |
| hsa003308 | Liver | Cirrhotic | Arginine and proline metabolism | 25/2530 | 50/8465 | 2.18e-03 | 9.41e-03 | 5.80e-03 | 25 |
| hsa002701 | Liver | Cirrhotic | Cysteine and methionine metabolism | 27/2530 | 52/8465 | 6.98e-04 | 4.15e-03 | 2.56e-03 | 27 |
| hsa0033011 | Liver | Cirrhotic | Arginine and proline metabolism | 25/2530 | 50/8465 | 2.18e-03 | 9.41e-03 | 5.80e-03 | 25 |
| hsa002702 | Liver | HCC | Cysteine and methionine metabolism | 35/4020 | 52/8465 | 3.03e-03 | 9.94e-03 | 5.53e-03 | 35 |
| hsa0033021 | Liver | HCC | Arginine and proline metabolism | 33/4020 | 50/8465 | 6.28e-03 | 1.77e-02 | 9.83e-03 | 33 |
| hsa002703 | Liver | HCC | Cysteine and methionine metabolism | 35/4020 | 52/8465 | 3.03e-03 | 9.94e-03 | 5.53e-03 | 35 |
| hsa0033031 | Liver | HCC | Arginine and proline metabolism | 33/4020 | 50/8465 | 6.28e-03 | 1.77e-02 | 9.83e-03 | 33 |
| hsa0033010 | Oral cavity | OSCC | Arginine and proline metabolism | 30/3704 | 50/8465 | 1.50e-02 | 3.26e-02 | 1.66e-02 | 30 |
| hsa0033013 | Oral cavity | OSCC | Arginine and proline metabolism | 30/3704 | 50/8465 | 1.50e-02 | 3.26e-02 | 1.66e-02 | 30 |
| hsa0033023 | Oral cavity | LP | Arginine and proline metabolism | 26/2418 | 50/8465 | 3.94e-04 | 2.08e-03 | 1.34e-03 | 26 |
| hsa0033033 | Oral cavity | LP | Arginine and proline metabolism | 26/2418 | 50/8465 | 3.94e-04 | 2.08e-03 | 1.34e-03 | 26 |
| hsa003309 | Prostate | BPH | Arginine and proline metabolism | 18/1718 | 50/8465 | 7.17e-03 | 2.32e-02 | 1.43e-02 | 18 |
| hsa0033012 | Prostate | BPH | Arginine and proline metabolism | 18/1718 | 50/8465 | 7.17e-03 | 2.32e-02 | 1.43e-02 | 18 |
| hsa0033022 | Prostate | Tumor | Arginine and proline metabolism | 19/1791 | 50/8465 | 4.73e-03 | 1.67e-02 | 1.03e-02 | 19 |
| hsa0033032 | Prostate | Tumor | Arginine and proline metabolism | 19/1791 | 50/8465 | 4.73e-03 | 1.67e-02 | 1.03e-02 | 19 |
| Hugo Symbol | Variant Class | Variant Classification | dbSNP RS | HGVSc | HGVSp | HGVSp Short | SWISSPROT | BIOTYPE | SIFT | PolyPhen | Tumor Sample Barcode | Tissue | Histology | Sex | Age | Stage | Therapy Types | Drugs | Outcome |
| AMD1 | SNV | Missense_Mutation | novel | c.722C>T | p.Thr241Ile | p.T241I | P17707 | protein_coding | deleterious(0) | probably_damaging(0.995) | TCGA-AO-A0J9-01 | Breast | breast invasive carcinoma | Female | <65 | III/IV | Chemotherapy | cyclophosphamide | PD |
| AMD1 | SNV | Missense_Mutation | | c.793N>A | p.Asp265Asn | p.D265N | P17707 | protein_coding | tolerated(0.31) | benign(0.098) | TCGA-C8-A12T-01 | Breast | breast invasive carcinoma | Female | <65 | I/II | Unknown | Unknown | SD |
| AMD1 | SNV | Missense_Mutation | | c.574N>C | p.Phe192Leu | p.F192L | P17707 | protein_coding | deleterious(0.04) | possibly_damaging(0.791) | TCGA-D8-A1XK-01 | Breast | breast invasive carcinoma | Female | <65 | I/II | Chemotherapy | doxorubicine+cyclophosphamide | SD |
| AMD1 | insertion | In_Frame_Ins | novel | c.724_725insAAATATCAGATAAAATATTTTTAG | p.Ile242delinsLysIleSerAspLysIlePheLeuVal | p.I242delinsKISDKIFLV | P17707 | protein_coding | | | TCGA-AO-A0J9-01 | Breast | breast invasive carcinoma | Female | <65 | III/IV | Chemotherapy | cyclophosphamide | PD |
| AMD1 | SNV | Missense_Mutation | novel | c.699N>C | p.Met233Ile | p.M233I | P17707 | protein_coding | tolerated(0.97) | benign(0.019) | TCGA-C5-A1MH-01 | Cervix | cervical & endocervical cancer | Female | >=65 | III/IV | Chemotherapy | cisplatin | PD |
| AMD1 | SNV | Missense_Mutation | | c.146G>C | p.Cys49Ser | p.C49S | P17707 | protein_coding | deleterious(0.01) | probably_damaging(0.995) | TCGA-C5-A2LX-01 | Cervix | cervical & endocervical cancer | Female | <65 | I/II | Chemotherapy | cisplatin | SD |
| AMD1 | SNV | Missense_Mutation | | c.999G>C | p.Gln333His | p.Q333H | P17707 | protein_coding | tolerated_low_confidence(0.09) | benign(0.007) | TCGA-JX-A3Q0-01 | Cervix | cervical & endocervical cancer | Female | <65 | III/IV | Unknown | Unknown | SD |
| AMD1 | SNV | Missense_Mutation | novel | c.863N>G | p.Gln288Arg | p.Q288R | P17707 | protein_coding | tolerated(0.08) | benign(0.068) | TCGA-A6-2672-01 | Colorectum | colon adenocarcinoma | Female | >=65 | III/IV | Unknown | Unknown | SD |
| AMD1 | SNV | Missense_Mutation | novel | c.686N>T | p.Ser229Leu | p.S229L | P17707 | protein_coding | deleterious(0) | probably_damaging(0.998) | TCGA-A6-6141-01 | Colorectum | colon adenocarcinoma | Male | <65 | I/II | Chemotherapy | 5-fu | SD |
| AMD1 | SNV | Missense_Mutation | | c.502N>T | p.Arg168Trp | p.R168W | P17707 | protein_coding | tolerated(0.2) | benign(0.015) | TCGA-AA-3510-01 | Colorectum | colon adenocarcinoma | Male | >=65 | I/II | Unknown | Unknown | SD |


