
|
|||||
|
 | |
| |
| |
| |
| |
| |
|
Gene: AMBRA1 |
Gene summary for AMBRA1 |
| Gene information | Species | Human | Gene symbol | AMBRA1 | Gene ID | 55626 |
| Gene name | autophagy and beclin 1 regulator 1 | |
| Gene Alias | DCAF3 | |
| Cytomap | 11p11.2 | |
| Gene Type | protein-coding | GO ID | GO:0000045 | UniProtAcc | Q9C0C7 |
Top |
Malignant transformation analysis |
| Identification of the aberrant gene expression in precancerous and cancerous lesions by comparing the gene expression of stem-like cells in diseased tissues with normal stem cells |
| Entrez ID | Symbol | Replicates | Species | Organ | Tissue | Adj P-value | Log2FC | Malignancy |
| 55626 | AMBRA1 | CCI_1 | Human | Cervix | CC | 6.89e-10 | 6.65e-01 | 0.528 |
| 55626 | AMBRA1 | CCI_2 | Human | Cervix | CC | 2.16e-22 | 1.39e+00 | 0.5249 |
| 55626 | AMBRA1 | CCI_3 | Human | Cervix | CC | 9.69e-18 | 9.62e-01 | 0.516 |
| 55626 | AMBRA1 | HTA11_3410_2000001011 | Human | Colorectum | AD | 2.21e-15 | -5.85e-01 | 0.0155 |
| 55626 | AMBRA1 | HTA11_7862_2000001011 | Human | Colorectum | AD | 1.09e-02 | -4.36e-01 | -0.0179 |
| 55626 | AMBRA1 | HTA11_866_3004761011 | Human | Colorectum | AD | 1.61e-04 | -3.60e-01 | 0.096 |
| 55626 | AMBRA1 | HTA11_10711_2000001011 | Human | Colorectum | AD | 7.80e-03 | -4.04e-01 | 0.0338 |
| 55626 | AMBRA1 | HTA11_99999970781_79442 | Human | Colorectum | MSS | 3.77e-11 | -4.94e-01 | 0.294 |
| 55626 | AMBRA1 | HTA11_99999965104_69814 | Human | Colorectum | MSS | 1.91e-18 | 1.01e+00 | 0.281 |
| 55626 | AMBRA1 | HTA11_99999974143_84620 | Human | Colorectum | MSS | 6.41e-13 | -4.86e-01 | 0.3005 |
| 55626 | AMBRA1 | F007 | Human | Colorectum | FAP | 1.21e-02 | -3.65e-01 | 0.1176 |
| 55626 | AMBRA1 | A015-C-203 | Human | Colorectum | FAP | 9.92e-35 | -3.50e-01 | -0.1294 |
| 55626 | AMBRA1 | A015-C-204 | Human | Colorectum | FAP | 5.10e-05 | -3.42e-01 | -0.0228 |
| 55626 | AMBRA1 | A014-C-040 | Human | Colorectum | FAP | 8.90e-04 | -3.71e-01 | -0.1184 |
| 55626 | AMBRA1 | A002-C-201 | Human | Colorectum | FAP | 1.05e-12 | -3.63e-01 | 0.0324 |
| 55626 | AMBRA1 | A002-C-203 | Human | Colorectum | FAP | 9.46e-05 | -3.02e-02 | 0.2786 |
| 55626 | AMBRA1 | A001-C-119 | Human | Colorectum | FAP | 1.73e-07 | 8.26e-02 | -0.1557 |
| 55626 | AMBRA1 | A001-C-108 | Human | Colorectum | FAP | 2.59e-18 | -1.87e-01 | -0.0272 |
| 55626 | AMBRA1 | A002-C-205 | Human | Colorectum | FAP | 2.17e-22 | -3.00e-01 | -0.1236 |
| 55626 | AMBRA1 | A001-C-104 | Human | Colorectum | FAP | 3.36e-08 | -2.23e-01 | 0.0184 |
| Page: 1 2 3 4 5 6 |
| Tissue | Expression Dynamics | Abbreviation |
| Cervix |  | CC: Cervix cancer |
| HSIL_HPV: HPV-infected high-grade squamous intraepithelial lesions | ||
| N_HPV: HPV-infected normal cervix | ||
| Colorectum (GSE201348) |  | FAP: Familial adenomatous polyposis |
| CRC: Colorectal cancer | ||
| Colorectum (HTA11) |  | AD: Adenomas |
| SER: Sessile serrated lesions | ||
| MSI-H: Microsatellite-high colorectal cancer | ||
| MSS: Microsatellite stable colorectal cancer | ||
| Endometrium | 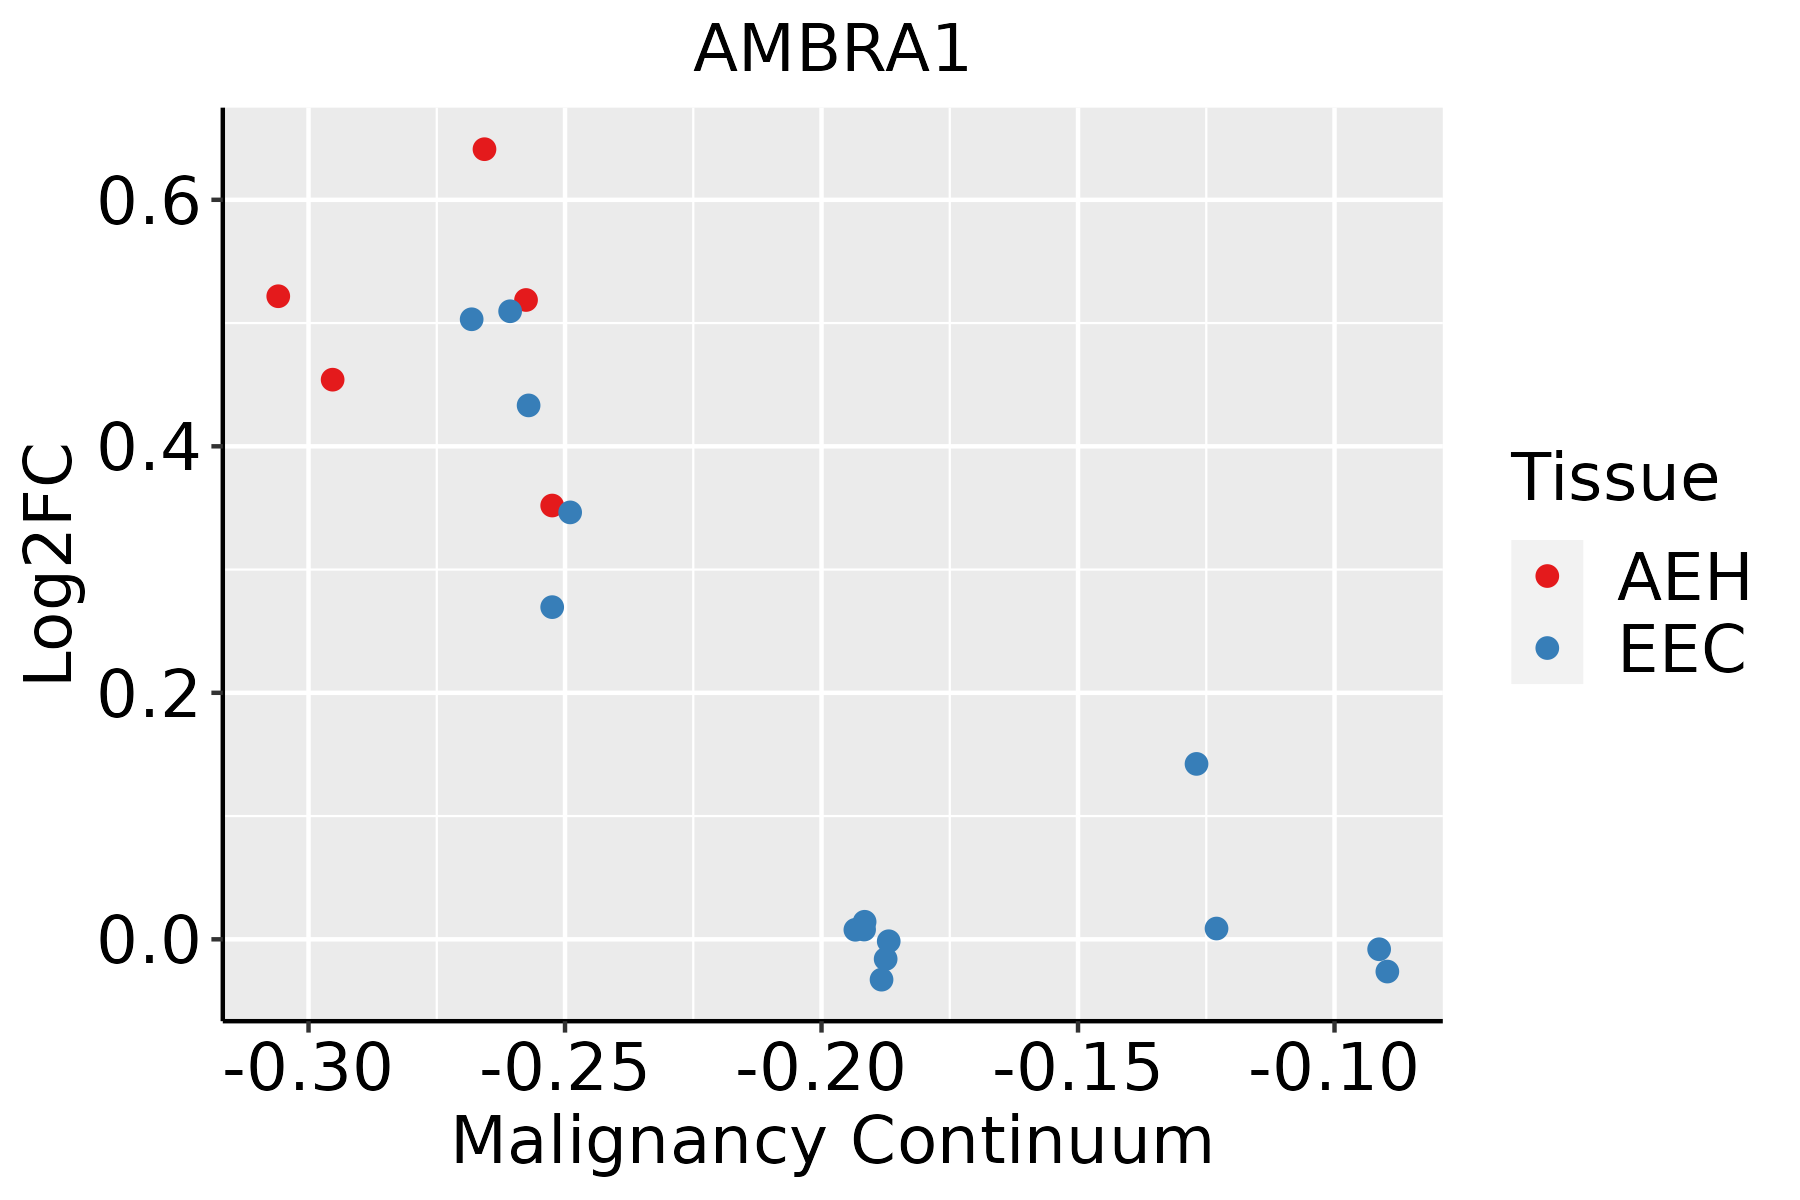 | AEH: Atypical endometrial hyperplasia |
| EEC: Endometrioid Cancer | ||
| GC | 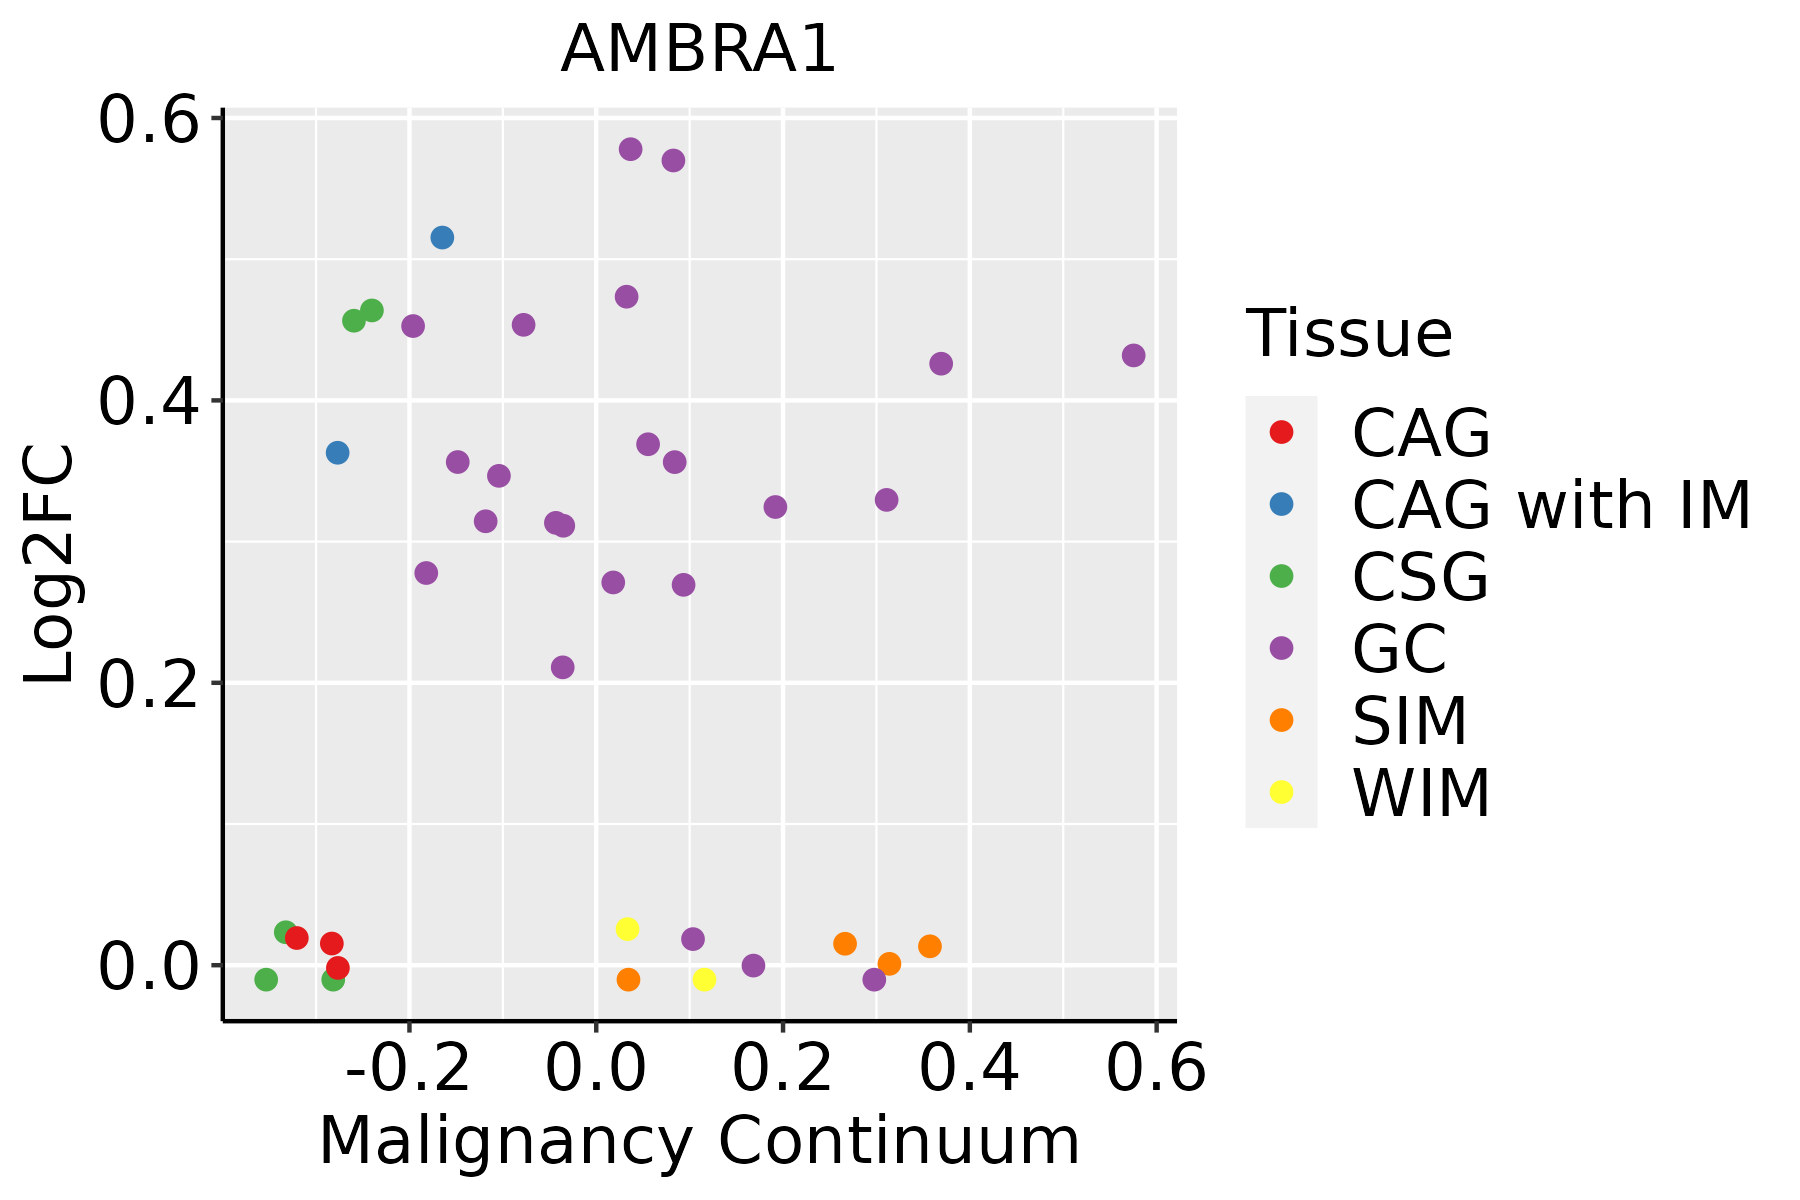 | CAG: Chronic atrophic gastritis |
| CAG with IM: Chronic atrophic gastritis with intestinal metaplasia | ||
| CSG: Chronic superficial gastritis | ||
| GC: Gastric cancer | ||
| SIM: Severe intestinal metaplasia | ||
| WIM: Wild intestinal metaplasia | ||
| Liver |  | HCC: Hepatocellular carcinoma |
| NAFLD: Non-alcoholic fatty liver disease | ||
| Lung | 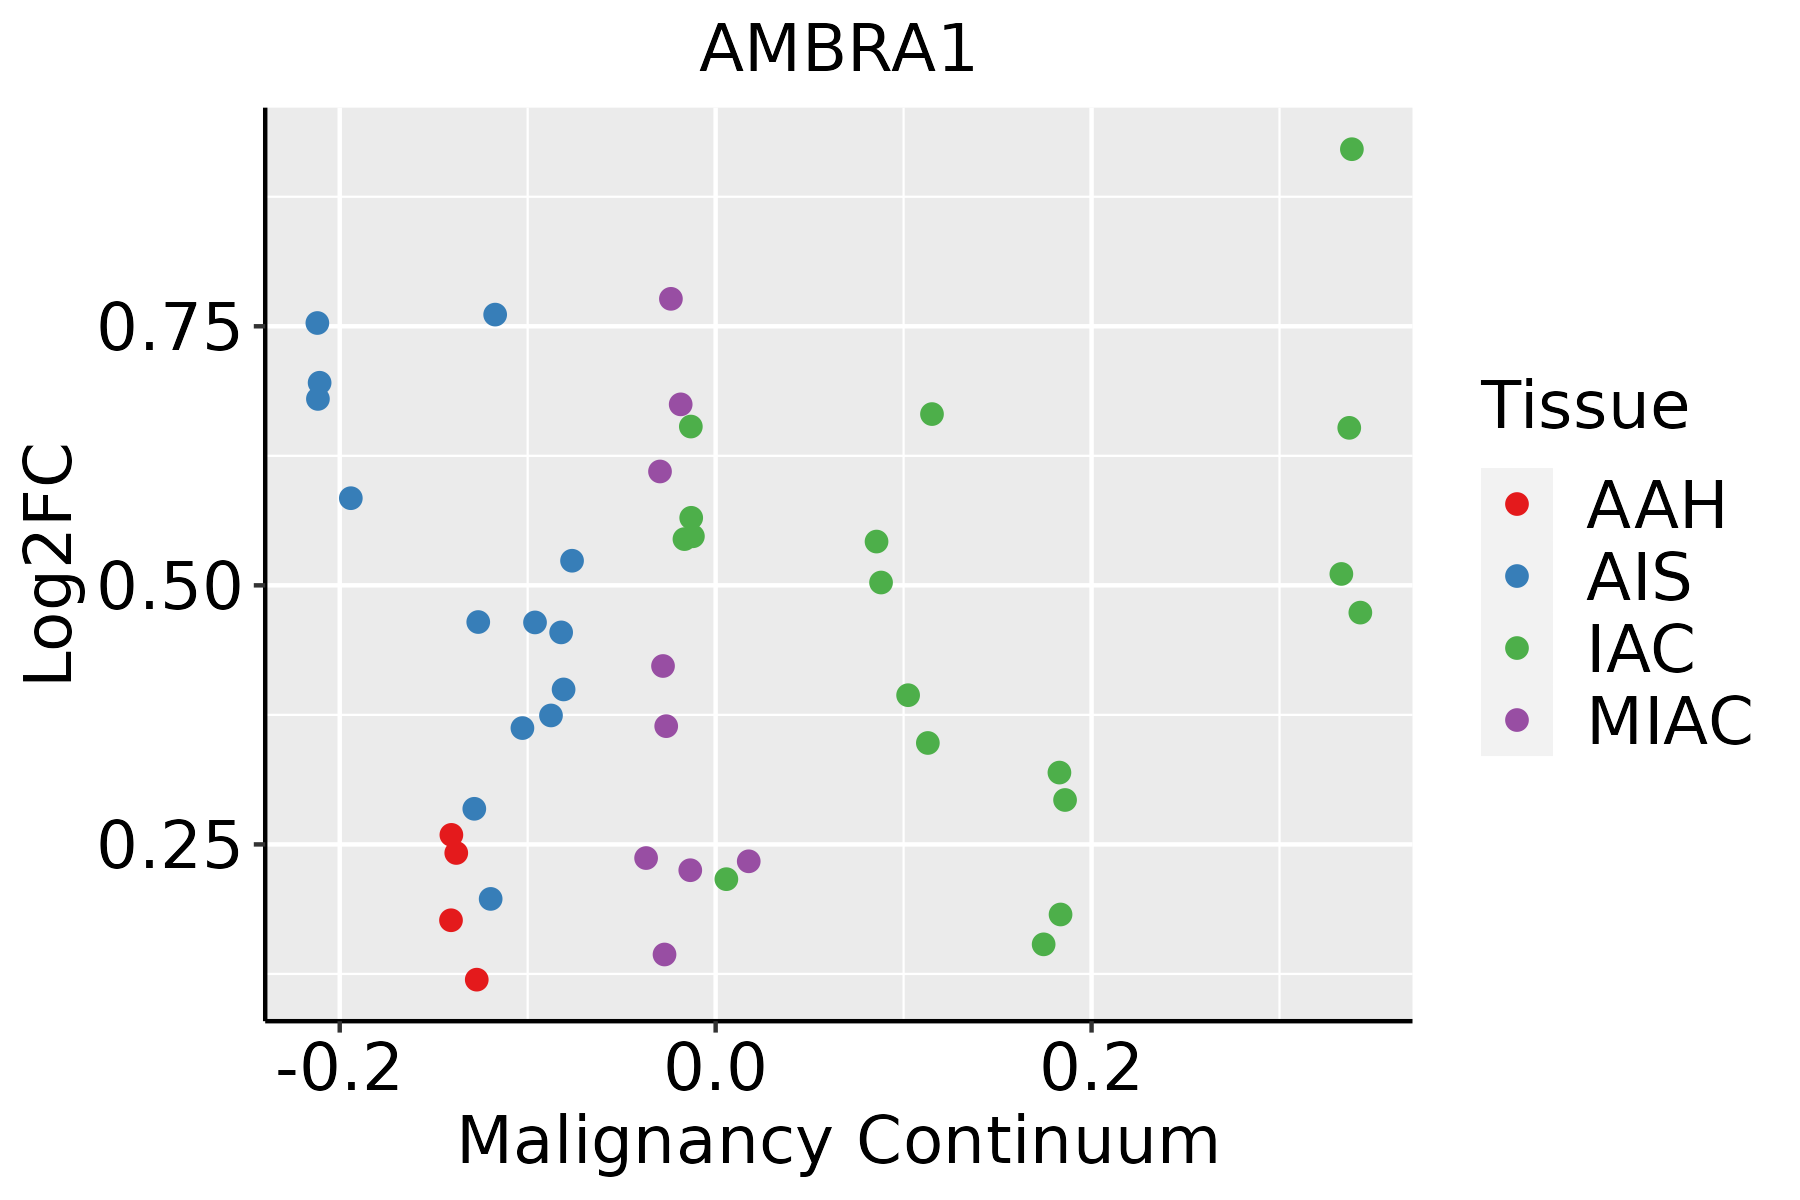 | AAH: Atypical adenomatous hyperplasia |
| AIS: Adenocarcinoma in situ | ||
| IAC: Invasive lung adenocarcinoma | ||
| MIA: Minimally invasive adenocarcinoma | ||
| Prostate |  | BPH: Benign Prostatic Hyperplasia |
| ∗log2FC in expression of this searched gene in stem-like cells from each diseased tissue sample relative to stem-like cells in normal samples in each tissue plotted against the malignancy continuum. Samples are colored based on if they are from different disease stage. |
Top |
Malignant transformation related pathway analysis |
| Find out the enriched GO biological processes and KEGG pathways involved in transition from healthy to precancer to cancer |
| Tissue | Disease Stage | Enriched GO biological Processes |
| Colorectum | AD |  |
| Colorectum | SER |  |
| Colorectum | MSS |  |
| Colorectum | MSI-H |  |
| Colorectum | FAP |  |
| ∗Top 15 enriched GO BP terms are showed in the bar plot of each disease state in each tissue. Each row represents a significant GO biological process which is colored according to the -log10(p.adjust). |
| Page: 1 2 3 4 5 6 7 8 9 |
| GO ID | Tissue | Disease Stage | Description | Gene Ratio | Bg Ratio | pvalue | p.adjust | Count |
| GO:003367410 | Cervix | CC | positive regulation of kinase activity | 101/2311 | 467/18723 | 8.66e-09 | 7.22e-07 | 101 |
| GO:002241110 | Cervix | CC | cellular component disassembly | 83/2311 | 443/18723 | 6.04e-05 | 8.68e-04 | 83 |
| GO:00162367 | Cervix | CC | macroautophagy | 58/2311 | 291/18723 | 1.40e-04 | 1.70e-03 | 58 |
| GO:00004227 | Cervix | CC | autophagy of mitochondrion | 21/2311 | 81/18723 | 6.47e-04 | 6.02e-03 | 21 |
| GO:00617267 | Cervix | CC | mitochondrion disassembly | 21/2311 | 81/18723 | 6.47e-04 | 6.02e-03 | 21 |
| GO:00000452 | Cervix | CC | autophagosome assembly | 21/2311 | 99/18723 | 8.67e-03 | 4.46e-02 | 21 |
| GO:0022411 | Colorectum | AD | cellular component disassembly | 147/3918 | 443/18723 | 8.53e-10 | 6.76e-08 | 147 |
| GO:0016236 | Colorectum | AD | macroautophagy | 103/3918 | 291/18723 | 6.76e-09 | 4.15e-07 | 103 |
| GO:1903008 | Colorectum | AD | organelle disassembly | 46/3918 | 114/18723 | 1.81e-06 | 5.48e-05 | 46 |
| GO:0000422 | Colorectum | AD | autophagy of mitochondrion | 35/3918 | 81/18723 | 4.94e-06 | 1.29e-04 | 35 |
| GO:0061726 | Colorectum | AD | mitochondrion disassembly | 35/3918 | 81/18723 | 4.94e-06 | 1.29e-04 | 35 |
| GO:0061912 | Colorectum | AD | selective autophagy | 29/3918 | 68/18723 | 4.20e-05 | 7.39e-04 | 29 |
| GO:0033674 | Colorectum | AD | positive regulation of kinase activity | 131/3918 | 467/18723 | 1.28e-04 | 1.85e-03 | 131 |
| GO:0000423 | Colorectum | AD | mitophagy | 14/3918 | 28/18723 | 6.01e-04 | 6.33e-03 | 14 |
| GO:0007033 | Colorectum | AD | vacuole organization | 53/3918 | 180/18723 | 4.18e-03 | 2.89e-02 | 53 |
| GO:00224112 | Colorectum | MSS | cellular component disassembly | 130/3467 | 443/18723 | 1.44e-08 | 8.46e-07 | 130 |
| GO:00162362 | Colorectum | MSS | macroautophagy | 93/3467 | 291/18723 | 2.08e-08 | 1.17e-06 | 93 |
| GO:00004222 | Colorectum | MSS | autophagy of mitochondrion | 33/3467 | 81/18723 | 2.70e-06 | 8.13e-05 | 33 |
| GO:00617262 | Colorectum | MSS | mitochondrion disassembly | 33/3467 | 81/18723 | 2.70e-06 | 8.13e-05 | 33 |
| GO:19030082 | Colorectum | MSS | organelle disassembly | 42/3467 | 114/18723 | 2.98e-06 | 8.91e-05 | 42 |
| Page: 1 2 3 4 5 6 |
| Pathway ID | Tissue | Disease Stage | Description | Gene Ratio | Bg Ratio | pvalue | p.adjust | qvalue | Count |
| hsa0501018 | Cervix | CC | Alzheimer disease | 113/1267 | 384/8465 | 9.67e-14 | 3.92e-12 | 2.32e-12 | 113 |
| hsa0501618 | Cervix | CC | Huntington disease | 94/1267 | 306/8465 | 8.49e-13 | 3.06e-11 | 1.81e-11 | 94 |
| hsa0502218 | Cervix | CC | Pathways of neurodegeneration - multiple diseases | 128/1267 | 476/8465 | 2.87e-12 | 9.29e-11 | 5.50e-11 | 128 |
| hsa0501418 | Cervix | CC | Amyotrophic lateral sclerosis | 103/1267 | 364/8465 | 1.79e-11 | 4.47e-10 | 2.64e-10 | 103 |
| hsa0413718 | Cervix | CC | Mitophagy - animal | 22/1267 | 72/8465 | 5.77e-04 | 2.75e-03 | 1.63e-03 | 22 |
| hsa0501716 | Cervix | CC | Spinocerebellar ataxia | 35/1267 | 143/8465 | 1.77e-03 | 7.21e-03 | 4.26e-03 | 35 |
| hsa0501019 | Cervix | CC | Alzheimer disease | 113/1267 | 384/8465 | 9.67e-14 | 3.92e-12 | 2.32e-12 | 113 |
| hsa0501619 | Cervix | CC | Huntington disease | 94/1267 | 306/8465 | 8.49e-13 | 3.06e-11 | 1.81e-11 | 94 |
| hsa0502219 | Cervix | CC | Pathways of neurodegeneration - multiple diseases | 128/1267 | 476/8465 | 2.87e-12 | 9.29e-11 | 5.50e-11 | 128 |
| hsa0501419 | Cervix | CC | Amyotrophic lateral sclerosis | 103/1267 | 364/8465 | 1.79e-11 | 4.47e-10 | 2.64e-10 | 103 |
| hsa0413719 | Cervix | CC | Mitophagy - animal | 22/1267 | 72/8465 | 5.77e-04 | 2.75e-03 | 1.63e-03 | 22 |
| hsa0501717 | Cervix | CC | Spinocerebellar ataxia | 35/1267 | 143/8465 | 1.77e-03 | 7.21e-03 | 4.26e-03 | 35 |
| hsa05010 | Colorectum | AD | Alzheimer disease | 174/2092 | 384/8465 | 1.82e-19 | 9.26e-18 | 5.91e-18 | 174 |
| hsa05014 | Colorectum | AD | Amyotrophic lateral sclerosis | 164/2092 | 364/8465 | 4.28e-18 | 1.27e-16 | 8.09e-17 | 164 |
| hsa04140 | Colorectum | AD | Autophagy - animal | 49/2092 | 141/8465 | 4.58e-03 | 2.20e-02 | 1.40e-02 | 49 |
| hsa050101 | Colorectum | AD | Alzheimer disease | 174/2092 | 384/8465 | 1.82e-19 | 9.26e-18 | 5.91e-18 | 174 |
| hsa050141 | Colorectum | AD | Amyotrophic lateral sclerosis | 164/2092 | 364/8465 | 4.28e-18 | 1.27e-16 | 8.09e-17 | 164 |
| hsa041401 | Colorectum | AD | Autophagy - animal | 49/2092 | 141/8465 | 4.58e-03 | 2.20e-02 | 1.40e-02 | 49 |
| hsa050104 | Colorectum | MSS | Alzheimer disease | 169/1875 | 384/8465 | 1.21e-22 | 1.01e-20 | 6.21e-21 | 169 |
| hsa050144 | Colorectum | MSS | Amyotrophic lateral sclerosis | 156/1875 | 364/8465 | 1.43e-19 | 4.62e-18 | 2.83e-18 | 156 |
| Page: 1 2 3 4 5 6 |
Top |
Cell-cell communication analysis |
| Identification of potential cell-cell interactions between two cell types and their ligand-receptor pairs for different disease states |
| Ligand | Receptor | LRpair | Pathway | Tissue | Disease Stage |
| Page: 1 |
Top |
Single-cell gene regulatory network inference analysis |
| Find out the significant the regulons (TFs) and the target genes of each regulon across cell types for different disease states |
| TF | Cell Type | Tissue | Disease Stage | Target Gene | RSS | Regulon Activity |
| ∗The dot plots of a searched regulon are shown for all cell subpopulations in each disease state of each tissue based on the regulon specific score inferred using pySCENIC and by calculating the average expression. |
| Page: 1 |
Top |
Somatic mutation of malignant transformation related genes |
| Annotation of somatic variants for genes involved in malignant transformation |
| Hugo Symbol | Variant Class | Variant Classification | dbSNP RS | HGVSc | HGVSp | HGVSp Short | SWISSPROT | BIOTYPE | SIFT | PolyPhen | Tumor Sample Barcode | Tissue | Histology | Sex | Age | Stage | Therapy Types | Drugs | Outcome |
| AMBRA1 | SNV | Missense_Mutation | c.3511G>C | p.Ala1171Pro | p.A1171P | Q9C0C7 | protein_coding | deleterious_low_confidence(0.01) | benign(0.191) | TCGA-AN-A0FL-01 | Breast | breast invasive carcinoma | Female | <65 | I/II | Unknown | Unknown | SD | |
| AMBRA1 | SNV | Missense_Mutation | c.3088N>T | p.Leu1030Phe | p.L1030F | Q9C0C7 | protein_coding | deleterious_low_confidence(0) | probably_damaging(0.997) | TCGA-AN-A0FW-01 | Breast | breast invasive carcinoma | Female | >=65 | III/IV | Unknown | Unknown | SD | |
| AMBRA1 | SNV | Missense_Mutation | c.3428C>A | p.Thr1143Asn | p.T1143N | Q9C0C7 | protein_coding | tolerated_low_confidence(0.22) | benign(0.25) | TCGA-AR-A1AH-01 | Breast | breast invasive carcinoma | Female | <65 | I/II | Unspecific | PD | ||
| AMBRA1 | SNV | Missense_Mutation | novel | c.1648A>C | p.Thr550Pro | p.T550P | Q9C0C7 | protein_coding | tolerated_low_confidence(0.12) | benign(0.003) | TCGA-BH-A0WA-01 | Breast | breast invasive carcinoma | Female | >=65 | I/II | Unknown | Unknown | SD |
| AMBRA1 | insertion | Nonsense_Mutation | novel | c.1877_1878insAGAGATAGGATAGG | p.Pro627GlufsTer4 | p.P627Efs*4 | Q9C0C7 | protein_coding | TCGA-A7-A0CJ-01 | Breast | breast invasive carcinoma | Female | <65 | I/II | Chemotherapy | cytoxan | SD | ||
| AMBRA1 | insertion | In_Frame_Ins | novel | c.1876_1877insATCTTGCTCTGGTGG | p.Thr626delinsAsnLeuAlaLeuValAla | p.T626delinsNLALVA | Q9C0C7 | protein_coding | TCGA-A7-A0CJ-01 | Breast | breast invasive carcinoma | Female | <65 | I/II | Chemotherapy | cytoxan | SD | ||
| AMBRA1 | deletion | Frame_Shift_Del | c.3585delN | p.Ile1196PhefsTer17 | p.I1196Ffs*17 | Q9C0C7 | protein_coding | TCGA-A8-A075-01 | Breast | breast invasive carcinoma | Female | <65 | I/II | Chemotherapy | epirubicin | CR | |||
| AMBRA1 | insertion | Nonsense_Mutation | novel | c.2822_2823insCTAAGCCTAGCCTGCTCAGGCTGCTCTTGGAGCTG | p.Met941IlefsTer2 | p.M941Ifs*2 | Q9C0C7 | protein_coding | TCGA-A8-A09D-01 | Breast | breast invasive carcinoma | Female | <65 | I/II | Chemotherapy | doxorubicin | CR | ||
| AMBRA1 | insertion | Frame_Shift_Ins | novel | c.1861_1862insATATATGTAT | p.Arg621HisfsTer6 | p.R621Hfs*6 | Q9C0C7 | protein_coding | TCGA-A8-A09X-01 | Breast | breast invasive carcinoma | Female | <65 | III/IV | Unknown | Unknown | SD | ||
| AMBRA1 | insertion | Frame_Shift_Ins | novel | c.1860_1861insAAAAAAAAATA | p.Arg621LysfsTer18 | p.R621Kfs*18 | Q9C0C7 | protein_coding | TCGA-A8-A09X-01 | Breast | breast invasive carcinoma | Female | <65 | III/IV | Unknown | Unknown | SD |
| Page: 1 2 3 4 5 6 7 8 9 10 11 12 13 14 |
Top |
Related drugs of malignant transformation related genes |
| Identification of chemicals and drugs interact with genes involved in malignant transfromation |
| (DGIdb 4.0) |
| Entrez ID | Symbol | Category | Interaction Types | Drug Claim Name | Drug Name | PMIDs |
| Page: 1 |

Copyright 2023-Present -The University of Texas Health Science Center at Houston |