
|
|||||
|
 | |
| |
| |
| |
| |
| |
|
Gene: ALYREF |
Gene summary for ALYREF |
| Gene information | Species | Human | Gene symbol | ALYREF | Gene ID | 10189 |
| Gene name | Aly/REF export factor | |
| Gene Alias | ALY | |
| Cytomap | 17q25.3 | |
| Gene Type | protein-coding | GO ID | GO:0000018 | UniProtAcc | E9PB61 |
Top |
Malignant transformation analysis |
| Identification of the aberrant gene expression in precancerous and cancerous lesions by comparing the gene expression of stem-like cells in diseased tissues with normal stem cells |
| Entrez ID | Symbol | Replicates | Species | Organ | Tissue | Adj P-value | Log2FC | Malignancy |
| 10189 | ALYREF | HTA11_2487_2000001011 | Human | Colorectum | SER | 5.80e-07 | 2.20e-01 | -0.1808 |
| 10189 | ALYREF | HTA11_1938_2000001011 | Human | Colorectum | AD | 3.85e-14 | 4.77e-01 | -0.0811 |
| 10189 | ALYREF | HTA11_78_2000001011 | Human | Colorectum | AD | 6.11e-04 | 1.33e-01 | -0.1088 |
| 10189 | ALYREF | HTA11_347_2000001011 | Human | Colorectum | AD | 1.11e-09 | 2.32e-01 | -0.1954 |
| 10189 | ALYREF | HTA11_3361_2000001011 | Human | Colorectum | AD | 1.09e-06 | 3.17e-01 | -0.1207 |
| 10189 | ALYREF | HTA11_83_2000001011 | Human | Colorectum | SER | 2.04e-02 | 1.36e-01 | -0.1526 |
| 10189 | ALYREF | HTA11_696_2000001011 | Human | Colorectum | AD | 1.74e-10 | 3.14e-01 | -0.1464 |
| 10189 | ALYREF | HTA11_866_2000001011 | Human | Colorectum | AD | 6.14e-04 | 1.76e-01 | -0.1001 |
| 10189 | ALYREF | HTA11_1391_2000001011 | Human | Colorectum | AD | 3.99e-16 | 4.02e-01 | -0.059 |
| 10189 | ALYREF | HTA11_2992_2000001011 | Human | Colorectum | SER | 2.14e-07 | 3.66e-01 | -0.1706 |
| 10189 | ALYREF | HTA11_7862_2000001011 | Human | Colorectum | AD | 2.47e-08 | 2.92e-01 | -0.0179 |
| 10189 | ALYREF | HTA11_866_3004761011 | Human | Colorectum | AD | 1.85e-21 | 4.78e-01 | 0.096 |
| 10189 | ALYREF | HTA11_4255_2000001011 | Human | Colorectum | SER | 3.40e-02 | 2.39e-01 | 0.0446 |
| 10189 | ALYREF | HTA11_8622_2000001021 | Human | Colorectum | SER | 1.13e-05 | 2.34e-01 | 0.0528 |
| 10189 | ALYREF | HTA11_10623_2000001011 | Human | Colorectum | AD | 2.05e-04 | 1.94e-01 | -0.0177 |
| 10189 | ALYREF | HTA11_6801_2000001011 | Human | Colorectum | SER | 3.07e-13 | 7.02e-01 | 0.0171 |
| 10189 | ALYREF | HTA11_10711_2000001011 | Human | Colorectum | AD | 1.91e-07 | 2.27e-01 | 0.0338 |
| 10189 | ALYREF | HTA11_7696_3000711011 | Human | Colorectum | AD | 2.20e-16 | 3.95e-01 | 0.0674 |
| 10189 | ALYREF | HTA11_7469_2000001011 | Human | Colorectum | AD | 2.51e-08 | 4.42e-01 | -0.0124 |
| 10189 | ALYREF | HTA11_6818_2000001021 | Human | Colorectum | AD | 1.54e-06 | 2.06e-01 | 0.0588 |
| Page: 1 2 3 4 5 6 |
| Tissue | Expression Dynamics | Abbreviation |
| Colorectum (GSE201348) |  | FAP: Familial adenomatous polyposis |
| CRC: Colorectal cancer | ||
| Colorectum (HTA11) |  | AD: Adenomas |
| SER: Sessile serrated lesions | ||
| MSI-H: Microsatellite-high colorectal cancer | ||
| MSS: Microsatellite stable colorectal cancer | ||
| Esophagus | 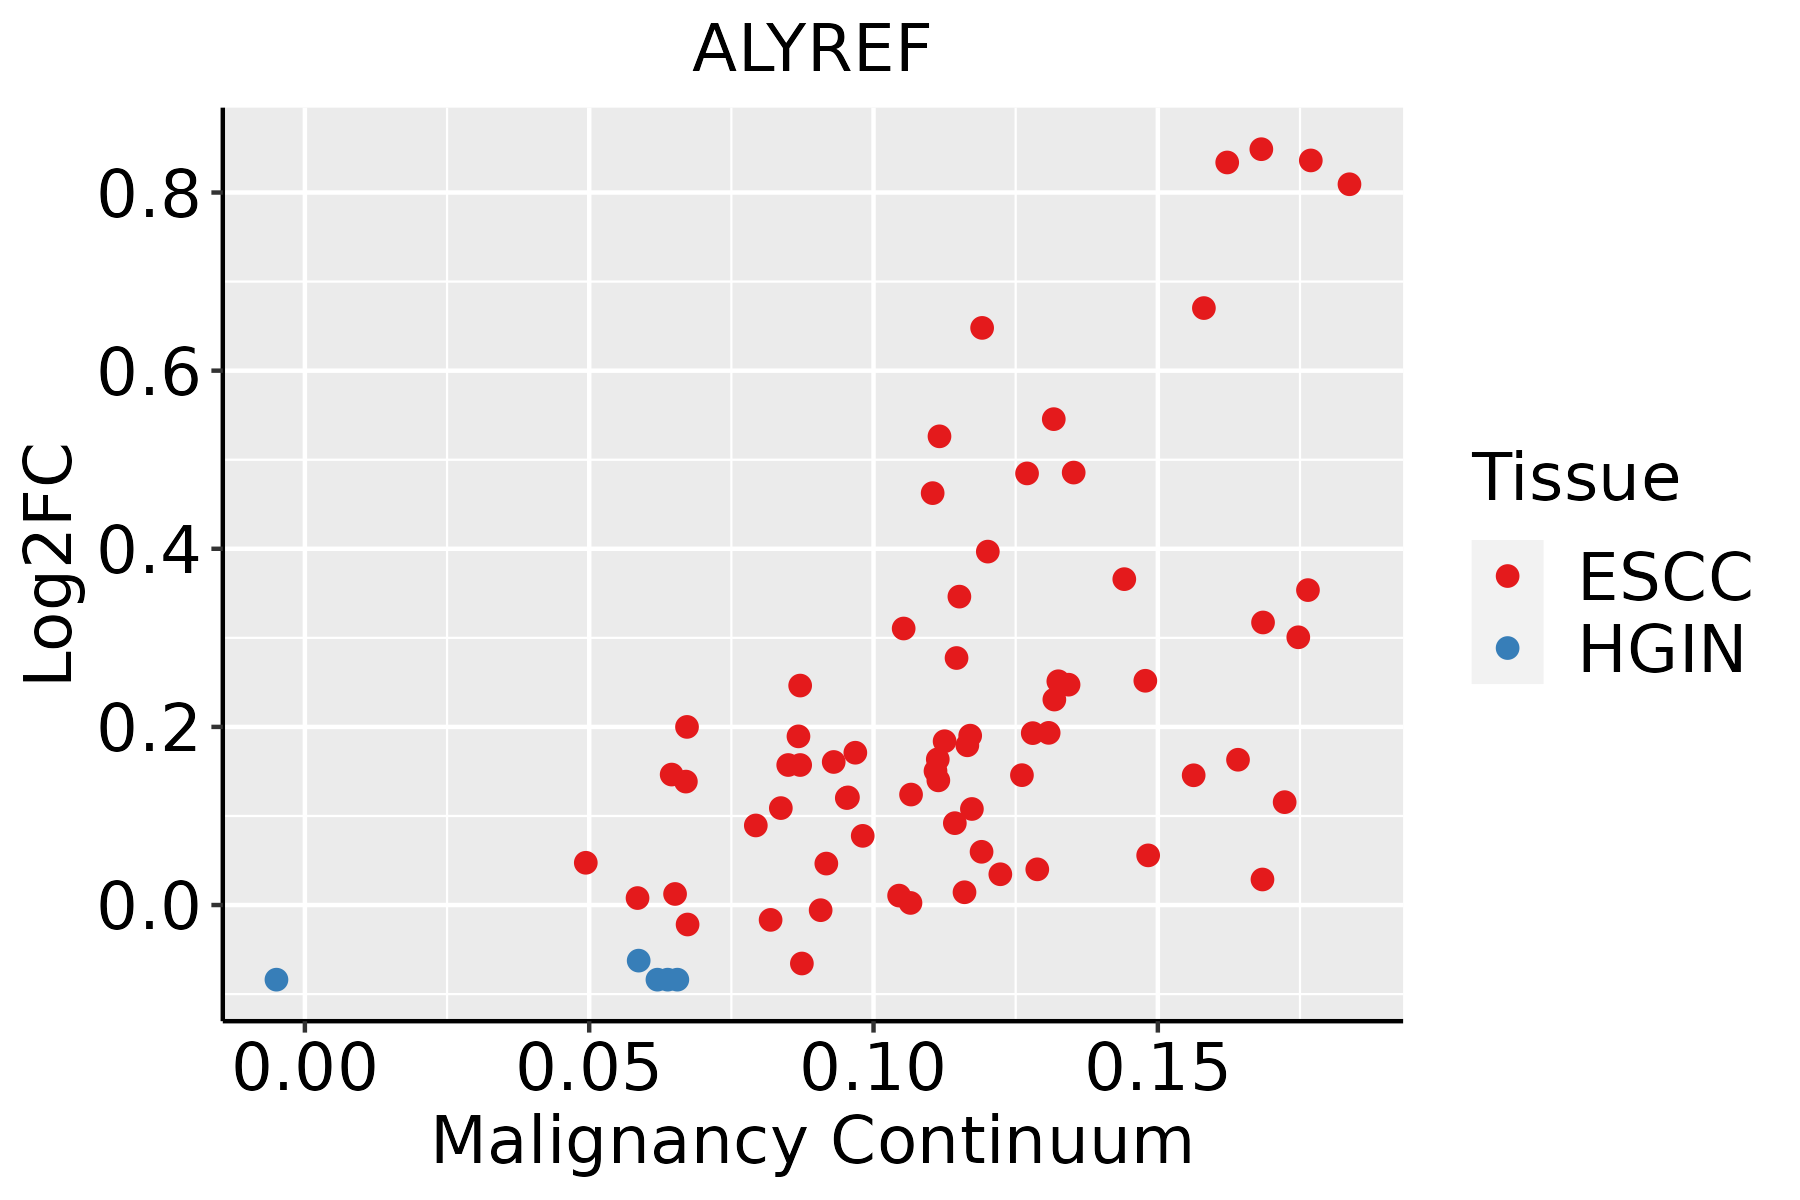 | ESCC: Esophageal squamous cell carcinoma |
| HGIN: High-grade intraepithelial neoplasias | ||
| LGIN: Low-grade intraepithelial neoplasias | ||
| Liver | 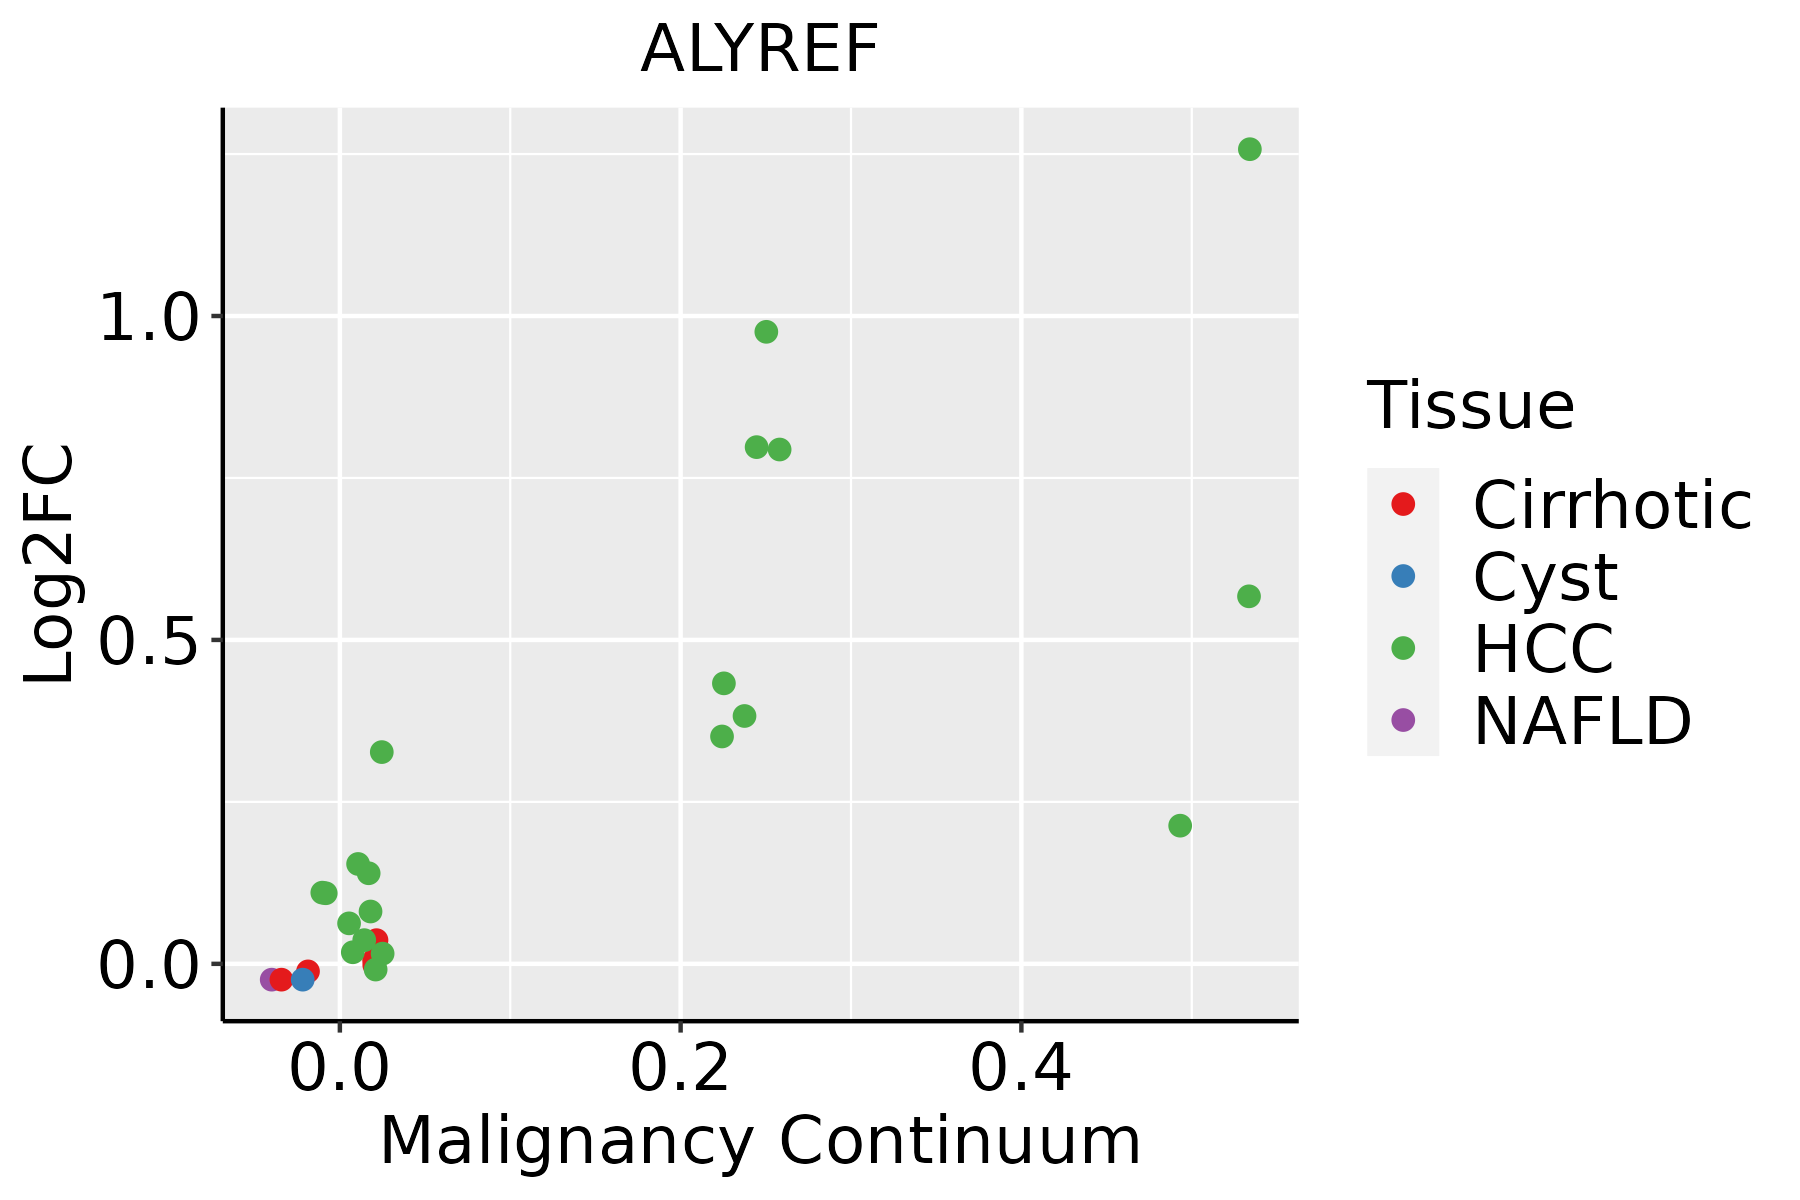 | HCC: Hepatocellular carcinoma |
| NAFLD: Non-alcoholic fatty liver disease | ||
| Oral Cavity | 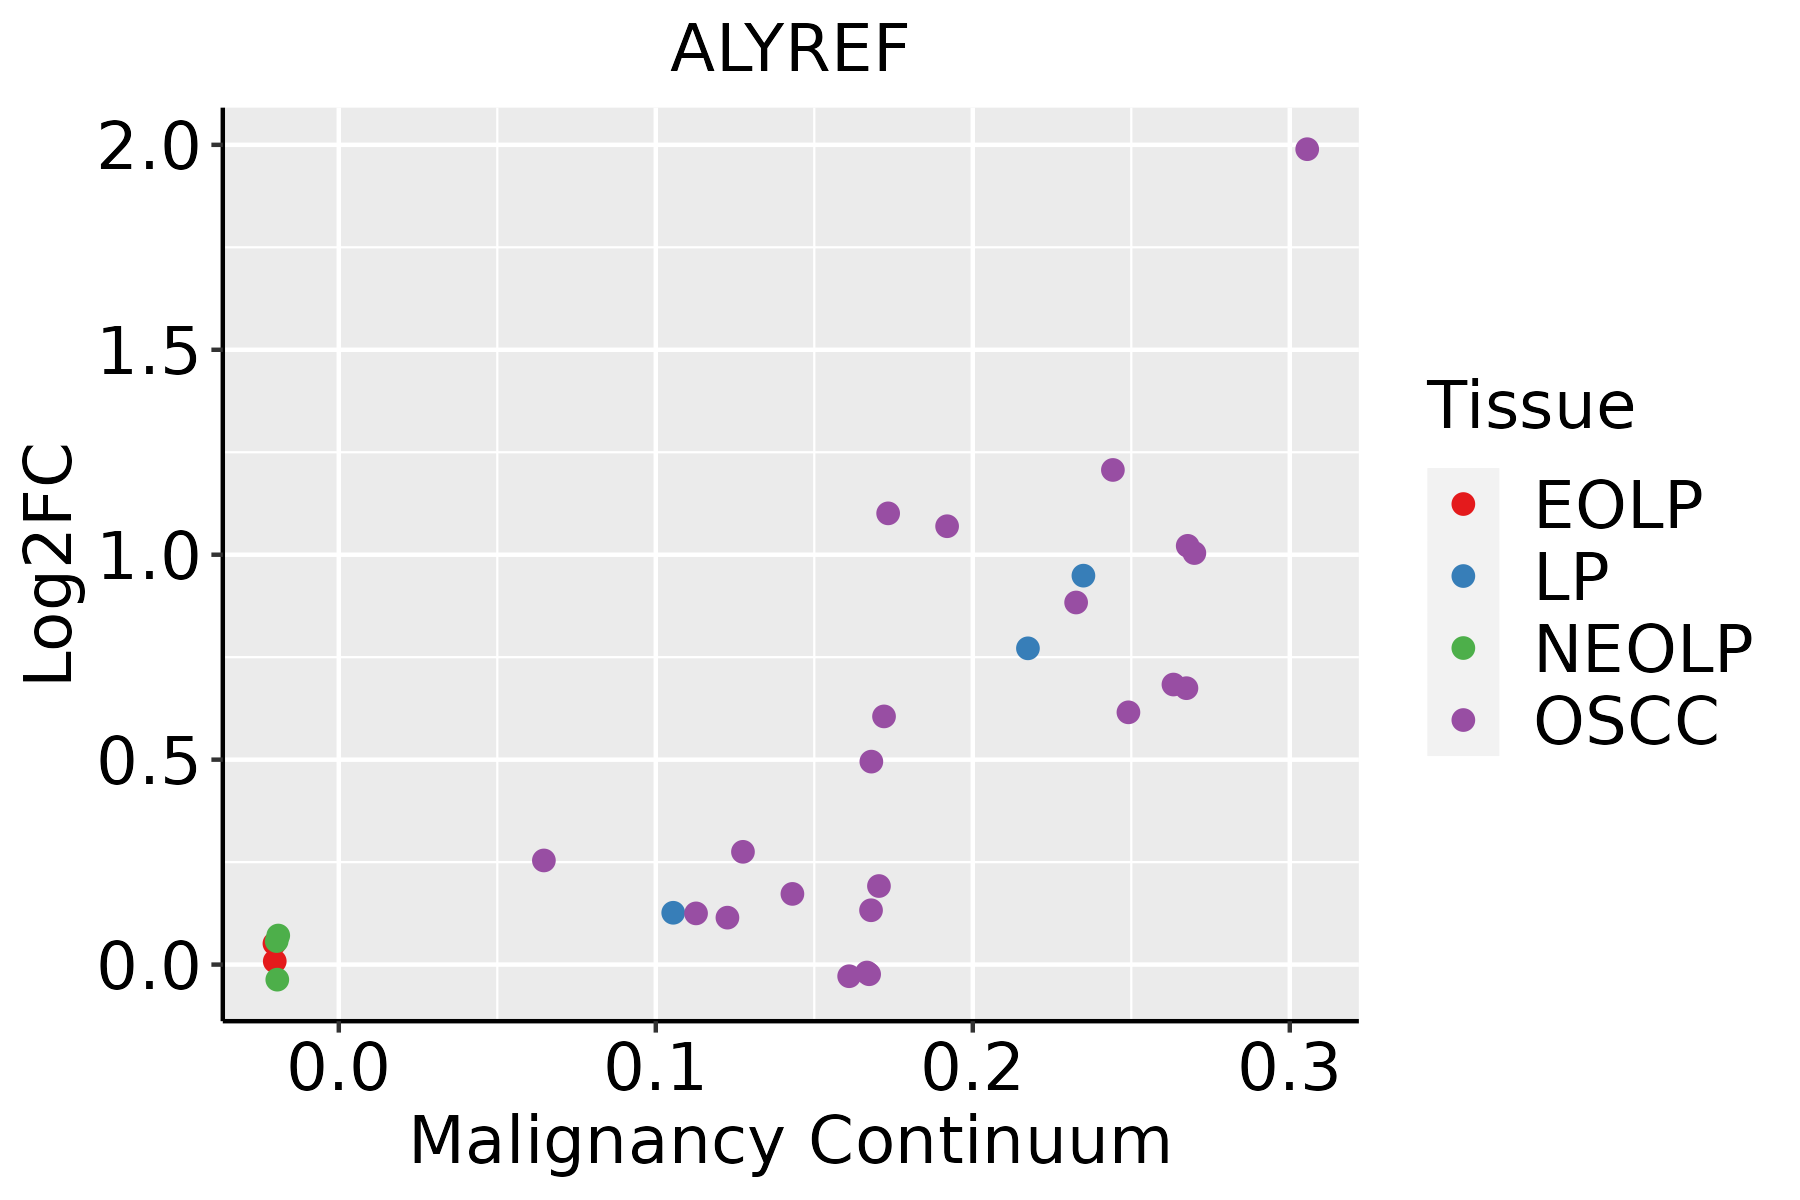 | EOLP: Erosive Oral lichen planus |
| LP: leukoplakia | ||
| NEOLP: Non-erosive oral lichen planus | ||
| OSCC: Oral squamous cell carcinoma | ||
| Skin |  | AK: Actinic keratosis |
| cSCC: Cutaneous squamous cell carcinoma | ||
| SCCIS:squamous cell carcinoma in situ | ||
| Thyroid | 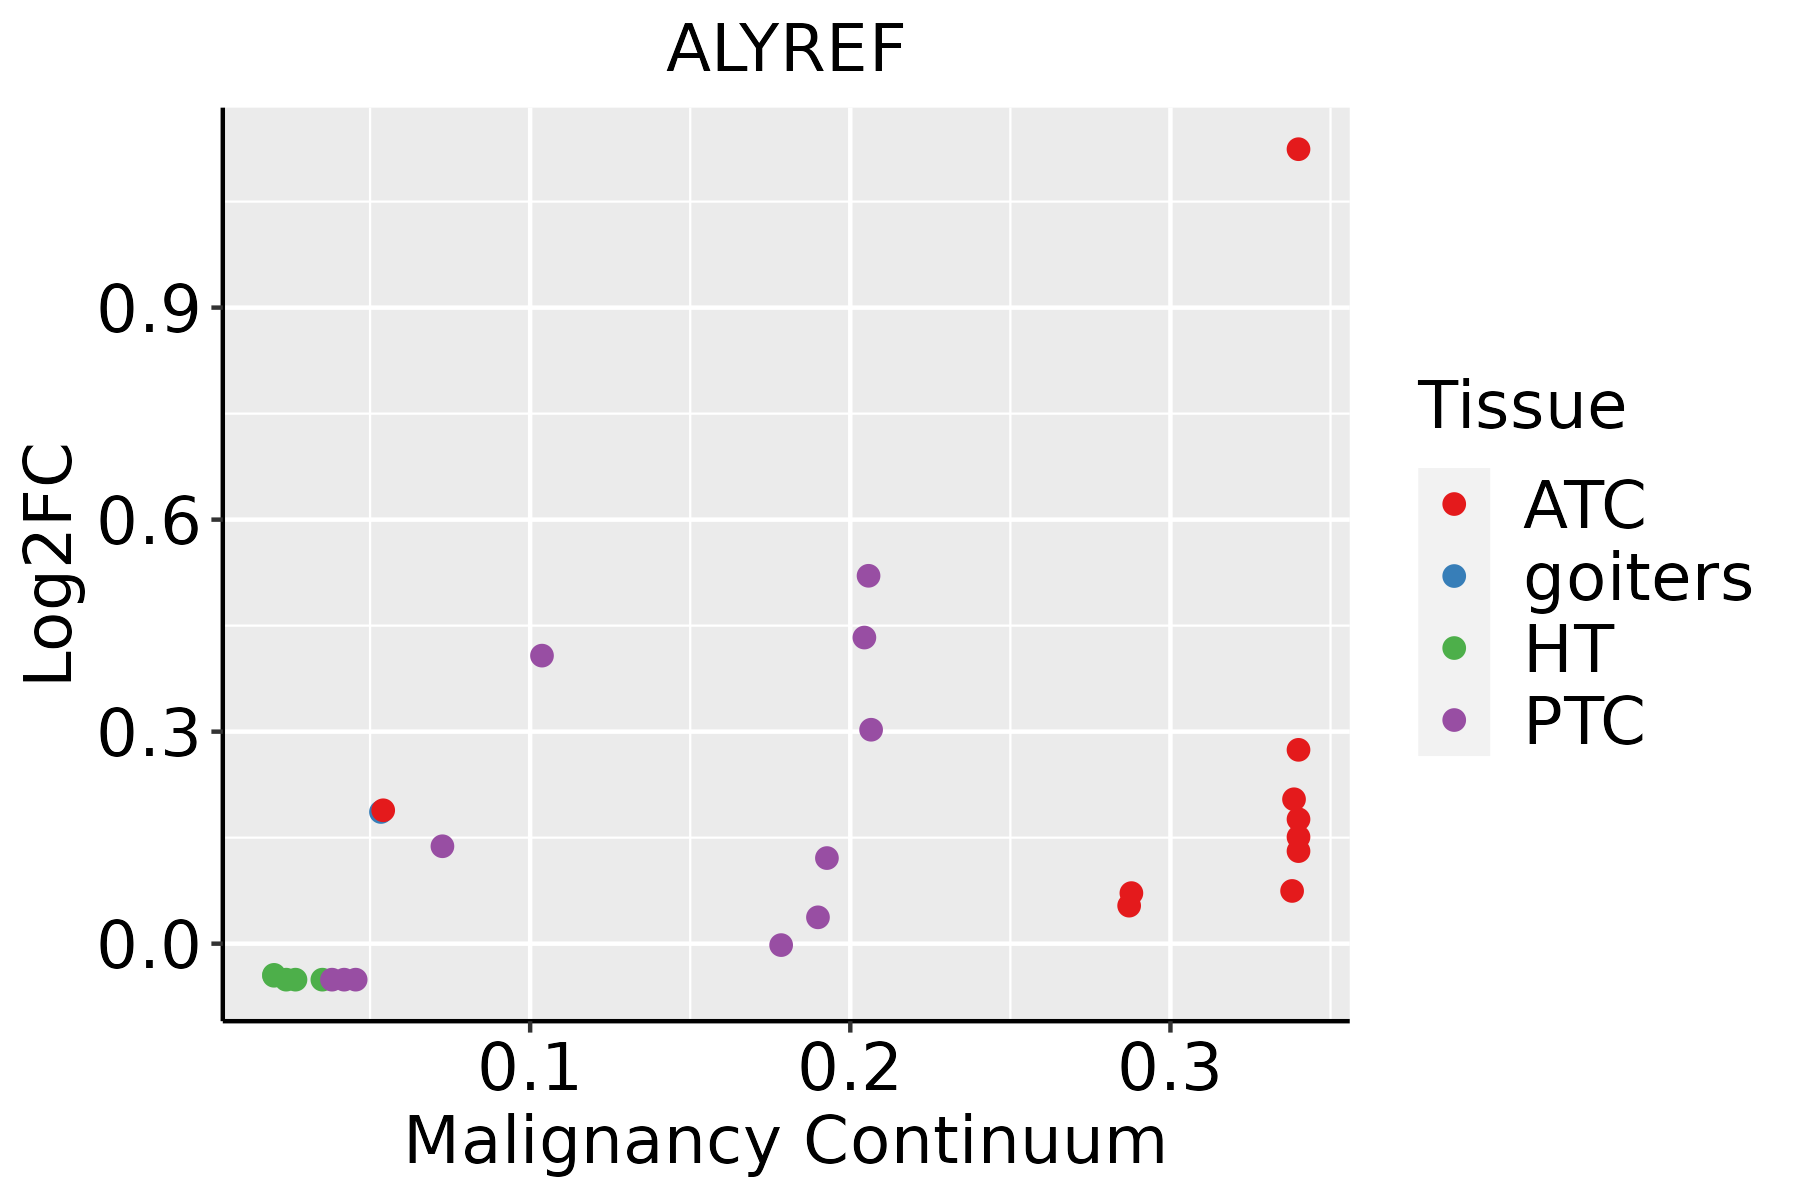 | ATC: Anaplastic thyroid cancer |
| HT: Hashimoto's thyroiditis | ||
| PTC: Papillary thyroid cancer |
| ∗log2FC in expression of this searched gene in stem-like cells from each diseased tissue sample relative to stem-like cells in normal samples in each tissue plotted against the malignancy continuum. Samples are colored based on if they are from different disease stage. |
Top |
Malignant transformation related pathway analysis |
| Find out the enriched GO biological processes and KEGG pathways involved in transition from healthy to precancer to cancer |
| Tissue | Disease Stage | Enriched GO biological Processes |
| Colorectum | AD |  |
| Colorectum | SER |  |
| Colorectum | MSS |  |
| Colorectum | MSI-H |  |
| Colorectum | FAP |  |
| ∗Top 15 enriched GO BP terms are showed in the bar plot of each disease state in each tissue. Each row represents a significant GO biological process which is colored according to the -log10(p.adjust). |
| Page: 1 2 3 4 5 6 7 8 9 |
| GO ID | Tissue | Disease Stage | Description | Gene Ratio | Bg Ratio | pvalue | p.adjust | Count |
| GO:0008380 | Colorectum | AD | RNA splicing | 169/3918 | 434/18723 | 3.59e-18 | 2.04e-15 | 169 |
| GO:0000377 | Colorectum | AD | RNA splicing, via transesterification reactions with bulged adenosine as nucleophile | 130/3918 | 320/18723 | 5.88e-16 | 2.16e-13 | 130 |
| GO:0000398 | Colorectum | AD | mRNA splicing, via spliceosome | 130/3918 | 320/18723 | 5.88e-16 | 2.16e-13 | 130 |
| GO:0000375 | Colorectum | AD | RNA splicing, via transesterification reactions | 131/3918 | 324/18723 | 7.11e-16 | 2.22e-13 | 131 |
| GO:0006913 | Colorectum | AD | nucleocytoplasmic transport | 102/3918 | 301/18723 | 1.00e-07 | 4.85e-06 | 102 |
| GO:0051169 | Colorectum | AD | nuclear transport | 102/3918 | 301/18723 | 1.00e-07 | 4.85e-06 | 102 |
| GO:0044403 | Colorectum | AD | biological process involved in symbiotic interaction | 99/3918 | 290/18723 | 1.02e-07 | 4.93e-06 | 99 |
| GO:0051052 | Colorectum | AD | regulation of DNA metabolic process | 116/3918 | 359/18723 | 2.47e-07 | 1.00e-05 | 116 |
| GO:0051701 | Colorectum | AD | biological process involved in interaction with host | 73/3918 | 203/18723 | 5.08e-07 | 1.88e-05 | 73 |
| GO:0006403 | Colorectum | AD | RNA localization | 71/3918 | 201/18723 | 1.54e-06 | 4.76e-05 | 71 |
| GO:0051236 | Colorectum | AD | establishment of RNA localization | 58/3918 | 166/18723 | 1.95e-05 | 4.01e-04 | 58 |
| GO:0015931 | Colorectum | AD | nucleobase-containing compound transport | 73/3918 | 222/18723 | 2.02e-05 | 4.10e-04 | 73 |
| GO:0050657 | Colorectum | AD | nucleic acid transport | 57/3918 | 163/18723 | 2.22e-05 | 4.39e-04 | 57 |
| GO:0050658 | Colorectum | AD | RNA transport | 57/3918 | 163/18723 | 2.22e-05 | 4.39e-04 | 57 |
| GO:0051168 | Colorectum | AD | nuclear export | 53/3918 | 154/18723 | 6.89e-05 | 1.11e-03 | 53 |
| GO:0001649 | Colorectum | AD | osteoblast differentiation | 70/3918 | 229/18723 | 3.59e-04 | 4.18e-03 | 70 |
| GO:0032786 | Colorectum | AD | positive regulation of DNA-templated transcription, elongation | 13/3918 | 27/18723 | 1.47e-03 | 1.25e-02 | 13 |
| GO:0051028 | Colorectum | AD | mRNA transport | 42/3918 | 130/18723 | 1.57e-03 | 1.32e-02 | 42 |
| GO:0006354 | Colorectum | AD | DNA-templated transcription, elongation | 31/3918 | 91/18723 | 2.46e-03 | 1.90e-02 | 31 |
| GO:0001503 | Colorectum | AD | ossification | 106/3918 | 408/18723 | 7.68e-03 | 4.64e-02 | 106 |
| Page: 1 2 3 4 5 6 7 8 9 10 11 12 13 14 15 16 |
| Pathway ID | Tissue | Disease Stage | Description | Gene Ratio | Bg Ratio | pvalue | p.adjust | qvalue | Count |
| hsa05014 | Colorectum | AD | Amyotrophic lateral sclerosis | 164/2092 | 364/8465 | 4.28e-18 | 1.27e-16 | 8.09e-17 | 164 |
| hsa03040 | Colorectum | AD | Spliceosome | 73/2092 | 217/8465 | 1.73e-03 | 9.68e-03 | 6.18e-03 | 73 |
| hsa03015 | Colorectum | AD | mRNA surveillance pathway | 35/2092 | 97/8465 | 7.95e-03 | 3.13e-02 | 2.00e-02 | 35 |
| hsa050141 | Colorectum | AD | Amyotrophic lateral sclerosis | 164/2092 | 364/8465 | 4.28e-18 | 1.27e-16 | 8.09e-17 | 164 |
| hsa030401 | Colorectum | AD | Spliceosome | 73/2092 | 217/8465 | 1.73e-03 | 9.68e-03 | 6.18e-03 | 73 |
| hsa030151 | Colorectum | AD | mRNA surveillance pathway | 35/2092 | 97/8465 | 7.95e-03 | 3.13e-02 | 2.00e-02 | 35 |
| hsa050142 | Colorectum | SER | Amyotrophic lateral sclerosis | 138/1580 | 364/8465 | 9.89e-19 | 2.99e-17 | 2.17e-17 | 138 |
| hsa050143 | Colorectum | SER | Amyotrophic lateral sclerosis | 138/1580 | 364/8465 | 9.89e-19 | 2.99e-17 | 2.17e-17 | 138 |
| hsa050144 | Colorectum | MSS | Amyotrophic lateral sclerosis | 156/1875 | 364/8465 | 1.43e-19 | 4.62e-18 | 2.83e-18 | 156 |
| hsa050145 | Colorectum | MSS | Amyotrophic lateral sclerosis | 156/1875 | 364/8465 | 1.43e-19 | 4.62e-18 | 2.83e-18 | 156 |
| hsa050146 | Colorectum | MSI-H | Amyotrophic lateral sclerosis | 95/797 | 364/8465 | 2.31e-21 | 1.50e-19 | 1.26e-19 | 95 |
| hsa050147 | Colorectum | MSI-H | Amyotrophic lateral sclerosis | 95/797 | 364/8465 | 2.31e-21 | 1.50e-19 | 1.26e-19 | 95 |
| hsa05014210 | Esophagus | ESCC | Amyotrophic lateral sclerosis | 266/4205 | 364/8465 | 1.31e-20 | 2.20e-18 | 1.13e-18 | 266 |
| hsa0301321 | Esophagus | ESCC | Nucleocytoplasmic transport | 89/4205 | 108/8465 | 1.20e-12 | 2.37e-11 | 1.21e-11 | 89 |
| hsa0301524 | Esophagus | ESCC | mRNA surveillance pathway | 72/4205 | 97/8465 | 6.12e-07 | 4.10e-06 | 2.10e-06 | 72 |
| hsa0304027 | Esophagus | ESCC | Spliceosome | 128/4205 | 217/8465 | 3.31e-03 | 8.79e-03 | 4.50e-03 | 128 |
| hsa0501438 | Esophagus | ESCC | Amyotrophic lateral sclerosis | 266/4205 | 364/8465 | 1.31e-20 | 2.20e-18 | 1.13e-18 | 266 |
| hsa0301331 | Esophagus | ESCC | Nucleocytoplasmic transport | 89/4205 | 108/8465 | 1.20e-12 | 2.37e-11 | 1.21e-11 | 89 |
| hsa0301534 | Esophagus | ESCC | mRNA surveillance pathway | 72/4205 | 97/8465 | 6.12e-07 | 4.10e-06 | 2.10e-06 | 72 |
| hsa0304037 | Esophagus | ESCC | Spliceosome | 128/4205 | 217/8465 | 3.31e-03 | 8.79e-03 | 4.50e-03 | 128 |
| Page: 1 2 3 |
Top |
Cell-cell communication analysis |
| Identification of potential cell-cell interactions between two cell types and their ligand-receptor pairs for different disease states |
| Ligand | Receptor | LRpair | Pathway | Tissue | Disease Stage |
| Page: 1 |
Top |
Single-cell gene regulatory network inference analysis |
| Find out the significant the regulons (TFs) and the target genes of each regulon across cell types for different disease states |
| TF | Cell Type | Tissue | Disease Stage | Target Gene | RSS | Regulon Activity |
| ∗The dot plots of a searched regulon are shown for all cell subpopulations in each disease state of each tissue based on the regulon specific score inferred using pySCENIC and by calculating the average expression. |
| Page: 1 |
Top |
Somatic mutation of malignant transformation related genes |
| Annotation of somatic variants for genes involved in malignant transformation |
| Hugo Symbol | Variant Class | Variant Classification | dbSNP RS | HGVSc | HGVSp | HGVSp Short | SWISSPROT | BIOTYPE | SIFT | PolyPhen | Tumor Sample Barcode | Tissue | Histology | Sex | Age | Stage | Therapy Types | Drugs | Outcome |
| ALYREF | insertion | In_Frame_Ins | novel | c.496_497insATG | p.Asp165dup | p.D165dup | protein_coding | TCGA-BH-A0BZ-01 | Breast | breast invasive carcinoma | Female | <65 | III/IV | Chemotherapy | doxorubicin | CR | |||
| ALYREF | SNV | Missense_Mutation | novel | c.626N>C | p.Arg209Thr | p.R209T | protein_coding | tolerated(0.34) | benign(0.028) | TCGA-EA-A78R-01 | Cervix | cervical & endocervical cancer | Female | <65 | I/II | Unknown | Unknown | SD | |
| ALYREF | SNV | Missense_Mutation | c.526G>A | p.Val176Ile | p.V176I | protein_coding | tolerated(0.11) | possibly_damaging(0.516) | TCGA-AA-3821-01 | Colorectum | colon adenocarcinoma | Female | >=65 | I/II | Unknown | Unknown | SD | ||
| ALYREF | SNV | Missense_Mutation | novel | c.535G>C | p.Asp179His | p.D179H | protein_coding | deleterious(0) | probably_damaging(0.994) | TCGA-G4-6295-01 | Colorectum | colon adenocarcinoma | Female | >=65 | I/II | Unknown | Unknown | SD | |
| ALYREF | SNV | Missense_Mutation | c.712G>A | p.Gly238Ser | p.G238S | protein_coding | tolerated(0.12) | possibly_damaging(0.576) | TCGA-EI-6508-01 | Colorectum | rectum adenocarcinoma | Female | <65 | III/IV | Chemotherapy | oxaliplatin | SD | ||
| ALYREF | SNV | Missense_Mutation | novel | c.353N>T | p.Ser118Phe | p.S118F | protein_coding | deleterious(0) | probably_damaging(0.99) | TCGA-4E-A92E-01 | Endometrium | uterine corpus endometrioid carcinoma | Female | <65 | I/II | Unknown | Unknown | SD | |
| ALYREF | SNV | Missense_Mutation | novel | c.413N>T | p.Thr138Met | p.T138M | protein_coding | deleterious(0.02) | possibly_damaging(0.82) | TCGA-AJ-A3NE-01 | Endometrium | uterine corpus endometrioid carcinoma | Female | <65 | I/II | Unknown | Unknown | SD | |
| ALYREF | SNV | Missense_Mutation | novel | c.428N>T | p.Ala143Val | p.A143V | protein_coding | deleterious(0) | possibly_damaging(0.871) | TCGA-AP-A054-01 | Endometrium | uterine corpus endometrioid carcinoma | Female | <65 | III/IV | Chemotherapy | carboplatin | PD | |
| ALYREF | SNV | Missense_Mutation | rs781729860 | c.586N>T | p.Arg196Trp | p.R196W | protein_coding | deleterious(0.05) | probably_damaging(0.983) | TCGA-AP-A059-01 | Endometrium | uterine corpus endometrioid carcinoma | Female | >=65 | I/II | Unknown | Unknown | SD | |
| ALYREF | SNV | Missense_Mutation | novel | c.575N>G | p.Ile192Ser | p.I192S | protein_coding | deleterious(0) | benign(0.048) | TCGA-AP-A1DM-01 | Endometrium | uterine corpus endometrioid carcinoma | Female | <65 | I/II | Unknown | Unknown | SD |
| Page: 1 2 3 |
Top |
Related drugs of malignant transformation related genes |
| Identification of chemicals and drugs interact with genes involved in malignant transfromation |
| (DGIdb 4.0) |
| Entrez ID | Symbol | Category | Interaction Types | Drug Claim Name | Drug Name | PMIDs |
| Page: 1 |

Copyright 2023-Present -The University of Texas Health Science Center at Houston |