
|
|||||
|
 | |
| |
| |
| |
| |
| |
|
Gene: ALS2CL |
Gene summary for ALS2CL |
| Gene information | Species | Human | Gene symbol | ALS2CL | Gene ID | 259173 |
| Gene name | ALS2 C-terminal like | |
| Gene Alias | RN49018 | |
| Cytomap | 3p21.31 | |
| Gene Type | protein-coding | GO ID | GO:0006996 | UniProtAcc | A0A024R2U1 |
Top |
Malignant transformation analysis |
| Identification of the aberrant gene expression in precancerous and cancerous lesions by comparing the gene expression of stem-like cells in diseased tissues with normal stem cells |
| Entrez ID | Symbol | Replicates | Species | Organ | Tissue | Adj P-value | Log2FC | Malignancy |
| 259173 | ALS2CL | HCC1_Meng | Human | Liver | HCC | 2.23e-03 | -6.64e-03 | 0.0246 |
| 259173 | ALS2CL | HCC2_Meng | Human | Liver | HCC | 1.38e-08 | 7.06e-02 | 0.0107 |
| 259173 | ALS2CL | HCC2 | Human | Liver | HCC | 2.74e-08 | 2.52e+00 | 0.5341 |
| 259173 | ALS2CL | S027 | Human | Liver | HCC | 1.31e-09 | 5.67e-01 | 0.2446 |
| 259173 | ALS2CL | S028 | Human | Liver | HCC | 3.22e-17 | 5.30e-01 | 0.2503 |
| 259173 | ALS2CL | S029 | Human | Liver | HCC | 1.83e-12 | 6.08e-01 | 0.2581 |
| 259173 | ALS2CL | C04 | Human | Oral cavity | OSCC | 2.50e-03 | 2.76e-01 | 0.2633 |
| 259173 | ALS2CL | C21 | Human | Oral cavity | OSCC | 3.06e-06 | 2.58e-01 | 0.2678 |
| 259173 | ALS2CL | C30 | Human | Oral cavity | OSCC | 1.28e-12 | 7.11e-01 | 0.3055 |
| 259173 | ALS2CL | C51 | Human | Oral cavity | OSCC | 2.58e-09 | 3.66e-01 | 0.2674 |
| 259173 | ALS2CL | C57 | Human | Oral cavity | OSCC | 8.11e-04 | 2.42e-01 | 0.1679 |
| 259173 | ALS2CL | C06 | Human | Oral cavity | OSCC | 3.71e-02 | 5.79e-01 | 0.2699 |
| 259173 | ALS2CL | SYSMH1 | Human | Oral cavity | OSCC | 9.73e-03 | 7.82e-02 | 0.1127 |
| 259173 | ALS2CL | SYSMH2 | Human | Oral cavity | OSCC | 1.32e-07 | 2.16e-01 | 0.2326 |
| 259173 | ALS2CL | SYSMH3 | Human | Oral cavity | OSCC | 9.89e-10 | 3.14e-01 | 0.2442 |
| Page: 1 |
| Tissue | Expression Dynamics | Abbreviation |
| Liver | 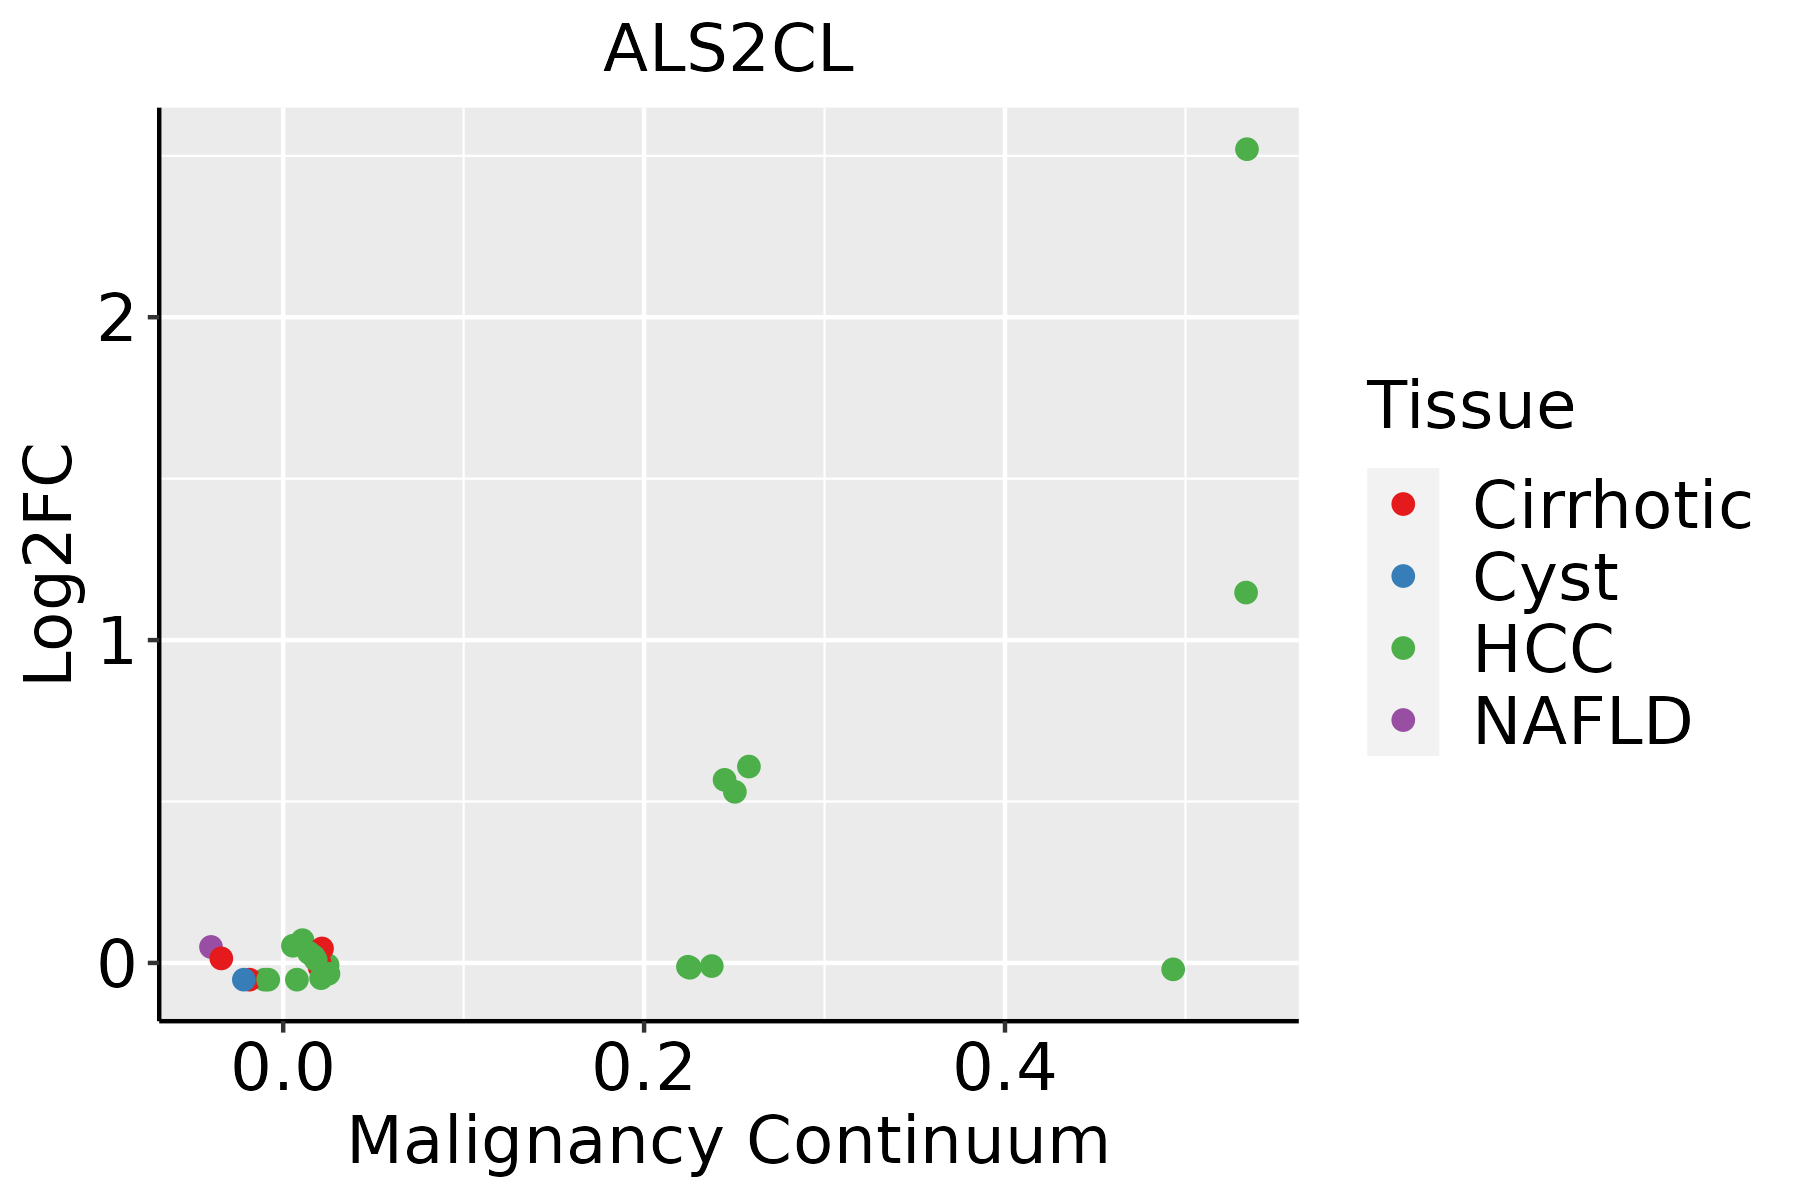 | HCC: Hepatocellular carcinoma |
| NAFLD: Non-alcoholic fatty liver disease | ||
| Oral Cavity | 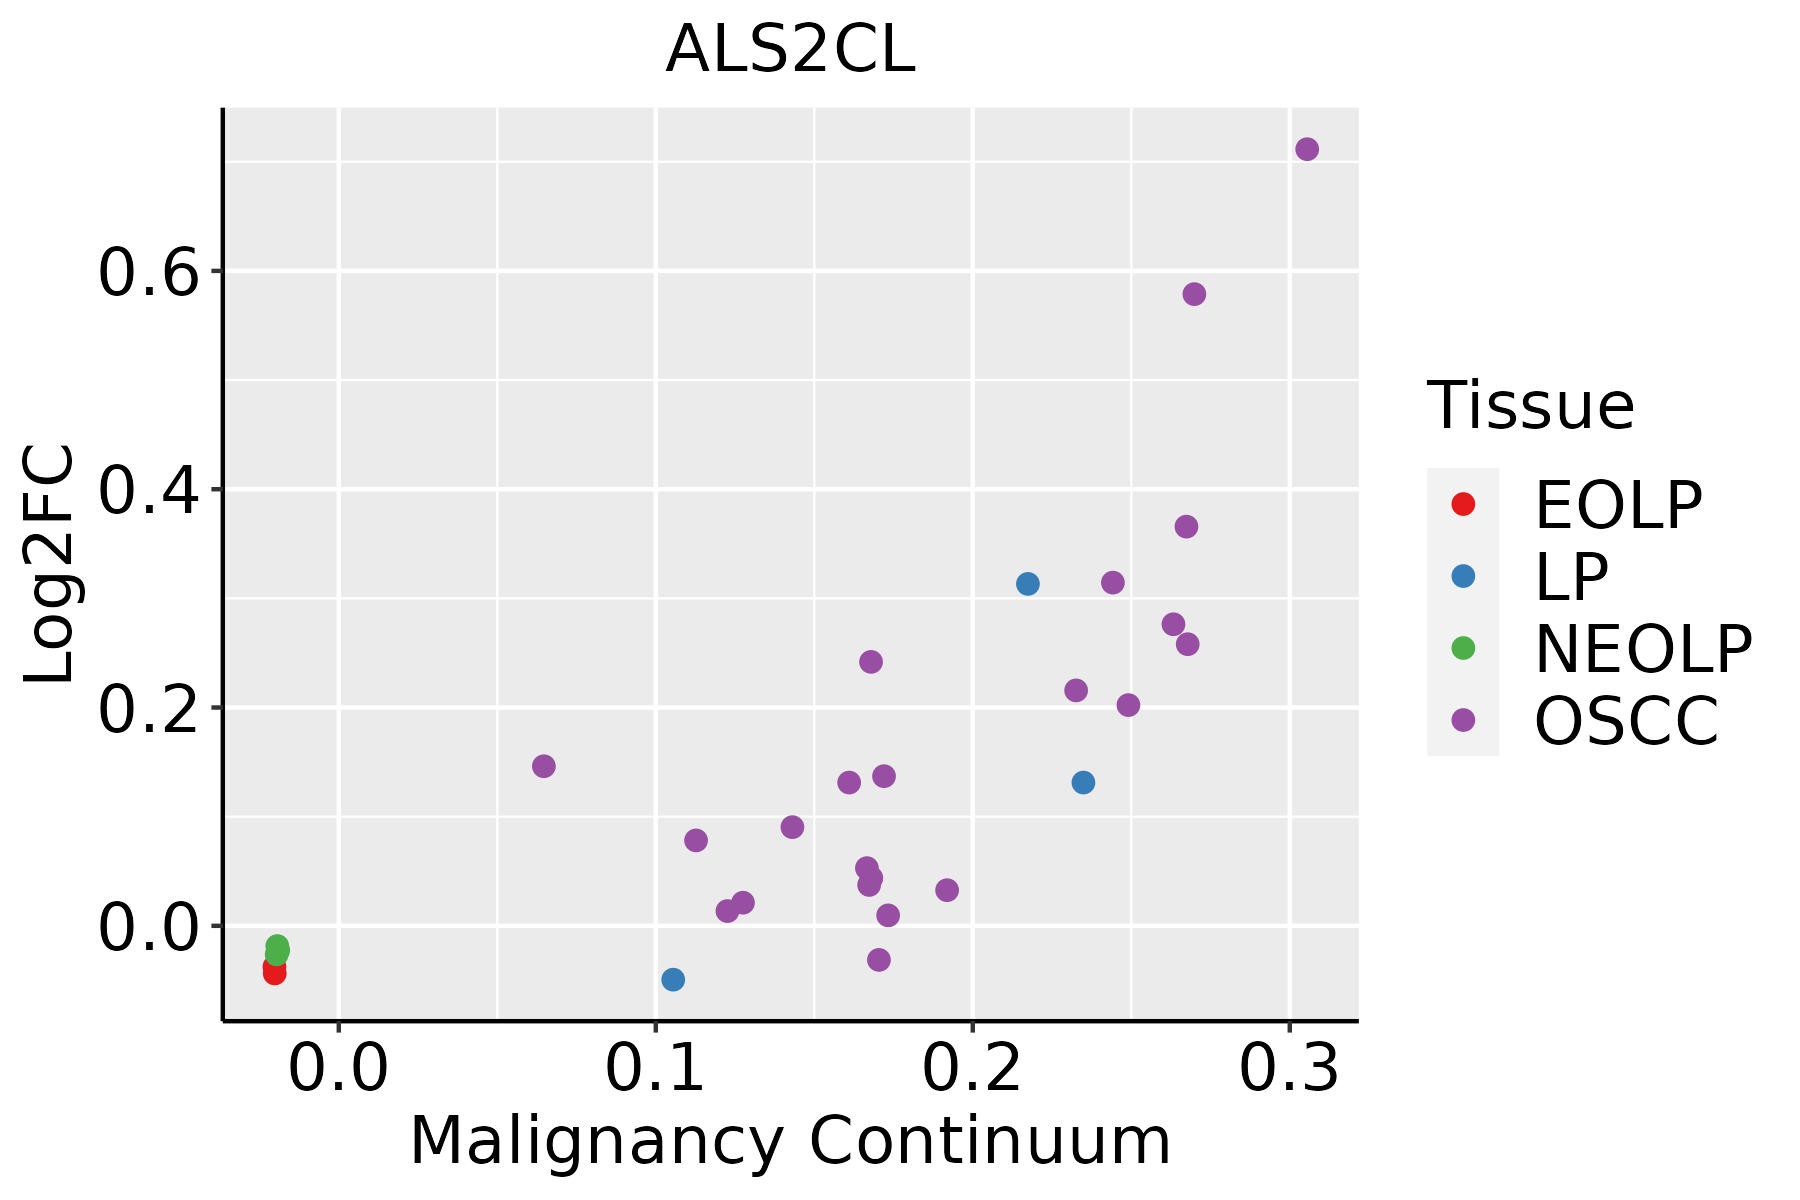 | EOLP: Erosive Oral lichen planus |
| LP: leukoplakia | ||
| NEOLP: Non-erosive oral lichen planus | ||
| OSCC: Oral squamous cell carcinoma |
| ∗log2FC in expression of this searched gene in stem-like cells from each diseased tissue sample relative to stem-like cells in normal samples in each tissue plotted against the malignancy continuum. Samples are colored based on if they are from different disease stage. |
Top |
Malignant transformation related pathway analysis |
| Find out the enriched GO biological processes and KEGG pathways involved in transition from healthy to precancer to cancer |
| Tissue | Disease Stage | Enriched GO biological Processes |
| Colorectum | AD |  |
| Colorectum | SER |  |
| Colorectum | MSS |  |
| Colorectum | MSI-H |  |
| Colorectum | FAP |  |
| ∗Top 15 enriched GO BP terms are showed in the bar plot of each disease state in each tissue. Each row represents a significant GO biological process which is colored according to the -log10(p.adjust). |
| Page: 1 2 3 4 5 6 7 8 9 |
| GO ID | Tissue | Disease Stage | Description | Gene Ratio | Bg Ratio | pvalue | p.adjust | Count |
| GO:001605021 | Liver | HCC | vesicle organization | 194/7958 | 300/18723 | 5.58e-15 | 3.97e-13 | 194 |
| GO:000703211 | Liver | HCC | endosome organization | 61/7958 | 82/18723 | 4.36e-09 | 1.15e-07 | 61 |
| GO:00160508 | Oral cavity | OSCC | vesicle organization | 189/7305 | 300/18723 | 2.40e-17 | 2.14e-15 | 189 |
| GO:00070327 | Oral cavity | OSCC | endosome organization | 59/7305 | 82/18723 | 1.41e-09 | 3.39e-08 | 59 |
| Page: 1 |
| Pathway ID | Tissue | Disease Stage | Description | Gene Ratio | Bg Ratio | pvalue | p.adjust | qvalue | Count |
| Page: 1 |
Top |
Cell-cell communication analysis |
| Identification of potential cell-cell interactions between two cell types and their ligand-receptor pairs for different disease states |
| Ligand | Receptor | LRpair | Pathway | Tissue | Disease Stage |
| Page: 1 |
Top |
Single-cell gene regulatory network inference analysis |
| Find out the significant the regulons (TFs) and the target genes of each regulon across cell types for different disease states |
| TF | Cell Type | Tissue | Disease Stage | Target Gene | RSS | Regulon Activity |
| ∗The dot plots of a searched regulon are shown for all cell subpopulations in each disease state of each tissue based on the regulon specific score inferred using pySCENIC and by calculating the average expression. |
| Page: 1 |
Top |
Somatic mutation of malignant transformation related genes |
| Annotation of somatic variants for genes involved in malignant transformation |
| Hugo Symbol | Variant Class | Variant Classification | dbSNP RS | HGVSc | HGVSp | HGVSp Short | SWISSPROT | BIOTYPE | SIFT | PolyPhen | Tumor Sample Barcode | Tissue | Histology | Sex | Age | Stage | Therapy Types | Drugs | Outcome |
| ALS2CL | SNV | Missense_Mutation | rs759477238 | c.2360N>G | p.Tyr787Cys | p.Y787C | Q60I27 | protein_coding | deleterious(0) | probably_damaging(0.999) | TCGA-A8-A08F-01 | Breast | breast invasive carcinoma | Female | <65 | III/IV | Chemotherapy | 5-fluorouracil | CR |
| ALS2CL | SNV | Missense_Mutation | c.2213N>T | p.Arg738Leu | p.R738L | Q60I27 | protein_coding | tolerated(0.1) | benign(0.396) | TCGA-BH-A0BL-01 | Breast | breast invasive carcinoma | Female | <65 | I/II | Chemotherapy | adriamycin | CR | |
| ALS2CL | SNV | Missense_Mutation | novel | c.331N>T | p.Val111Leu | p.V111L | Q60I27 | protein_coding | deleterious(0) | benign(0.136) | TCGA-EW-A3U0-01 | Breast | breast invasive carcinoma | Female | <65 | III/IV | Chemotherapy | cisplatin | CR |
| ALS2CL | insertion | Frame_Shift_Ins | novel | c.63_64insATATTTTTAGTGGAGACGG | p.His22IlefsTer78 | p.H22Ifs*78 | Q60I27 | protein_coding | TCGA-AN-A04D-01 | Breast | breast invasive carcinoma | Female | <65 | I/II | Unknown | Unknown | SD | ||
| ALS2CL | SNV | Missense_Mutation | novel | c.622G>A | p.Val208Met | p.V208M | Q60I27 | protein_coding | tolerated(0.29) | benign(0) | TCGA-2W-A8YY-01 | Cervix | cervical & endocervical cancer | Female | <65 | I/II | Chemotherapy | cisplatin | CR |
| ALS2CL | SNV | Missense_Mutation | rs760740178 | c.2075N>G | p.Leu692Arg | p.L692R | Q60I27 | protein_coding | deleterious(0) | probably_damaging(0.998) | TCGA-EA-A410-01 | Cervix | cervical & endocervical cancer | Female | <65 | I/II | Unknown | Unknown | SD |
| ALS2CL | SNV | Missense_Mutation | c.2143G>C | p.Glu715Gln | p.E715Q | Q60I27 | protein_coding | tolerated(0.07) | possibly_damaging(0.522) | TCGA-FU-A23K-01 | Cervix | cervical & endocervical cancer | Female | <65 | III/IV | Unknown | Unknown | SD | |
| ALS2CL | SNV | Missense_Mutation | c.2369N>T | p.Gly790Val | p.G790V | Q60I27 | protein_coding | tolerated(0.06) | probably_damaging(0.999) | TCGA-FU-A3HZ-01 | Cervix | cervical & endocervical cancer | Female | <65 | I/II | Chemotherapy | cisplatin | CR | |
| ALS2CL | SNV | Missense_Mutation | rs535935636 | c.1027N>A | p.Ala343Thr | p.A343T | Q60I27 | protein_coding | tolerated(0.14) | benign(0.01) | TCGA-VS-A9UP-01 | Cervix | cervical & endocervical cancer | Female | <65 | I/II | Chemotherapy | cisplatin | PD |
| ALS2CL | insertion | In_Frame_Ins | novel | c.1248_1249insCATGGAGGTAGG | p.Gly416_Ser417insHisGlyGlyArg | p.G416_S417insHGGR | Q60I27 | protein_coding | TCGA-DS-A1OA-01 | Cervix | cervical & endocervical cancer | Female | >=65 | I/II | Chemotherapy | carboplatin | PD |
| Page: 1 2 3 4 5 6 7 8 9 |
Top |
Related drugs of malignant transformation related genes |
| Identification of chemicals and drugs interact with genes involved in malignant transfromation |
| (DGIdb 4.0) |
| Entrez ID | Symbol | Category | Interaction Types | Drug Claim Name | Drug Name | PMIDs |
| Page: 1 |

Copyright 2023-Present -The University of Texas Health Science Center at Houston |