
|
|||||
|
 | |
| |
| |
| |
| |
| |
|
Gene: ALPL |
Gene summary for ALPL |
| Gene information | Species | Human | Gene symbol | ALPL | Gene ID | 249 |
| Gene name | alkaline phosphatase, biomineralization associated | |
| Gene Alias | AP-TNAP | |
| Cytomap | 1p36.12 | |
| Gene Type | protein-coding | GO ID | GO:0000003 | UniProtAcc | A0A024RAG0 |
Top |
Malignant transformation analysis |
| Identification of the aberrant gene expression in precancerous and cancerous lesions by comparing the gene expression of stem-like cells in diseased tissues with normal stem cells |
| Entrez ID | Symbol | Replicates | Species | Organ | Tissue | Adj P-value | Log2FC | Malignancy |
| 249 | ALPL | P8T-E | Human | Esophagus | ESCC | 1.51e-34 | 7.88e-01 | 0.0889 |
| 249 | ALPL | P12T-E | Human | Esophagus | ESCC | 3.28e-14 | 4.16e-01 | 0.1122 |
| 249 | ALPL | P15T-E | Human | Esophagus | ESCC | 1.35e-04 | 1.69e-01 | 0.1149 |
| 249 | ALPL | P23T-E | Human | Esophagus | ESCC | 1.99e-08 | 5.54e-01 | 0.108 |
| 249 | ALPL | P28T-E | Human | Esophagus | ESCC | 3.60e-13 | 2.75e-01 | 0.1149 |
| 249 | ALPL | P42T-E | Human | Esophagus | ESCC | 2.42e-06 | 5.11e-01 | 0.1175 |
| 249 | ALPL | P57T-E | Human | Esophagus | ESCC | 1.66e-02 | 2.74e-01 | 0.0926 |
| 249 | ALPL | P61T-E | Human | Esophagus | ESCC | 6.51e-14 | 3.77e-01 | 0.099 |
| 249 | ALPL | P65T-E | Human | Esophagus | ESCC | 1.35e-28 | 9.16e-01 | 0.0978 |
| 249 | ALPL | P74T-E | Human | Esophagus | ESCC | 4.21e-29 | 9.94e-01 | 0.1479 |
| 249 | ALPL | P76T-E | Human | Esophagus | ESCC | 1.49e-39 | 1.16e+00 | 0.1207 |
| 249 | ALPL | P79T-E | Human | Esophagus | ESCC | 1.00e-24 | 6.33e-01 | 0.1154 |
| 249 | ALPL | P126T-E | Human | Esophagus | ESCC | 6.92e-05 | 1.94e+00 | 0.1125 |
| 249 | ALPL | P130T-E | Human | Esophagus | ESCC | 4.41e-07 | 3.28e-01 | 0.1676 |
| Page: 1 |
| Tissue | Expression Dynamics | Abbreviation |
| Esophagus | 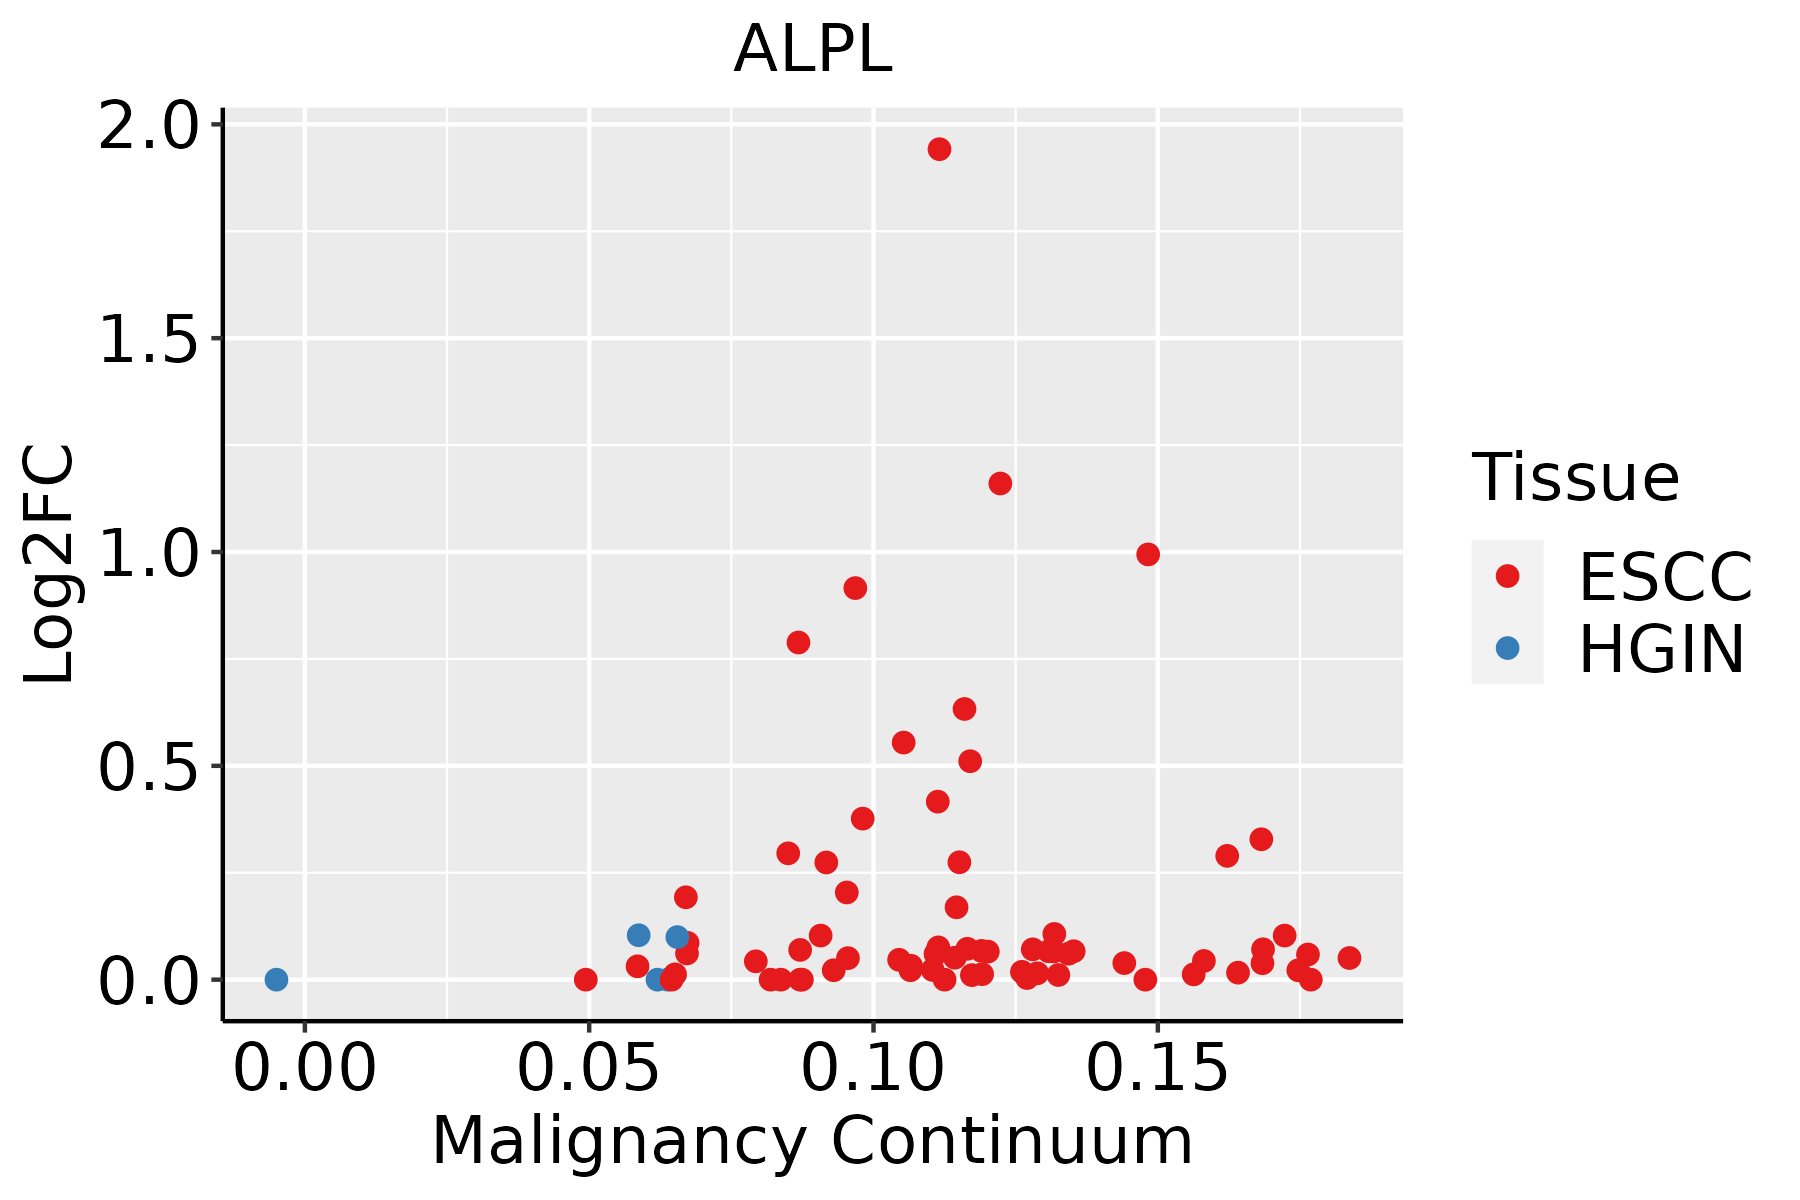 | ESCC: Esophageal squamous cell carcinoma |
| HGIN: High-grade intraepithelial neoplasias | ||
| LGIN: Low-grade intraepithelial neoplasias |
| ∗log2FC in expression of this searched gene in stem-like cells from each diseased tissue sample relative to stem-like cells in normal samples in each tissue plotted against the malignancy continuum. Samples are colored based on if they are from different disease stage. |
Top |
Malignant transformation related pathway analysis |
| Find out the enriched GO biological processes and KEGG pathways involved in transition from healthy to precancer to cancer |
| Tissue | Disease Stage | Enriched GO biological Processes |
| Colorectum | AD |  |
| Colorectum | SER |  |
| Colorectum | MSS |  |
| Colorectum | MSI-H |  |
| Colorectum | FAP |  |
| ∗Top 15 enriched GO BP terms are showed in the bar plot of each disease state in each tissue. Each row represents a significant GO biological process which is colored according to the -log10(p.adjust). |
| Page: 1 2 3 4 5 6 7 8 9 |
| GO ID | Tissue | Disease Stage | Description | Gene Ratio | Bg Ratio | pvalue | p.adjust | Count |
| GO:0031667111 | Esophagus | ESCC | response to nutrient levels | 289/8552 | 474/18723 | 9.25e-12 | 3.47e-10 | 289 |
| GO:001631110 | Esophagus | ESCC | dephosphorylation | 251/8552 | 417/18723 | 1.26e-09 | 2.99e-08 | 251 |
| GO:0048545111 | Esophagus | ESCC | response to steroid hormone | 204/8552 | 339/18723 | 4.47e-08 | 8.11e-07 | 204 |
| GO:000758410 | Esophagus | ESCC | response to nutrient | 114/8552 | 174/18723 | 9.43e-08 | 1.56e-06 | 114 |
| GO:000164918 | Esophagus | ESCC | osteoblast differentiation | 140/8552 | 229/18723 | 1.63e-06 | 1.95e-05 | 140 |
| GO:000150317 | Esophagus | ESCC | ossification | 232/8552 | 408/18723 | 3.00e-06 | 3.40e-05 | 232 |
| GO:003249619 | Esophagus | ESCC | response to lipopolysaccharide | 191/8552 | 343/18723 | 1.11e-04 | 7.73e-04 | 191 |
| GO:00332734 | Esophagus | ESCC | response to vitamin | 60/8552 | 93/18723 | 1.89e-04 | 1.21e-03 | 60 |
| GO:00466774 | Esophagus | ESCC | response to antibiotic | 34/8552 | 47/18723 | 1.91e-04 | 1.21e-03 | 34 |
| GO:000223719 | Esophagus | ESCC | response to molecule of bacterial origin | 194/8552 | 363/18723 | 1.64e-03 | 7.61e-03 | 194 |
| GO:00603485 | Esophagus | ESCC | bone development | 115/8552 | 205/18723 | 1.67e-03 | 7.72e-03 | 115 |
| GO:0033280 | Esophagus | ESCC | response to vitamin D | 25/8552 | 35/18723 | 1.82e-03 | 8.35e-03 | 25 |
| GO:003196020 | Esophagus | ESCC | response to corticosteroid | 95/8552 | 167/18723 | 2.27e-03 | 9.99e-03 | 95 |
| GO:005138420 | Esophagus | ESCC | response to glucocorticoid | 85/8552 | 148/18723 | 2.60e-03 | 1.11e-02 | 85 |
| GO:00487052 | Esophagus | ESCC | skeletal system morphogenesis | 120/8552 | 220/18723 | 4.90e-03 | 1.89e-02 | 120 |
| Page: 1 |
| Pathway ID | Tissue | Disease Stage | Description | Gene Ratio | Bg Ratio | pvalue | p.adjust | qvalue | Count |
| Page: 1 |
Top |
Cell-cell communication analysis |
| Identification of potential cell-cell interactions between two cell types and their ligand-receptor pairs for different disease states |
| Ligand | Receptor | LRpair | Pathway | Tissue | Disease Stage |
| Page: 1 |
Top |
Single-cell gene regulatory network inference analysis |
| Find out the significant the regulons (TFs) and the target genes of each regulon across cell types for different disease states |
| TF | Cell Type | Tissue | Disease Stage | Target Gene | RSS | Regulon Activity |
| ∗The dot plots of a searched regulon are shown for all cell subpopulations in each disease state of each tissue based on the regulon specific score inferred using pySCENIC and by calculating the average expression. |
| Page: 1 |
Top |
Somatic mutation of malignant transformation related genes |
| Annotation of somatic variants for genes involved in malignant transformation |
| Hugo Symbol | Variant Class | Variant Classification | dbSNP RS | HGVSc | HGVSp | HGVSp Short | SWISSPROT | BIOTYPE | SIFT | PolyPhen | Tumor Sample Barcode | Tissue | Histology | Sex | Age | Stage | Therapy Types | Drugs | Outcome |
| ALPL | SNV | Missense_Mutation | rs121918011 | c.407N>A | p.Arg136His | p.R136H | P05186 | protein_coding | tolerated(0.5) | probably_damaging(0.994) | TCGA-A2-A0EY-01 | Breast | breast invasive carcinoma | Female | <65 | I/II | Chemotherapy | adriamycin | SD |
| ALPL | SNV | Missense_Mutation | novel | c.1186T>C | p.Phe396Leu | p.F396L | P05186 | protein_coding | tolerated(0.42) | possibly_damaging(0.789) | TCGA-AN-A046-01 | Breast | breast invasive carcinoma | Female | >=65 | I/II | Unknown | Unknown | SD |
| ALPL | SNV | Missense_Mutation | novel | c.1447N>A | p.Val483Met | p.V483M | P05186 | protein_coding | deleterious(0.01) | probably_damaging(0.99) | TCGA-E2-A572-01 | Breast | breast invasive carcinoma | Female | >=65 | III/IV | Chemotherapy | doxorubicin | SD |
| ALPL | insertion | Nonsense_Mutation | novel | c.59_60insTTAGGAAATGGGACGG | p.Glu21Ter | p.E21* | P05186 | protein_coding | TCGA-B6-A0IN-01 | Breast | breast invasive carcinoma | Female | <65 | I/II | Unknown | Unknown | PD | ||
| ALPL | insertion | In_Frame_Ins | novel | c.149_150insACTACA | p.Val50_Ala51insLeuGln | p.V50_A51insLQ | P05186 | protein_coding | TCGA-BH-A1FD-01 | Breast | breast invasive carcinoma | Female | >=65 | I/II | Unknown | Unknown | PD | ||
| ALPL | insertion | Frame_Shift_Ins | novel | c.150_151insGTGCACACTGCCACGCCCA | p.Ala51ValfsTer8 | p.A51Vfs*8 | P05186 | protein_coding | TCGA-BH-A1FD-01 | Breast | breast invasive carcinoma | Female | >=65 | I/II | Unknown | Unknown | PD | ||
| ALPL | SNV | Missense_Mutation | c.130C>G | p.Gln44Glu | p.Q44E | P05186 | protein_coding | tolerated(0.14) | benign(0.411) | TCGA-EA-A439-01 | Cervix | cervical & endocervical cancer | Female | <65 | I/II | Unknown | Unknown | PD | |
| ALPL | SNV | Missense_Mutation | rs748874853 | c.412N>T | p.Arg138Trp | p.R138W | P05186 | protein_coding | deleterious(0) | possibly_damaging(0.806) | TCGA-AA-3663-01 | Colorectum | colon adenocarcinoma | Male | <65 | I/II | Unknown | Unknown | SD |
| ALPL | SNV | Missense_Mutation | rs79250591 | c.1526N>A | p.Gly509Asp | p.G509D | P05186 | protein_coding | tolerated(0.42) | benign(0.031) | TCGA-AA-A010-01 | Colorectum | colon adenocarcinoma | Female | <65 | I/II | Chemotherapy | folinic | CR |
| ALPL | SNV | Missense_Mutation | c.1192N>A | p.Leu398Met | p.L398M | P05186 | protein_coding | deleterious(0.02) | probably_damaging(0.999) | TCGA-CA-6718-01 | Colorectum | colon adenocarcinoma | Male | <65 | I/II | Unknown | Unknown | PD |
| Page: 1 2 3 4 5 6 |
Top |
Related drugs of malignant transformation related genes |
| Identification of chemicals and drugs interact with genes involved in malignant transfromation |
| (DGIdb 4.0) |
| Entrez ID | Symbol | Category | Interaction Types | Drug Claim Name | Drug Name | PMIDs |
| 249 | ALPL | ENZYME, DRUGGABLE GENOME | 5,7,3',5'-TETRAHYDROXYFLAVANONE | CHEMBL307893 | ||
| 249 | ALPL | ENZYME, DRUGGABLE GENOME | NSC-353720 | CHEMBL1408276 | ||
| 249 | ALPL | ENZYME, DRUGGABLE GENOME | RETINOIC ACID | 10691970 | ||
| 249 | ALPL | ENZYME, DRUGGABLE GENOME | CEPHALOCHROMIN | CEPHALOCHROMIN | ||
| 249 | ALPL | ENZYME, DRUGGABLE GENOME | Levamisole | LEVAMISOLE | ||
| 249 | ALPL | ENZYME, DRUGGABLE GENOME | THUNBERGINOL B | THUNBERGINOL B | ||
| 249 | ALPL | ENZYME, DRUGGABLE GENOME | CID 646303 | CHEMBL505807 | ||
| 249 | ALPL | ENZYME, DRUGGABLE GENOME | TYRPHOSTIN 23 | TYRPHOSTIN 23 | ||
| 249 | ALPL | ENZYME, DRUGGABLE GENOME | DNDI1417523 | CHEMBL598663 | ||
| 249 | ALPL | ENZYME, DRUGGABLE GENOME | 2-AMINOPHENOXAZINONE | CHEMBL146710 |
| Page: 1 2 3 |

Copyright 2023-Present -The University of Texas Health Science Center at Houston |