
|
|||||
|
 | |
| |
| |
| |
| |
| |
|
Gene: ALPK3 |
Gene summary for ALPK3 |
| Gene information | Species | Human | Gene symbol | ALPK3 | Gene ID | 57538 |
| Gene name | alpha kinase 3 | |
| Gene Alias | CMH27 | |
| Cytomap | 15q25.3 | |
| Gene Type | protein-coding | GO ID | GO:0006464 | UniProtAcc | Q96L96 |
Top |
Malignant transformation analysis |
| Identification of the aberrant gene expression in precancerous and cancerous lesions by comparing the gene expression of stem-like cells in diseased tissues with normal stem cells |
| Entrez ID | Symbol | Replicates | Species | Organ | Tissue | Adj P-value | Log2FC | Malignancy |
| 57538 | ALPK3 | AEH-subject1 | Human | Endometrium | AEH | 1.53e-24 | 5.76e-01 | -0.3059 |
| 57538 | ALPK3 | AEH-subject2 | Human | Endometrium | AEH | 3.11e-03 | 2.53e-01 | -0.2525 |
| 57538 | ALPK3 | AEH-subject4 | Human | Endometrium | AEH | 1.08e-15 | 5.71e-01 | -0.2657 |
| 57538 | ALPK3 | EEC-subject2 | Human | Endometrium | EEC | 4.64e-10 | 3.71e-01 | -0.2607 |
| 57538 | ALPK3 | GSM6177622_NYU_UCEC3_lib1_lib1 | Human | Endometrium | EEC | 4.33e-02 | 1.63e-01 | -0.1917 |
| 57538 | ALPK3 | GSM6177623_NYU_UCEC3_Vis | Human | Endometrium | EEC | 3.64e-09 | 4.25e-01 | -0.1269 |
| 57538 | ALPK3 | HCC1 | Human | Liver | HCC | 1.42e-05 | 2.26e+00 | 0.5336 |
| 57538 | ALPK3 | Pt13.b | Human | Liver | HCC | 1.41e-02 | 5.34e-02 | 0.0251 |
| 57538 | ALPK3 | S014 | Human | Liver | HCC | 2.68e-04 | 2.80e-01 | 0.2254 |
| 57538 | ALPK3 | S015 | Human | Liver | HCC | 6.01e-09 | 4.43e-01 | 0.2375 |
| 57538 | ALPK3 | S016 | Human | Liver | HCC | 2.13e-08 | 3.23e-01 | 0.2243 |
| 57538 | ALPK3 | S027 | Human | Liver | HCC | 8.44e-12 | 9.00e-01 | 0.2446 |
| 57538 | ALPK3 | S028 | Human | Liver | HCC | 1.80e-31 | 9.84e-01 | 0.2503 |
| 57538 | ALPK3 | S029 | Human | Liver | HCC | 5.87e-22 | 8.27e-01 | 0.2581 |
| Page: 1 |
| Tissue | Expression Dynamics | Abbreviation |
| Endometrium | 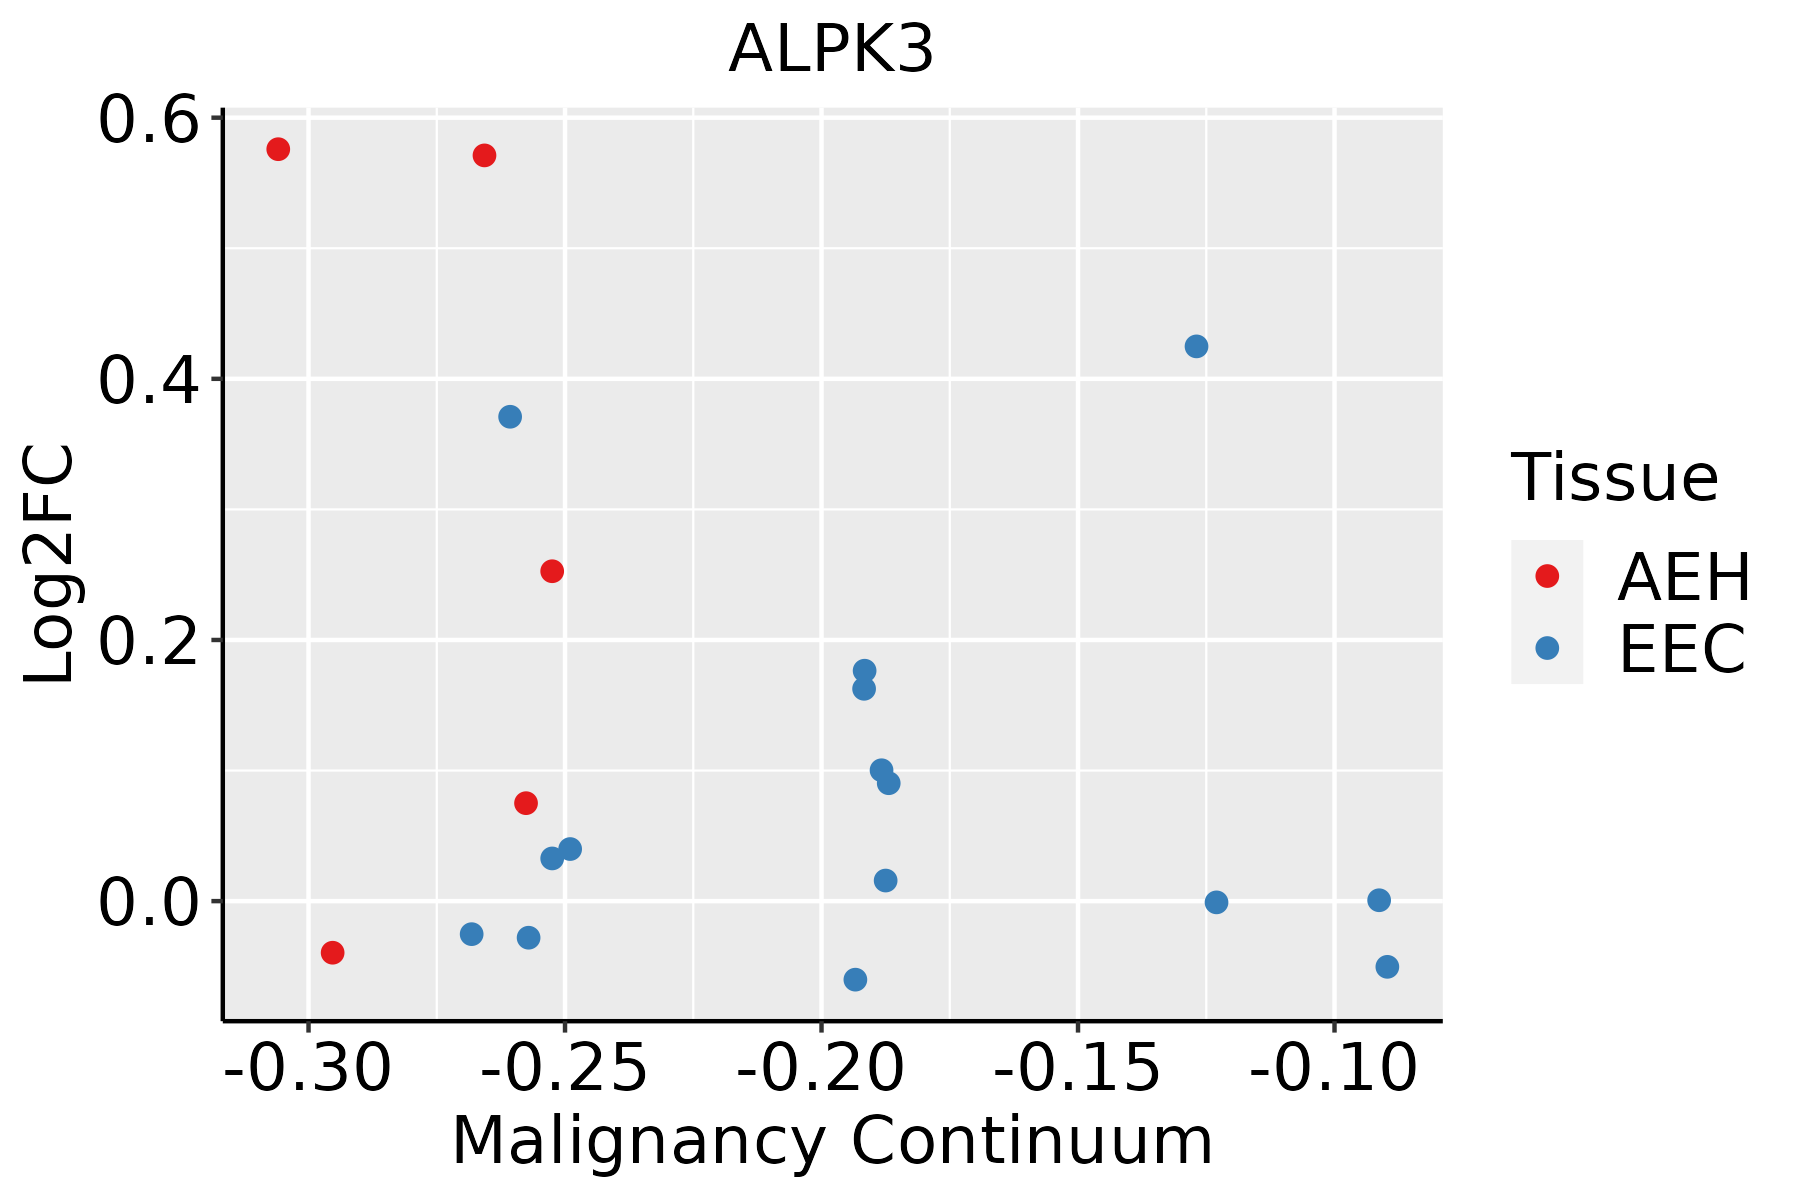 | AEH: Atypical endometrial hyperplasia |
| EEC: Endometrioid Cancer | ||
| Liver | 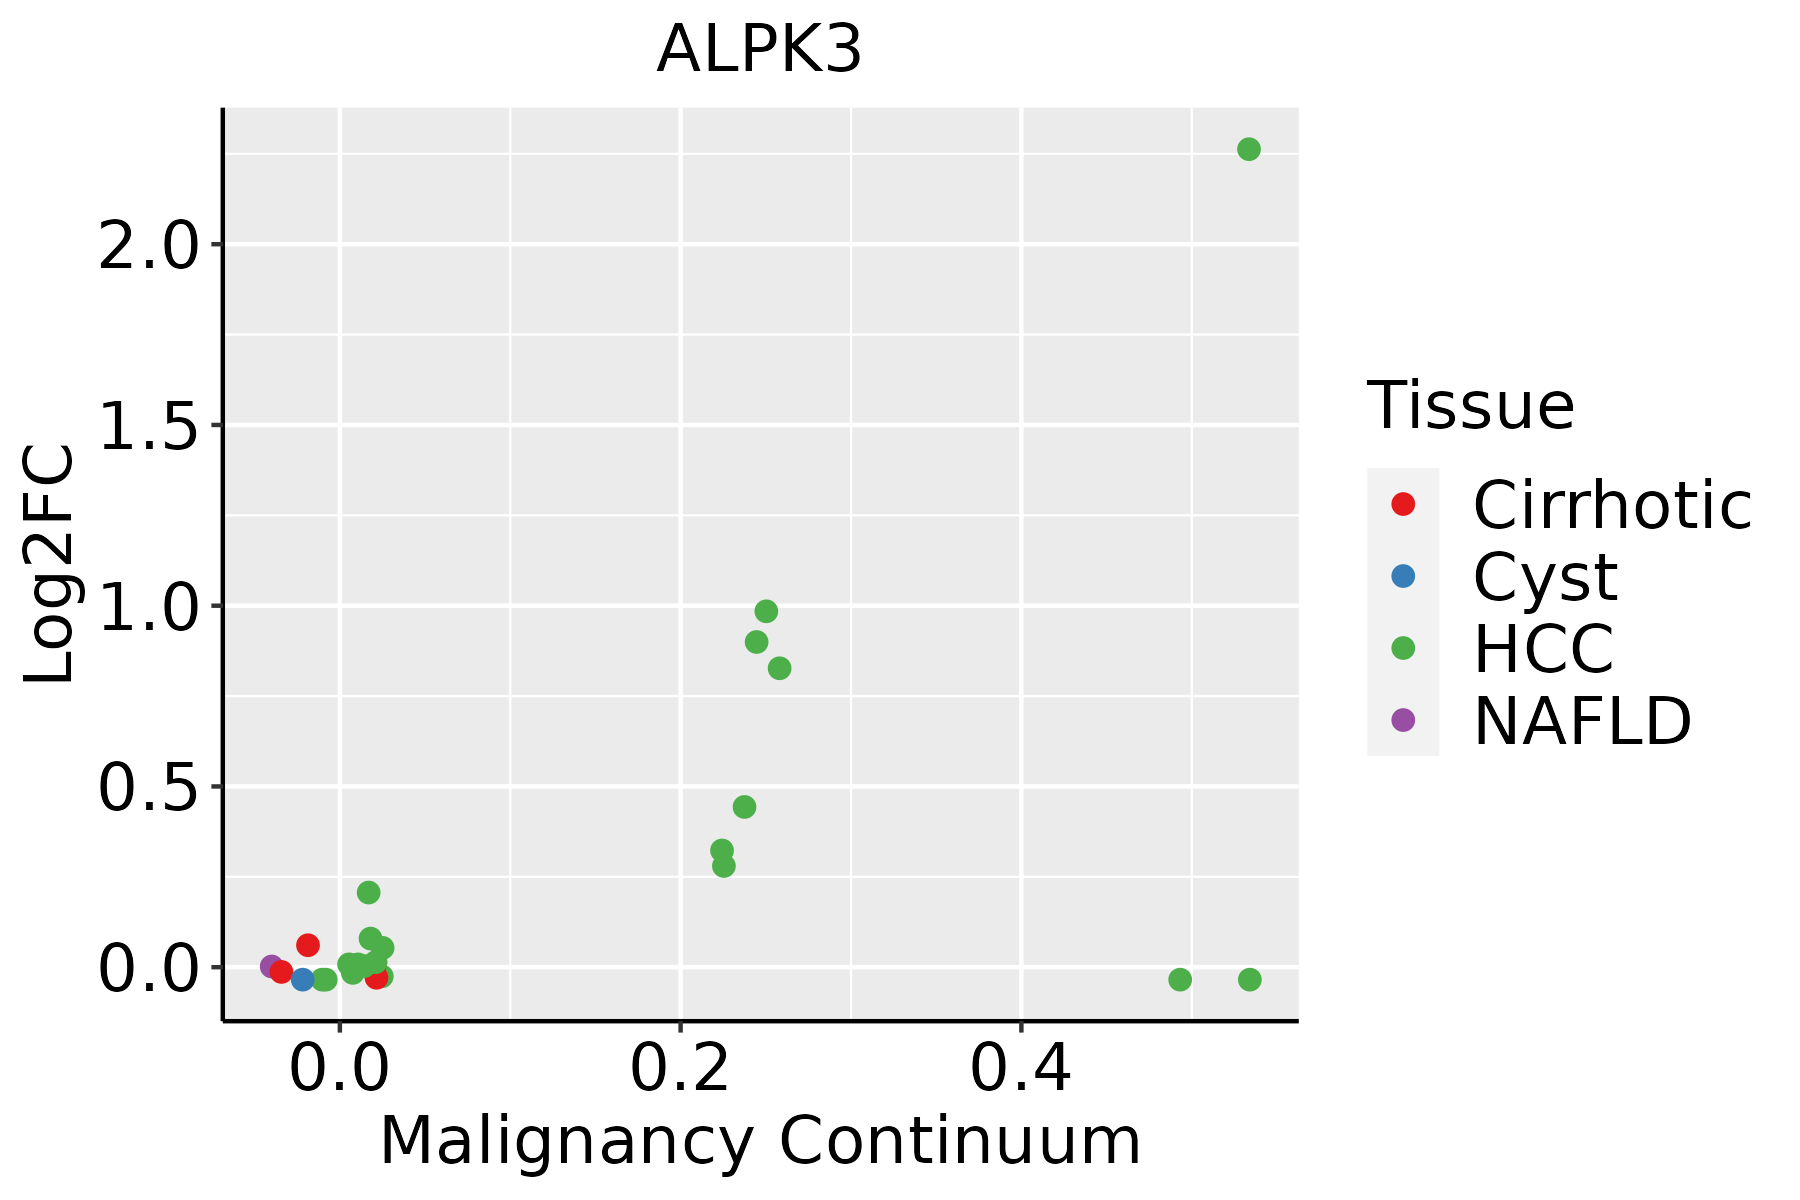 | HCC: Hepatocellular carcinoma |
| NAFLD: Non-alcoholic fatty liver disease |
| ∗log2FC in expression of this searched gene in stem-like cells from each diseased tissue sample relative to stem-like cells in normal samples in each tissue plotted against the malignancy continuum. Samples are colored based on if they are from different disease stage. |
Top |
Malignant transformation related pathway analysis |
| Find out the enriched GO biological processes and KEGG pathways involved in transition from healthy to precancer to cancer |
| Tissue | Disease Stage | Enriched GO biological Processes |
| Colorectum | AD |  |
| Colorectum | SER |  |
| Colorectum | MSS |  |
| Colorectum | MSI-H |  |
| Colorectum | FAP |  |
| ∗Top 15 enriched GO BP terms are showed in the bar plot of each disease state in each tissue. Each row represents a significant GO biological process which is colored according to the -log10(p.adjust). |
| Page: 1 2 3 4 5 6 7 8 9 |
| GO ID | Tissue | Disease Stage | Description | Gene Ratio | Bg Ratio | pvalue | p.adjust | Count |
| GO:00605376 | Endometrium | AEH | muscle tissue development | 83/2100 | 403/18723 | 2.57e-08 | 1.50e-06 | 83 |
| GO:00147065 | Endometrium | AEH | striated muscle tissue development | 75/2100 | 384/18723 | 1.06e-06 | 3.62e-05 | 75 |
| GO:00426925 | Endometrium | AEH | muscle cell differentiation | 68/2100 | 384/18723 | 8.88e-05 | 1.30e-03 | 68 |
| GO:00511465 | Endometrium | AEH | striated muscle cell differentiation | 51/2100 | 283/18723 | 4.20e-04 | 4.46e-03 | 51 |
| GO:0048738 | Endometrium | AEH | cardiac muscle tissue development | 43/2100 | 236/18723 | 9.06e-04 | 8.30e-03 | 43 |
| GO:006053713 | Endometrium | EEC | muscle tissue development | 82/2168 | 403/18723 | 2.14e-07 | 9.38e-06 | 82 |
| GO:001470612 | Endometrium | EEC | striated muscle tissue development | 74/2168 | 384/18723 | 6.64e-06 | 1.57e-04 | 74 |
| GO:004269212 | Endometrium | EEC | muscle cell differentiation | 67/2168 | 384/18723 | 3.87e-04 | 4.12e-03 | 67 |
| GO:005114613 | Endometrium | EEC | striated muscle cell differentiation | 51/2168 | 283/18723 | 8.71e-04 | 7.97e-03 | 51 |
| GO:00487381 | Endometrium | EEC | cardiac muscle tissue development | 42/2168 | 236/18723 | 3.00e-03 | 2.10e-02 | 42 |
| Page: 1 |
| Pathway ID | Tissue | Disease Stage | Description | Gene Ratio | Bg Ratio | pvalue | p.adjust | qvalue | Count |
| Page: 1 |
Top |
Cell-cell communication analysis |
| Identification of potential cell-cell interactions between two cell types and their ligand-receptor pairs for different disease states |
| Ligand | Receptor | LRpair | Pathway | Tissue | Disease Stage |
| Page: 1 |
Top |
Single-cell gene regulatory network inference analysis |
| Find out the significant the regulons (TFs) and the target genes of each regulon across cell types for different disease states |
| TF | Cell Type | Tissue | Disease Stage | Target Gene | RSS | Regulon Activity |
| ∗The dot plots of a searched regulon are shown for all cell subpopulations in each disease state of each tissue based on the regulon specific score inferred using pySCENIC and by calculating the average expression. |
| Page: 1 |
Top |
Somatic mutation of malignant transformation related genes |
| Annotation of somatic variants for genes involved in malignant transformation |
| Hugo Symbol | Variant Class | Variant Classification | dbSNP RS | HGVSc | HGVSp | HGVSp Short | SWISSPROT | BIOTYPE | SIFT | PolyPhen | Tumor Sample Barcode | Tissue | Histology | Sex | Age | Stage | Therapy Types | Drugs | Outcome |
| ALPK3 | SNV | Missense_Mutation | c.1193T>A | p.Ile398Asn | p.I398N | Q96L96 | protein_coding | deleterious(0.02) | possibly_damaging(0.758) | TCGA-3C-AALI-01 | Breast | breast invasive carcinoma | Female | <65 | I/II | Unspecific | Poly E | Complete Response | |
| ALPK3 | SNV | Missense_Mutation | novel | c.5037N>C | p.Met1679Ile | p.M1679I | Q96L96 | protein_coding | deleterious(0.03) | possibly_damaging(0.821) | TCGA-5L-AAT0-01 | Breast | breast invasive carcinoma | Female | <65 | I/II | Hormone Therapy | tamoxiphen | SD |
| ALPK3 | SNV | Missense_Mutation | c.2932N>A | p.Glu978Lys | p.E978K | Q96L96 | protein_coding | deleterious_low_confidence(0) | benign(0.202) | TCGA-A1-A0SH-01 | Breast | breast invasive carcinoma | Female | <65 | I/II | Chemotherapy | tc | SD | |
| ALPK3 | SNV | Missense_Mutation | novel | c.4437N>G | p.Ile1479Met | p.I1479M | Q96L96 | protein_coding | deleterious(0) | probably_damaging(0.994) | TCGA-A7-A4SE-01 | Breast | breast invasive carcinoma | Female | <65 | I/II | Chemotherapy | adriamycin | CR |
| ALPK3 | SNV | Missense_Mutation | c.3077C>T | p.Ser1026Leu | p.S1026L | Q96L96 | protein_coding | tolerated_low_confidence(0.16) | benign(0) | TCGA-AC-A23H-01 | Breast | breast invasive carcinoma | Female | >=65 | I/II | Unknown | Unknown | PD | |
| ALPK3 | SNV | Missense_Mutation | c.4159G>C | p.Glu1387Gln | p.E1387Q | Q96L96 | protein_coding | deleterious(0.01) | possibly_damaging(0.838) | TCGA-AC-A23H-01 | Breast | breast invasive carcinoma | Female | >=65 | I/II | Unknown | Unknown | PD | |
| ALPK3 | SNV | Missense_Mutation | novel | c.2495C>A | p.Ala832Asp | p.A832D | Q96L96 | protein_coding | deleterious_low_confidence(0.01) | benign(0.003) | TCGA-B6-A0RI-01 | Breast | breast invasive carcinoma | Female | <65 | III/IV | Unknown | Unknown | PD |
| ALPK3 | SNV | Missense_Mutation | rs754388099 | c.975G>T | p.Leu325Phe | p.L325F | Q96L96 | protein_coding | deleterious(0) | probably_damaging(0.999) | TCGA-BH-A0HU-01 | Breast | breast invasive carcinoma | Female | <65 | I/II | Chemotherapy | docetaxel | SD |
| ALPK3 | SNV | Missense_Mutation | c.4786G>T | p.Asp1596Tyr | p.D1596Y | Q96L96 | protein_coding | deleterious(0) | probably_damaging(0.999) | TCGA-BH-A18V-01 | Breast | breast invasive carcinoma | Female | <65 | I/II | Unknown | Unknown | SD | |
| ALPK3 | SNV | Missense_Mutation | rs762254234 | c.4645A>C | p.Thr1549Pro | p.T1549P | Q96L96 | protein_coding | deleterious(0) | probably_damaging(0.988) | TCGA-D8-A1XG-01 | Breast | breast invasive carcinoma | Female | >=65 | III/IV | Unknown | Unknown | SD |
| Page: 1 2 3 4 5 6 7 8 9 10 11 12 13 14 15 16 17 18 19 20 |
Top |
Related drugs of malignant transformation related genes |
| Identification of chemicals and drugs interact with genes involved in malignant transfromation |
| (DGIdb 4.0) |
| Entrez ID | Symbol | Category | Interaction Types | Drug Claim Name | Drug Name | PMIDs |
| Page: 1 |

Copyright 2023-Present -The University of Texas Health Science Center at Houston |