| Tissue | Expression Dynamics | Abbreviation |
| Cervix | 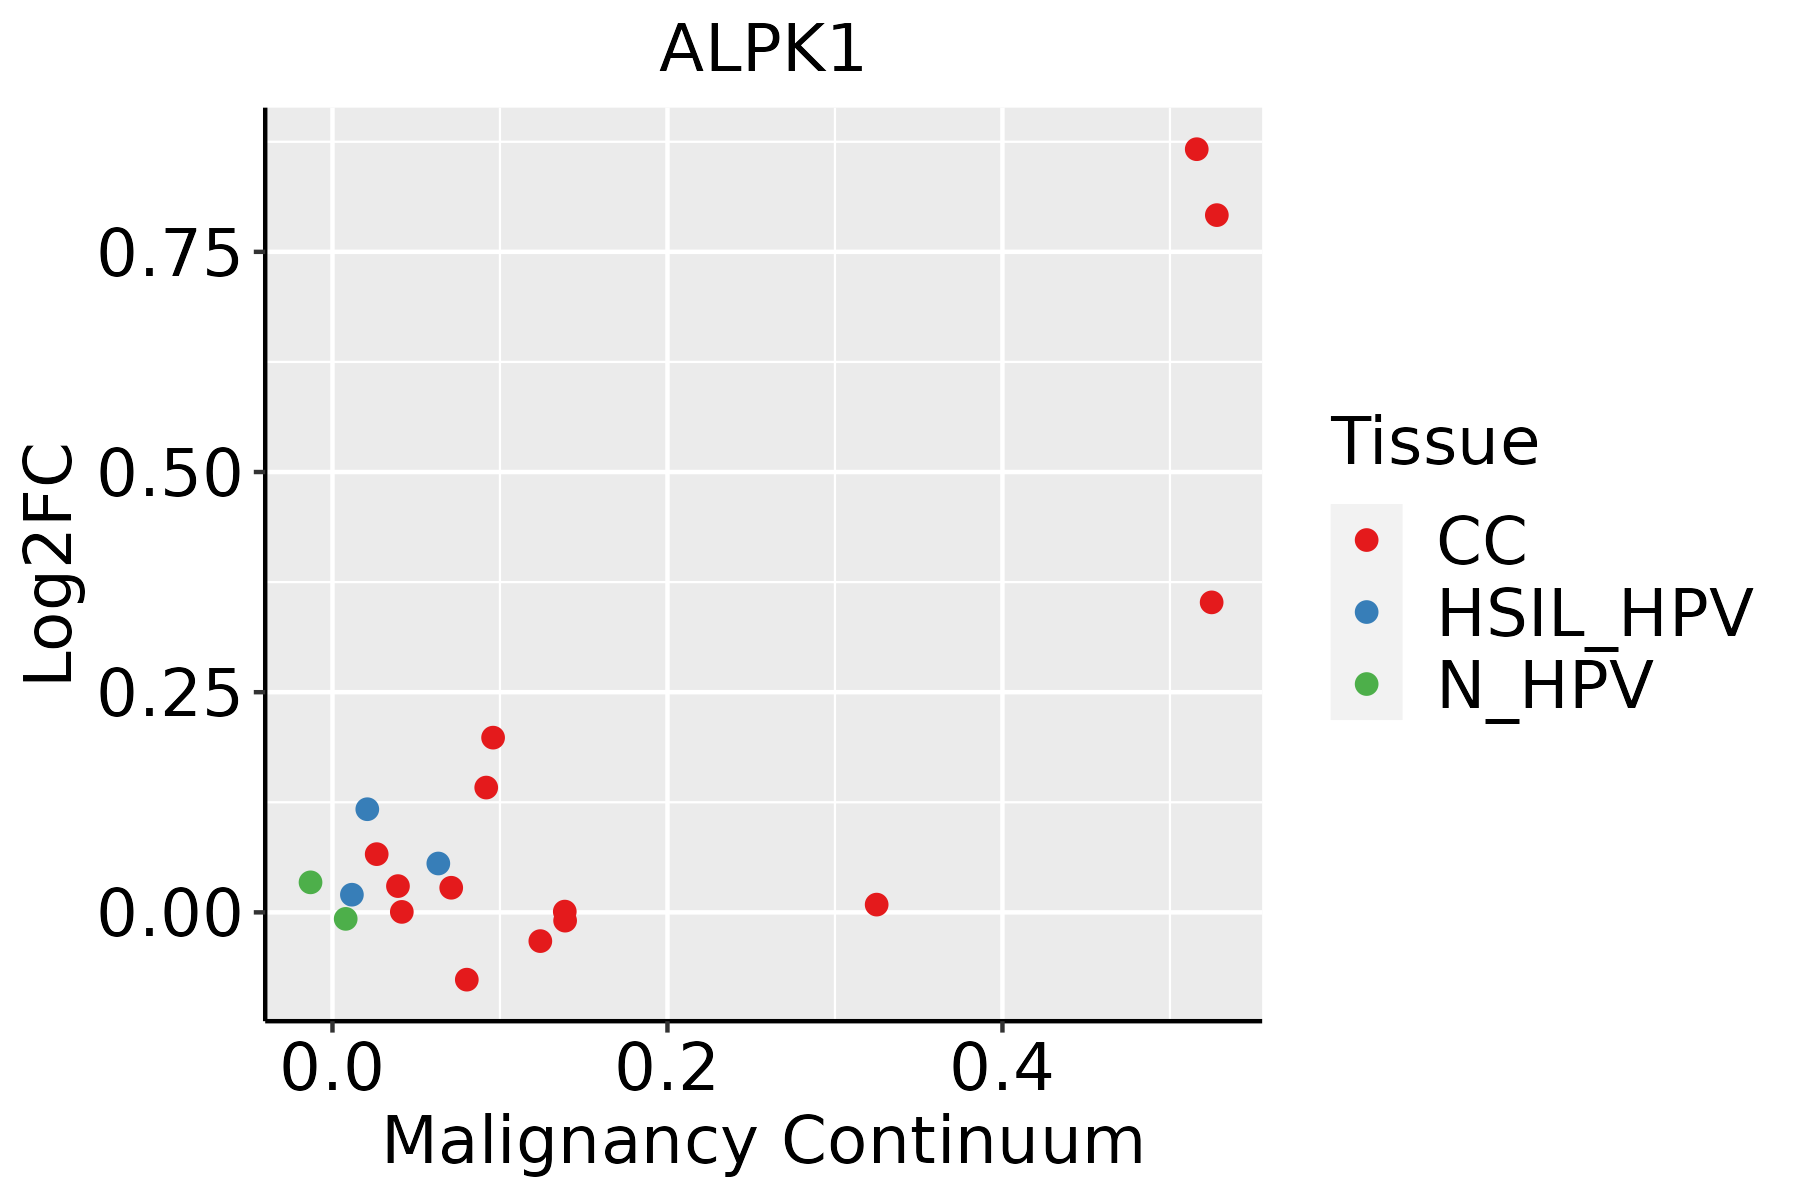 | CC: Cervix cancer |
| HSIL_HPV: HPV-infected high-grade squamous intraepithelial lesions |
| N_HPV: HPV-infected normal cervix |
| Lung | 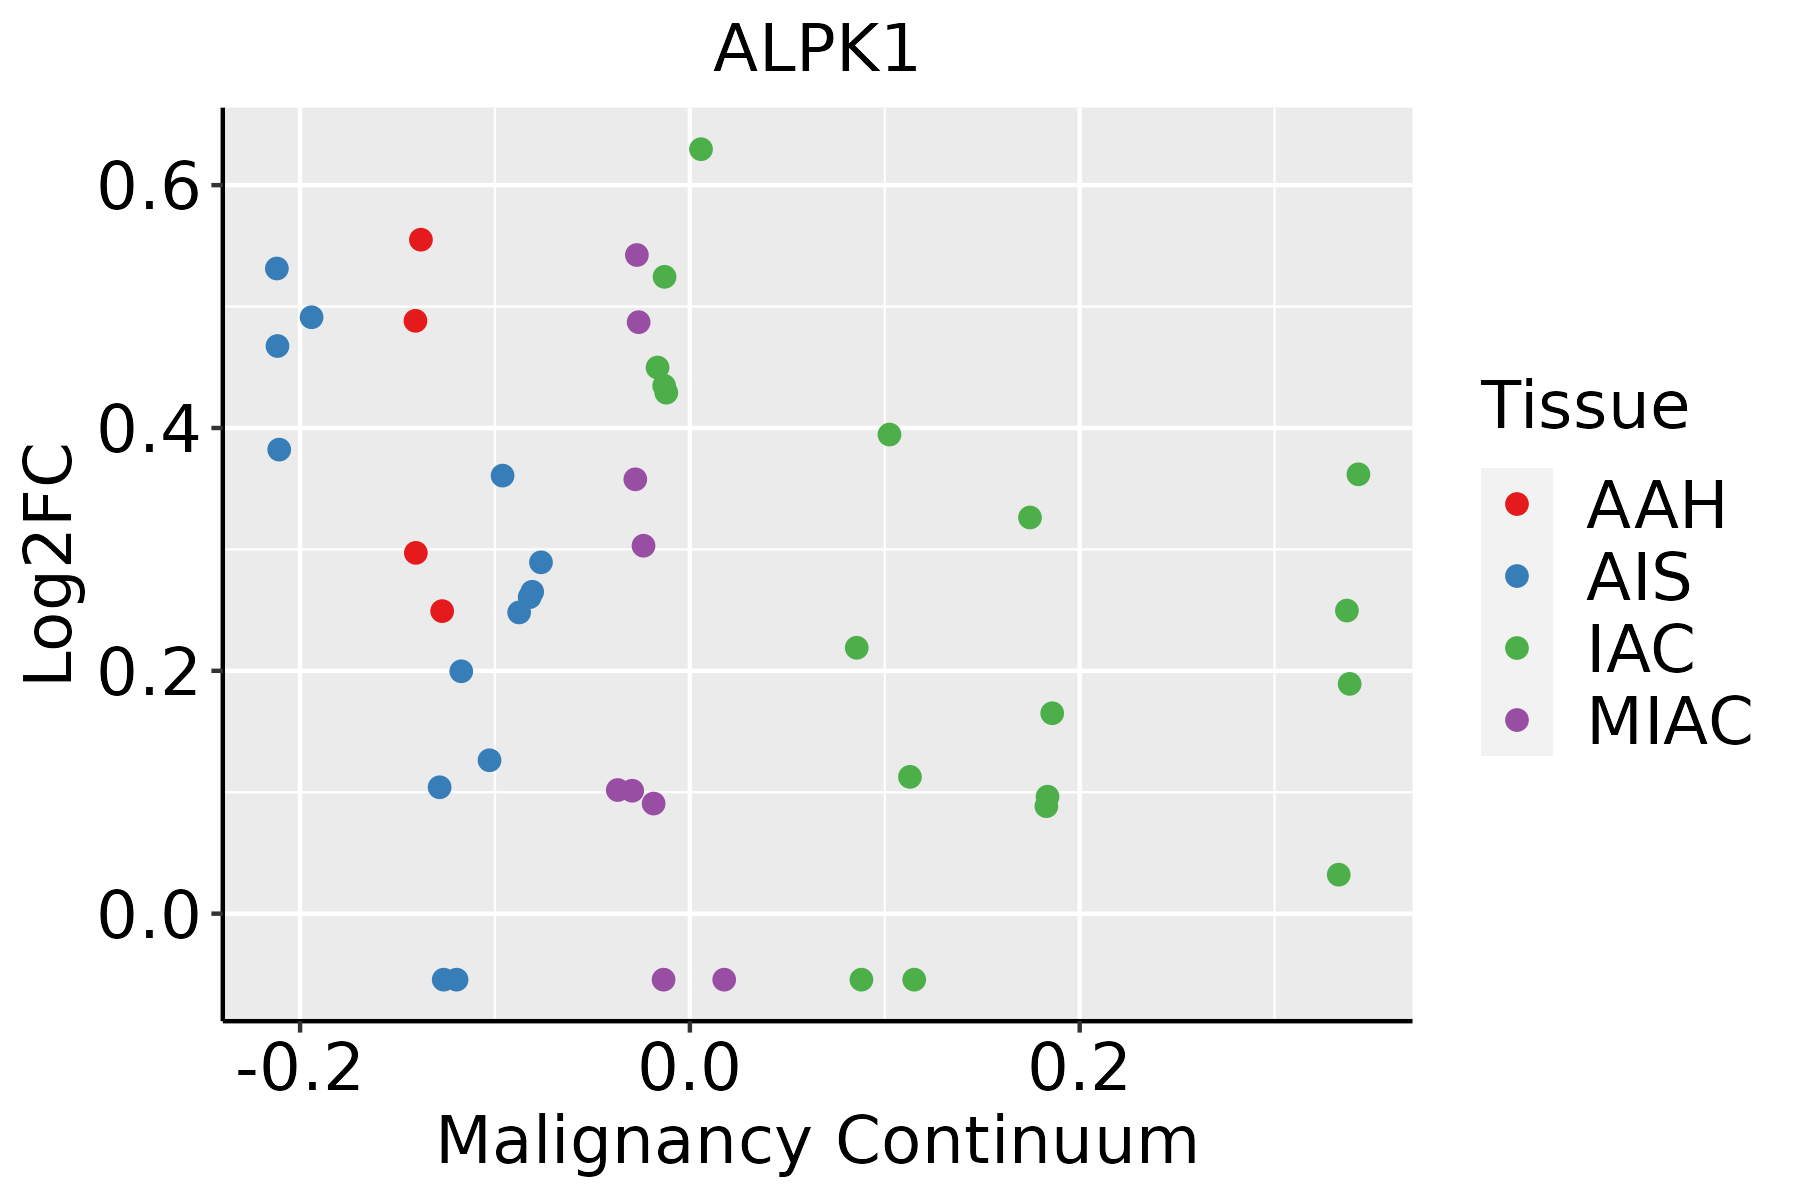 | AAH: Atypical adenomatous hyperplasia |
| AIS: Adenocarcinoma in situ |
| IAC: Invasive lung adenocarcinoma |
| MIA: Minimally invasive adenocarcinoma |
| Thyroid | 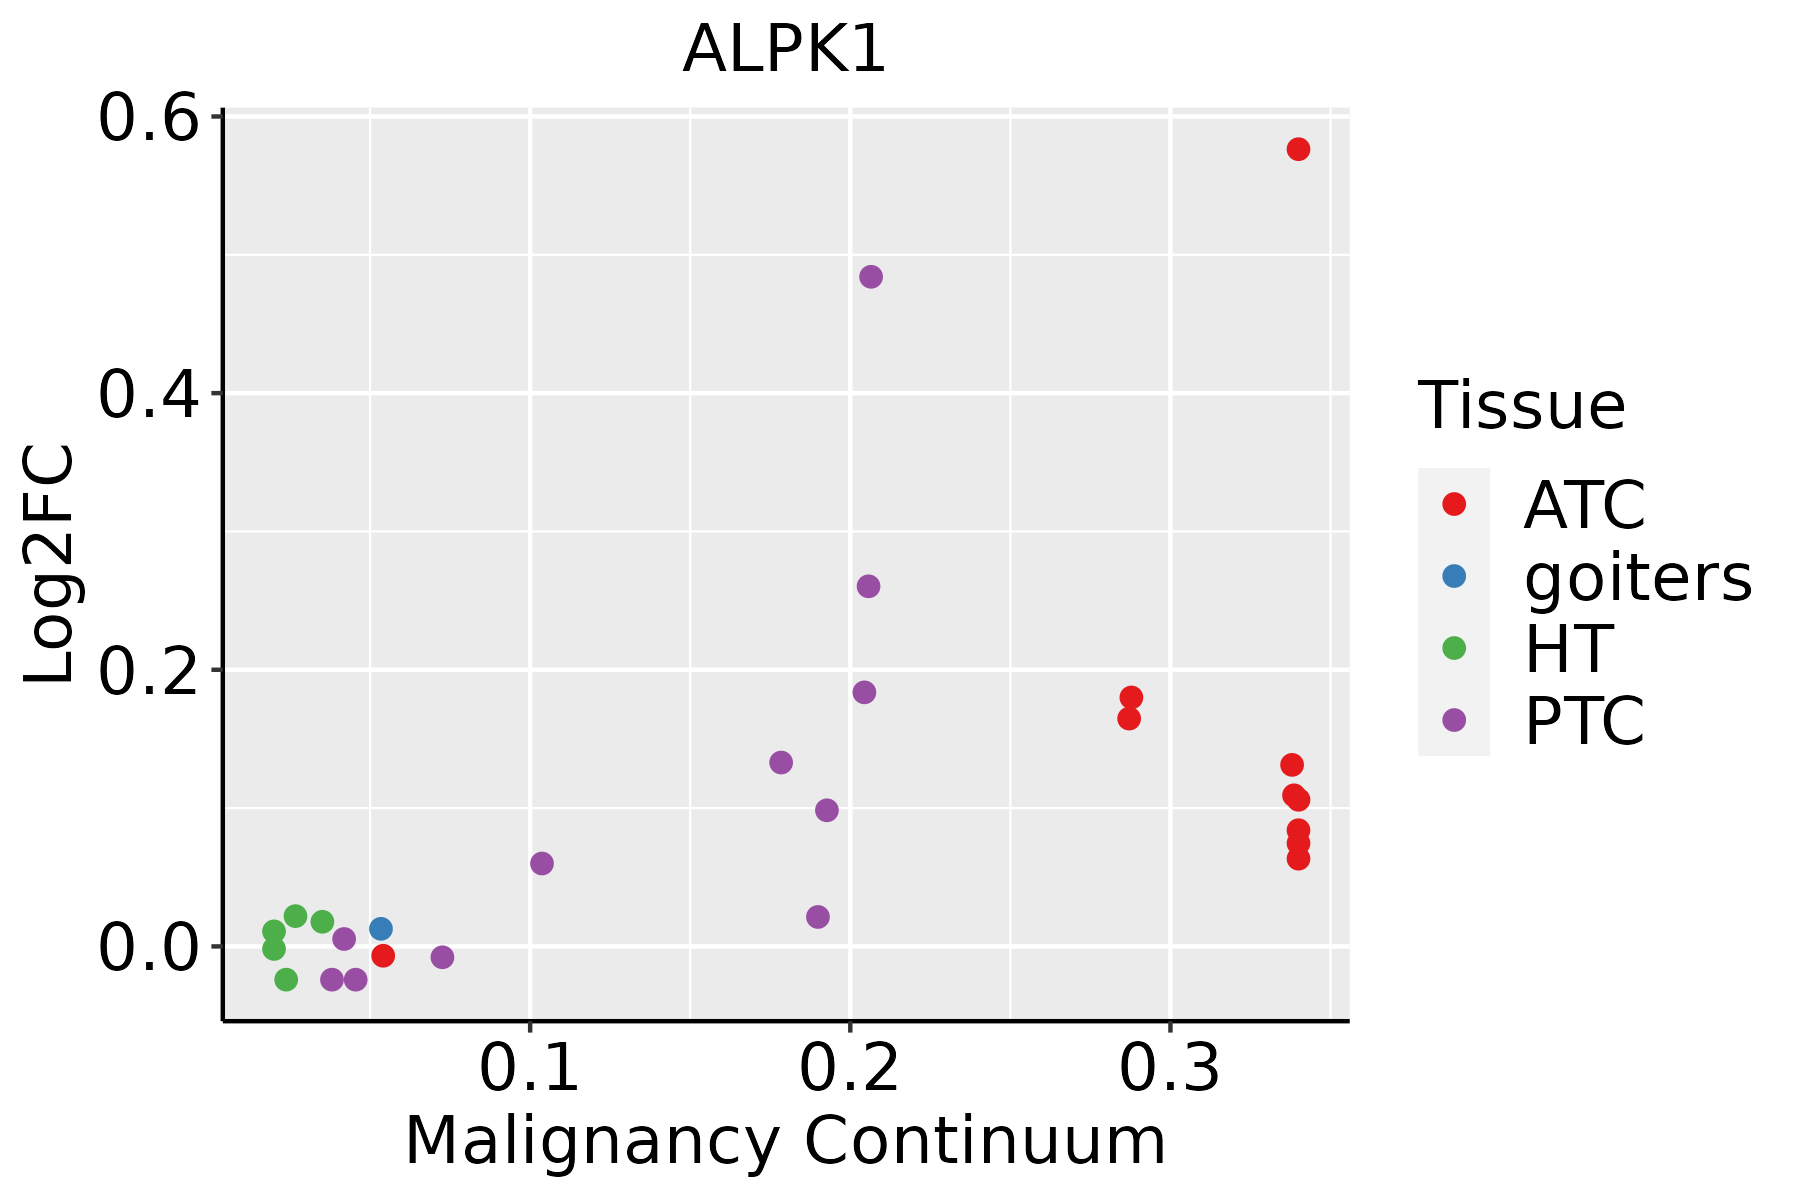 | ATC: Anaplastic thyroid cancer |
| HT: Hashimoto's thyroiditis |
| PTC: Papillary thyroid cancer |
| GO ID | Tissue | Disease Stage | Description | Gene Ratio | Bg Ratio | pvalue | p.adjust | Count |
| GO:00027644 | Cervix | CC | immune response-regulating signaling pathway | 97/2311 | 468/18723 | 1.49e-07 | 7.07e-06 | 97 |
| GO:00305229 | Cervix | CC | intracellular receptor signaling pathway | 60/2311 | 265/18723 | 1.89e-06 | 5.97e-05 | 60 |
| GO:00431228 | Cervix | CC | regulation of I-kappaB kinase/NF-kappaB signaling | 53/2311 | 249/18723 | 4.50e-05 | 6.87e-04 | 53 |
| GO:00022212 | Cervix | CC | pattern recognition receptor signaling pathway | 39/2311 | 172/18723 | 1.08e-04 | 1.38e-03 | 39 |
| GO:00072497 | Cervix | CC | I-kappaB kinase/NF-kappaB signaling | 56/2311 | 281/18723 | 1.81e-04 | 2.12e-03 | 56 |
| GO:00027534 | Cervix | CC | cytoplasmic pattern recognition receptor signaling pathway | 18/2311 | 60/18723 | 2.26e-04 | 2.55e-03 | 18 |
| GO:00431237 | Cervix | CC | positive regulation of I-kappaB kinase/NF-kappaB signaling | 37/2311 | 186/18723 | 2.15e-03 | 1.55e-02 | 37 |
| GO:00305227 | Lung | IAC | intracellular receptor signaling pathway | 59/2061 | 265/18723 | 8.88e-08 | 8.50e-06 | 59 |
| GO:00072495 | Lung | IAC | I-kappaB kinase/NF-kappaB signaling | 56/2061 | 281/18723 | 7.39e-06 | 2.62e-04 | 56 |
| GO:00431226 | Lung | IAC | regulation of I-kappaB kinase/NF-kappaB signaling | 51/2061 | 249/18723 | 8.41e-06 | 2.87e-04 | 51 |
| GO:00431235 | Lung | IAC | positive regulation of I-kappaB kinase/NF-kappaB signaling | 38/2061 | 186/18723 | 1.19e-04 | 2.25e-03 | 38 |
| GO:0060271 | Lung | IAC | cilium assembly | 55/2061 | 337/18723 | 1.84e-03 | 1.88e-02 | 55 |
| GO:0044782 | Lung | IAC | cilium organization | 58/2061 | 368/18723 | 3.15e-03 | 2.75e-02 | 58 |
| GO:00027643 | Lung | IAC | immune response-regulating signaling pathway | 70/2061 | 468/18723 | 4.79e-03 | 3.72e-02 | 70 |
| GO:003052213 | Lung | AIS | intracellular receptor signaling pathway | 53/1849 | 265/18723 | 4.57e-07 | 3.55e-05 | 53 |
| GO:004312213 | Lung | AIS | regulation of I-kappaB kinase/NF-kappaB signaling | 41/1849 | 249/18723 | 7.57e-04 | 1.08e-02 | 41 |
| GO:000724913 | Lung | AIS | I-kappaB kinase/NF-kappaB signaling | 45/1849 | 281/18723 | 7.90e-04 | 1.11e-02 | 45 |
| GO:000724922 | Lung | AAH | I-kappaB kinase/NF-kappaB signaling | 21/613 | 281/18723 | 4.01e-04 | 1.78e-02 | 21 |
| GO:004312222 | Lung | AAH | regulation of I-kappaB kinase/NF-kappaB signaling | 19/613 | 249/18723 | 5.79e-04 | 2.23e-02 | 19 |
| GO:003052228 | Thyroid | PTC | intracellular receptor signaling pathway | 126/5968 | 265/18723 | 6.31e-08 | 1.31e-06 | 126 |
| Hugo Symbol | Variant Class | Variant Classification | dbSNP RS | HGVSc | HGVSp | HGVSp Short | SWISSPROT | BIOTYPE | SIFT | PolyPhen | Tumor Sample Barcode | Tissue | Histology | Sex | Age | Stage | Therapy Types | Drugs | Outcome |
| ALPK1 | SNV | Missense_Mutation | | c.3419N>T | p.Lys1140Ile | p.K1140I | Q96QP1 | protein_coding | deleterious(0) | probably_damaging(1) | TCGA-A2-A04U-01 | Breast | breast invasive carcinoma | Female | <65 | I/II | Chemotherapy | adriamycin | SD |
| ALPK1 | SNV | Missense_Mutation | novel | c.829N>C | p.Ser277Pro | p.S277P | Q96QP1 | protein_coding | deleterious(0) | possibly_damaging(0.77) | TCGA-A8-A06P-01 | Breast | breast invasive carcinoma | Female | <65 | III/IV | Unspecific | | SD |
| ALPK1 | SNV | Missense_Mutation | rs188866014 | c.184N>A | p.Val62Met | p.V62M | Q96QP1 | protein_coding | deleterious(0) | probably_damaging(0.999) | TCGA-A8-A08Z-01 | Breast | breast invasive carcinoma | Female | >=65 | III/IV | Unknown | Unknown | SD |
| ALPK1 | SNV | Missense_Mutation | rs551402838 | c.3262N>A | p.Ala1088Thr | p.A1088T | Q96QP1 | protein_coding | deleterious(0) | probably_damaging(0.999) | TCGA-AN-A0AR-01 | Breast | breast invasive carcinoma | Female | <65 | I/II | Unknown | Unknown | SD |
| ALPK1 | SNV | Missense_Mutation | | c.3592N>G | p.His1198Asp | p.H1198D | Q96QP1 | protein_coding | deleterious(0) | possibly_damaging(0.866) | TCGA-BH-A0AZ-01 | Breast | breast invasive carcinoma | Female | <65 | III/IV | Chemotherapy | doxorubicin | CR |
| ALPK1 | SNV | Missense_Mutation | | c.433N>T | p.Pro145Ser | p.P145S | Q96QP1 | protein_coding | deleterious(0) | probably_damaging(0.999) | TCGA-BH-A0HX-01 | Breast | breast invasive carcinoma | Female | <65 | I/II | Chemotherapy | adrimycin | SD |
| ALPK1 | SNV | Missense_Mutation | | c.3611N>G | p.Val1204Gly | p.V1204G | Q96QP1 | protein_coding | tolerated(0.38) | benign(0) | TCGA-D8-A1XQ-01 | Breast | breast invasive carcinoma | Female | >=65 | I/II | Unknown | Unknown | SD |
| ALPK1 | SNV | Missense_Mutation | | c.1282N>C | p.Asp428His | p.D428H | Q96QP1 | protein_coding | deleterious(0) | probably_damaging(0.968) | TCGA-E2-A10C-01 | Breast | breast invasive carcinoma | Female | <65 | I/II | Chemotherapy | cytoxan | SD |
| ALPK1 | SNV | Missense_Mutation | | c.2261N>G | p.Asn754Ser | p.N754S | Q96QP1 | protein_coding | tolerated(0.79) | benign(0) | TCGA-E9-A1R4-01 | Breast | breast invasive carcinoma | Female | >=65 | I/II | Chemotherapy | 5-fluorouracil | SD |
| ALPK1 | insertion | Frame_Shift_Ins | novel | c.2490_2491insCTCATATCGTTCTGCTTCTTGGTCTTCT | p.Asp831LeufsTer10 | p.D831Lfs*10 | Q96QP1 | protein_coding | | | TCGA-A2-A0D1-01 | Breast | breast invasive carcinoma | Female | >=65 | I/II | Chemotherapy | taxotere | SD |


