
|
|||||
|
 | |
| |
| |
| |
| |
| |
|
Gene: ALOX15B |
Gene summary for ALOX15B |
| Gene information | Species | Human | Gene symbol | ALOX15B | Gene ID | 247 |
| Gene name | arachidonate 15-lipoxygenase type B | |
| Gene Alias | 15-LOX-2 | |
| Cytomap | 17p13.1 | |
| Gene Type | protein-coding | GO ID | GO:0000003 | UniProtAcc | O15296 |
Top |
Malignant transformation analysis |
| Identification of the aberrant gene expression in precancerous and cancerous lesions by comparing the gene expression of stem-like cells in diseased tissues with normal stem cells |
| Entrez ID | Symbol | Replicates | Species | Organ | Tissue | Adj P-value | Log2FC | Malignancy |
| 247 | ALOX15B | P11T-E | Human | Esophagus | ESCC | 7.73e-16 | 7.25e-01 | 0.1426 |
| 247 | ALOX15B | P20T-E | Human | Esophagus | ESCC | 3.20e-07 | 1.82e-01 | 0.1124 |
| 247 | ALOX15B | P38T-E | Human | Esophagus | ESCC | 1.00e-03 | 1.87e-01 | 0.127 |
| 247 | ALOX15B | P47T-E | Human | Esophagus | ESCC | 3.50e-02 | 1.20e-01 | 0.1067 |
| 247 | ALOX15B | P62T-E | Human | Esophagus | ESCC | 6.87e-13 | 4.35e-01 | 0.1302 |
| 247 | ALOX15B | P65T-E | Human | Esophagus | ESCC | 9.96e-19 | 1.20e+00 | 0.0978 |
| 247 | ALOX15B | P74T-E | Human | Esophagus | ESCC | 2.11e-10 | 2.80e-01 | 0.1479 |
| 247 | ALOX15B | P79T-E | Human | Esophagus | ESCC | 2.06e-08 | 1.81e-01 | 0.1154 |
| 247 | ALOX15B | C51 | Human | Oral cavity | OSCC | 3.11e-02 | 2.89e-01 | 0.2674 |
| 247 | ALOX15B | C06 | Human | Oral cavity | OSCC | 4.37e-07 | 1.21e+00 | 0.2699 |
| 247 | ALOX15B | LP15 | Human | Oral cavity | LP | 3.25e-02 | 6.63e-01 | 0.2174 |
| Page: 1 |
| Tissue | Expression Dynamics | Abbreviation |
| Esophagus | 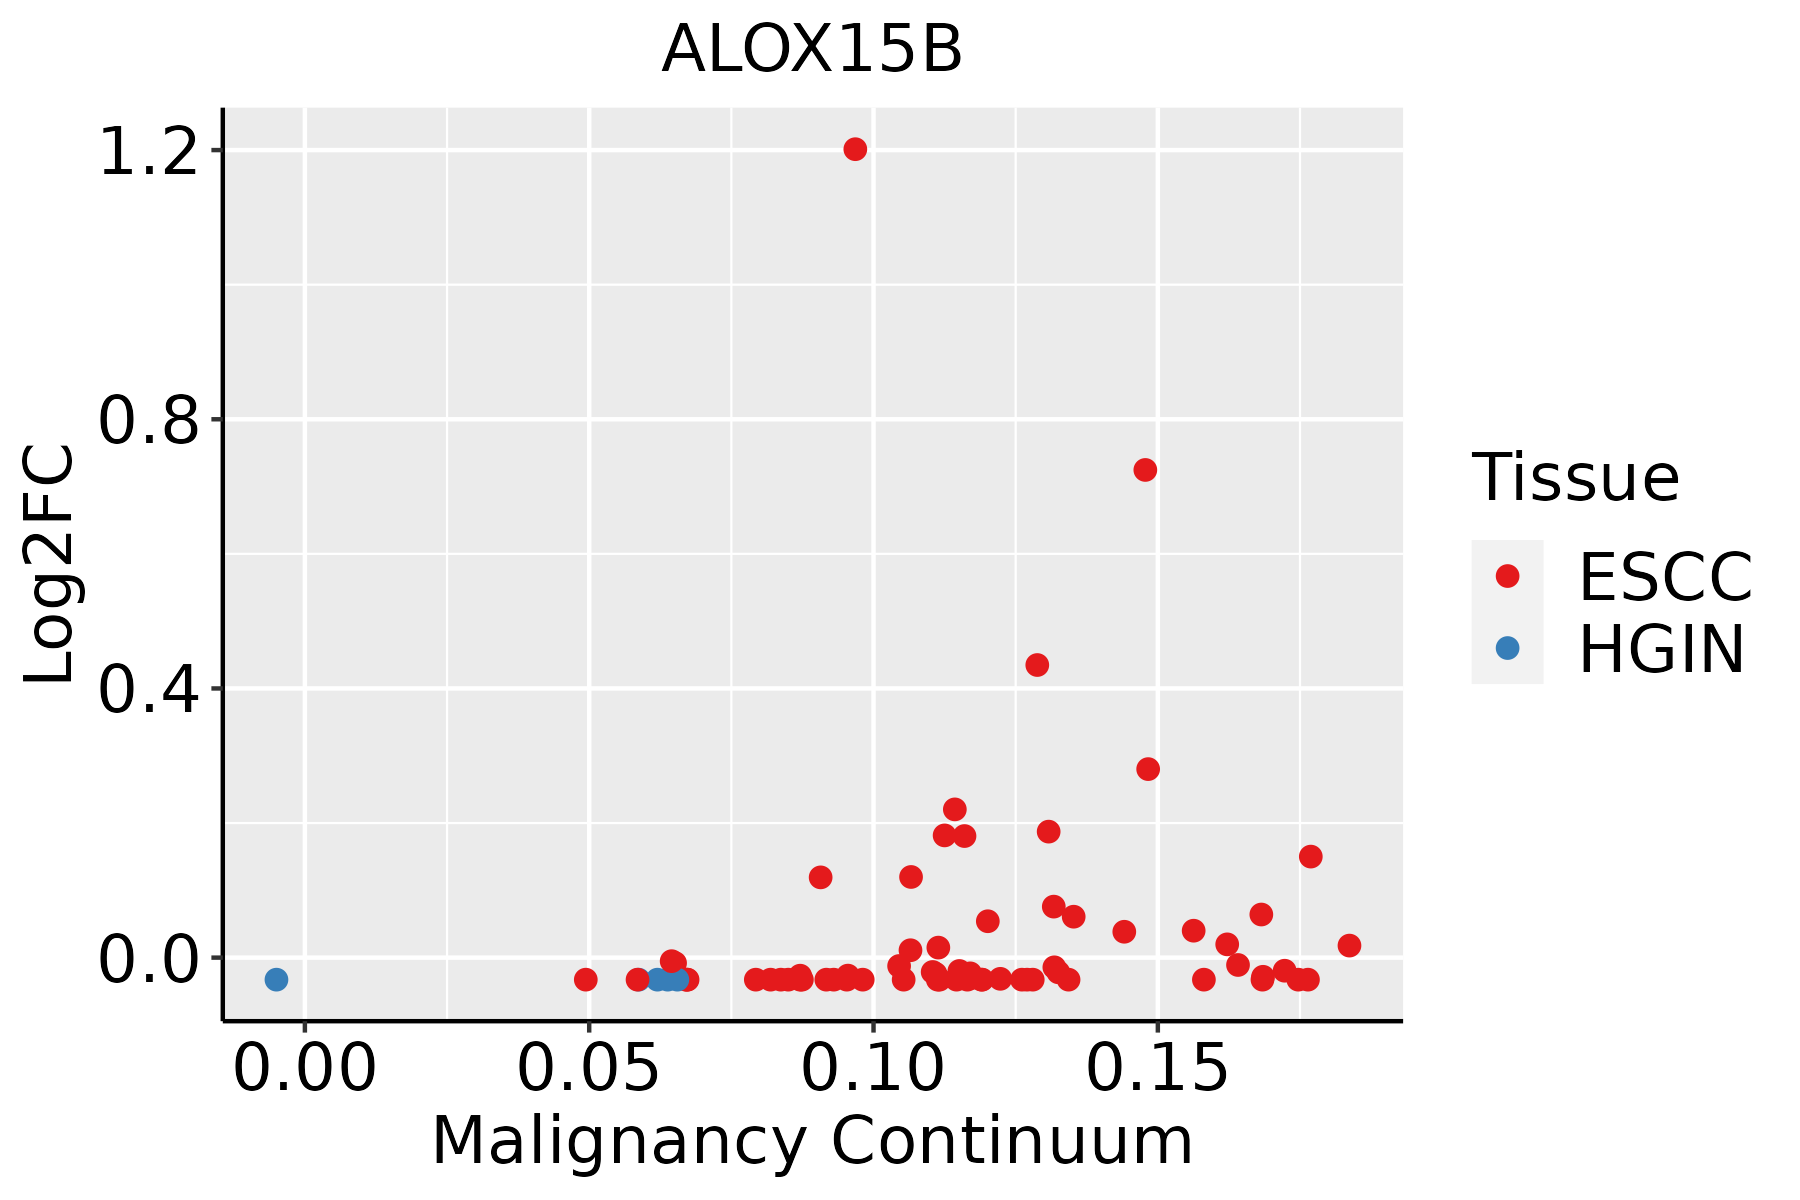 | ESCC: Esophageal squamous cell carcinoma |
| HGIN: High-grade intraepithelial neoplasias | ||
| LGIN: Low-grade intraepithelial neoplasias | ||
| Oral Cavity | 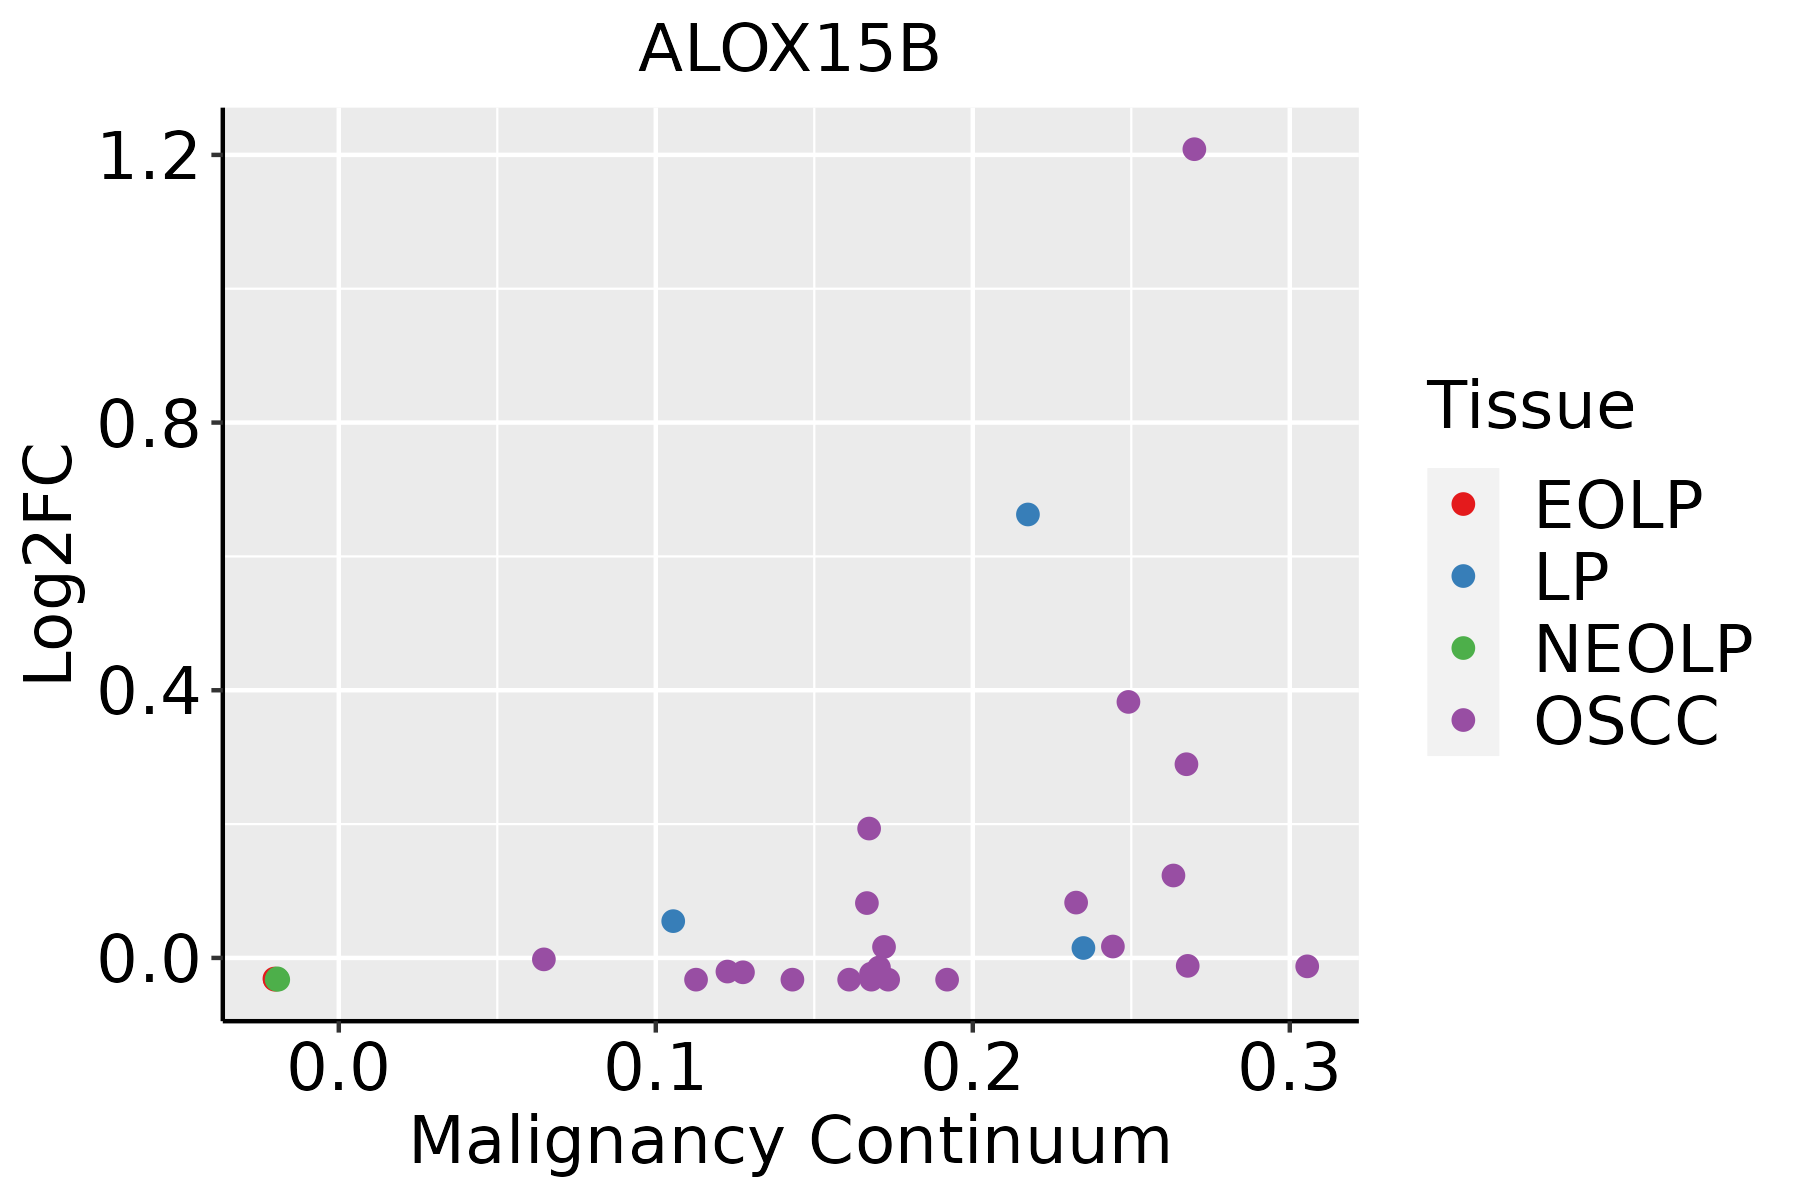 | EOLP: Erosive Oral lichen planus |
| LP: leukoplakia | ||
| NEOLP: Non-erosive oral lichen planus | ||
| OSCC: Oral squamous cell carcinoma | ||
| Prostate |  | BPH: Benign Prostatic Hyperplasia |
| ∗log2FC in expression of this searched gene in stem-like cells from each diseased tissue sample relative to stem-like cells in normal samples in each tissue plotted against the malignancy continuum. Samples are colored based on if they are from different disease stage. |
Top |
Malignant transformation related pathway analysis |
| Find out the enriched GO biological processes and KEGG pathways involved in transition from healthy to precancer to cancer |
| Tissue | Disease Stage | Enriched GO biological Processes |
| Colorectum | AD |  |
| Colorectum | SER |  |
| Colorectum | MSS |  |
| Colorectum | MSI-H |  |
| Colorectum | FAP |  |
| ∗Top 15 enriched GO BP terms are showed in the bar plot of each disease state in each tissue. Each row represents a significant GO biological process which is colored according to the -log10(p.adjust). |
| Page: 1 2 3 4 5 6 7 8 9 |
| GO ID | Tissue | Disease Stage | Description | Gene Ratio | Bg Ratio | pvalue | p.adjust | Count |
| GO:0048732111 | Esophagus | ESCC | gland development | 269/8552 | 436/18723 | 7.81e-12 | 2.95e-10 | 269 |
| GO:00457865 | Esophagus | ESCC | negative regulation of cell cycle | 236/8552 | 385/18723 | 3.62e-10 | 9.93e-09 | 236 |
| GO:0030522110 | Esophagus | ESCC | intracellular receptor signaling pathway | 170/8552 | 265/18723 | 8.58e-10 | 2.09e-08 | 170 |
| GO:00435888 | Esophagus | ESCC | skin development | 163/8552 | 263/18723 | 6.48e-08 | 1.14e-06 | 163 |
| GO:0061458110 | Esophagus | ESCC | reproductive system development | 247/8552 | 427/18723 | 2.24e-07 | 3.42e-06 | 247 |
| GO:004860818 | Esophagus | ESCC | reproductive structure development | 245/8552 | 424/18723 | 2.82e-07 | 4.14e-06 | 245 |
| GO:000854410 | Esophagus | ESCC | epidermis development | 193/8552 | 324/18723 | 2.87e-07 | 4.19e-06 | 193 |
| GO:00066446 | Esophagus | ESCC | phospholipid metabolic process | 218/8552 | 383/18723 | 5.37e-06 | 5.59e-05 | 218 |
| GO:00459267 | Esophagus | ESCC | negative regulation of growth | 148/8552 | 249/18723 | 7.88e-06 | 7.73e-05 | 148 |
| GO:000991310 | Esophagus | ESCC | epidermal cell differentiation | 122/8552 | 202/18723 | 1.69e-05 | 1.51e-04 | 122 |
| GO:00344407 | Esophagus | ESCC | lipid oxidation | 71/8552 | 108/18723 | 2.00e-05 | 1.74e-04 | 71 |
| GO:00456826 | Esophagus | ESCC | regulation of epidermis development | 46/8552 | 65/18723 | 3.65e-05 | 2.97e-04 | 46 |
| GO:00066318 | Esophagus | ESCC | fatty acid metabolic process | 217/8552 | 390/18723 | 4.21e-05 | 3.39e-04 | 217 |
| GO:00302167 | Esophagus | ESCC | keratinocyte differentiation | 86/8552 | 139/18723 | 8.53e-05 | 6.19e-04 | 86 |
| GO:00456046 | Esophagus | ESCC | regulation of epidermal cell differentiation | 41/8552 | 58/18723 | 1.00e-04 | 7.10e-04 | 41 |
| GO:00463948 | Esophagus | ESCC | carboxylic acid biosynthetic process | 175/8552 | 314/18723 | 1.98e-04 | 1.26e-03 | 175 |
| GO:00160538 | Esophagus | ESCC | organic acid biosynthetic process | 175/8552 | 316/18723 | 3.04e-04 | 1.82e-03 | 175 |
| GO:00308506 | Esophagus | ESCC | prostate gland development | 32/8552 | 45/18723 | 4.87e-04 | 2.70e-03 | 32 |
| GO:00456167 | Esophagus | ESCC | regulation of keratinocyte differentiation | 26/8552 | 37/18723 | 2.16e-03 | 9.62e-03 | 26 |
| GO:000181916 | Esophagus | ESCC | positive regulation of cytokine production | 244/8552 | 467/18723 | 2.29e-03 | 1.01e-02 | 244 |
| Page: 1 2 3 4 5 |
| Pathway ID | Tissue | Disease Stage | Description | Gene Ratio | Bg Ratio | pvalue | p.adjust | qvalue | Count |
| Page: 1 |
Top |
Cell-cell communication analysis |
| Identification of potential cell-cell interactions between two cell types and their ligand-receptor pairs for different disease states |
| Ligand | Receptor | LRpair | Pathway | Tissue | Disease Stage |
| Page: 1 |
Top |
Single-cell gene regulatory network inference analysis |
| Find out the significant the regulons (TFs) and the target genes of each regulon across cell types for different disease states |
| TF | Cell Type | Tissue | Disease Stage | Target Gene | RSS | Regulon Activity |
| ∗The dot plots of a searched regulon are shown for all cell subpopulations in each disease state of each tissue based on the regulon specific score inferred using pySCENIC and by calculating the average expression. |
| Page: 1 |
Top |
Somatic mutation of malignant transformation related genes |
| Annotation of somatic variants for genes involved in malignant transformation |
| Hugo Symbol | Variant Class | Variant Classification | dbSNP RS | HGVSc | HGVSp | HGVSp Short | SWISSPROT | BIOTYPE | SIFT | PolyPhen | Tumor Sample Barcode | Tissue | Histology | Sex | Age | Stage | Therapy Types | Drugs | Outcome |
| ALOX15B | SNV | Missense_Mutation | c.1732N>T | p.Pro578Ser | p.P578S | O15296 | protein_coding | deleterious(0.01) | probably_damaging(0.967) | TCGA-AN-A0AK-01 | Breast | breast invasive carcinoma | Female | >=65 | I/II | Unknown | Unknown | SD | |
| ALOX15B | SNV | Missense_Mutation | rs759189692 | c.701N>G | p.Glu234Gly | p.E234G | O15296 | protein_coding | deleterious(0) | probably_damaging(0.994) | TCGA-AQ-A04H-01 | Breast | breast invasive carcinoma | Female | <65 | III/IV | Chemotherapy | taxotere | SD |
| ALOX15B | SNV | Missense_Mutation | c.150N>T | p.Glu50Asp | p.E50D | O15296 | protein_coding | tolerated(0.36) | benign(0.024) | TCGA-BH-A18G-01 | Breast | breast invasive carcinoma | Female | >=65 | I/II | Unknown | Unknown | SD | |
| ALOX15B | SNV | Missense_Mutation | rs867086223 | c.50N>A | p.Gly17Asp | p.G17D | O15296 | protein_coding | deleterious(0) | probably_damaging(0.991) | TCGA-BH-A1F6-01 | Breast | breast invasive carcinoma | Female | <65 | III/IV | Unknown | Unknown | SD |
| ALOX15B | SNV | Missense_Mutation | rs771462763 | c.1900N>T | p.Arg634Trp | p.R634W | O15296 | protein_coding | deleterious(0.01) | benign(0.173) | TCGA-E2-A1IO-01 | Breast | breast invasive carcinoma | Female | <65 | I/II | Chemotherapy | docetaxel | SD |
| ALOX15B | insertion | Frame_Shift_Ins | novel | c.613_614insACTTTAATTGCAAATTTTTCTTT | p.Gly205AspfsTer14 | p.G205Dfs*14 | O15296 | protein_coding | TCGA-A2-A0D1-01 | Breast | breast invasive carcinoma | Female | >=65 | I/II | Chemotherapy | taxotere | SD | ||
| ALOX15B | deletion | Frame_Shift_Del | novel | c.810_811delNN | p.Leu272GlyfsTer9 | p.L272Gfs*9 | O15296 | protein_coding | TCGA-JL-A3YW-01 | Breast | breast invasive carcinoma | Female | <65 | I/II | Unknown | Unknown | SD | ||
| ALOX15B | SNV | Missense_Mutation | c.882N>G | p.Ile294Met | p.I294M | O15296 | protein_coding | deleterious(0.02) | possibly_damaging(0.491) | TCGA-C5-A1BK-01 | Cervix | cervical & endocervical cancer | Female | <65 | I/II | Unknown | Unknown | SD | |
| ALOX15B | SNV | Missense_Mutation | c.1540N>C | p.Glu514Gln | p.E514Q | O15296 | protein_coding | deleterious(0) | probably_damaging(0.976) | TCGA-EK-A2RK-01 | Cervix | cervical & endocervical cancer | Female | >=65 | I/II | Unknown | Unknown | SD | |
| ALOX15B | SNV | Missense_Mutation | novel | c.1564N>C | p.Asn522His | p.N522H | O15296 | protein_coding | deleterious(0) | benign(0.146) | TCGA-HM-A4S6-01 | Cervix | cervical & endocervical cancer | Female | <65 | III/IV | Chemotherapy | cisplatin | CR |
| Page: 1 2 3 4 5 6 7 8 9 |
Top |
Related drugs of malignant transformation related genes |
| Identification of chemicals and drugs interact with genes involved in malignant transfromation |
| (DGIdb 4.0) |
| Entrez ID | Symbol | Category | Interaction Types | Drug Claim Name | Drug Name | PMIDs |
| 247 | ALOX15B | DRUGGABLE GENOME, ENZYME | E324 | E324 | ||
| 247 | ALOX15B | DRUGGABLE GENOME, ENZYME | DIENESTROL | DIENESTROL | ||
| 247 | ALOX15B | DRUGGABLE GENOME, ENZYME | 3,3',4'-TRIHYDROXYFLAVONE | CHEMBL122701 | ||
| 247 | ALOX15B | DRUGGABLE GENOME, ENZYME | CAPSAZEPINE | CAPSAZEPINE | ||
| 247 | ALOX15B | DRUGGABLE GENOME, ENZYME | HEXACHLOROPHENE | HEXACHLOROPHENE | ||
| 247 | ALOX15B | DRUGGABLE GENOME, ENZYME | NORDIHYDROGUAIARETIC ACID | NORDIHYDROGUAIARETIC ACID | ||
| 247 | ALOX15B | DRUGGABLE GENOME, ENZYME | TYRPHOSTIN AG 879 | TYRPHOSTIN AG 879 | ||
| 247 | ALOX15B | DRUGGABLE GENOME, ENZYME | N,N'-DIPHENYL-P-PHENYLENEDIAMINE | N,N'-DIPHENYL-P-PHENYLENEDIAMINE | ||
| 247 | ALOX15B | DRUGGABLE GENOME, ENZYME | NSC-632536 | CHEMBL1367933 | ||
| 247 | ALOX15B | DRUGGABLE GENOME, ENZYME | DIHYDROXIDINE | DIHYDROXIDINE |
| Page: 1 2 3 4 5 6 7 |

Copyright 2023-Present -The University of Texas Health Science Center at Houston |