
|
|||||
|
 | |
| |
| |
| |
| |
| |
|
Gene: ALOX15 |
Gene summary for ALOX15 |
| Gene information | Species | Human | Gene symbol | ALOX15 | Gene ID | 246 |
| Gene name | arachidonate 15-lipoxygenase | |
| Gene Alias | 12-LOX | |
| Cytomap | 17p13.2 | |
| Gene Type | protein-coding | GO ID | GO:0000165 | UniProtAcc | P16050 |
Top |
Malignant transformation analysis |
| Identification of the aberrant gene expression in precancerous and cancerous lesions by comparing the gene expression of stem-like cells in diseased tissues with normal stem cells |
| Entrez ID | Symbol | Replicates | Species | Organ | Tissue | Adj P-value | Log2FC | Malignancy |
| 246 | ALOX15 | LZE2T | Human | Esophagus | ESCC | 5.44e-10 | 6.52e-01 | 0.082 |
| 246 | ALOX15 | LZE5T | Human | Esophagus | ESCC | 1.57e-02 | 2.22e-01 | 0.0514 |
| 246 | ALOX15 | LZE24T | Human | Esophagus | ESCC | 6.29e-04 | 1.57e-01 | 0.0596 |
| 246 | ALOX15 | LZE21T | Human | Esophagus | ESCC | 9.73e-05 | 5.09e-01 | 0.0655 |
| 246 | ALOX15 | P4T-E | Human | Esophagus | ESCC | 8.00e-03 | 1.77e-01 | 0.1323 |
| 246 | ALOX15 | P8T-E | Human | Esophagus | ESCC | 9.78e-30 | 8.66e-01 | 0.0889 |
| 246 | ALOX15 | P12T-E | Human | Esophagus | ESCC | 4.31e-06 | 2.73e-01 | 0.1122 |
| 246 | ALOX15 | P15T-E | Human | Esophagus | ESCC | 2.65e-19 | 6.90e-01 | 0.1149 |
| 246 | ALOX15 | P20T-E | Human | Esophagus | ESCC | 3.20e-07 | 2.14e-01 | 0.1124 |
| 246 | ALOX15 | P22T-E | Human | Esophagus | ESCC | 2.02e-06 | 1.49e-01 | 0.1236 |
| 246 | ALOX15 | P26T-E | Human | Esophagus | ESCC | 2.78e-38 | 8.26e-01 | 0.1276 |
| 246 | ALOX15 | P27T-E | Human | Esophagus | ESCC | 4.16e-22 | 5.12e-01 | 0.1055 |
| 246 | ALOX15 | P30T-E | Human | Esophagus | ESCC | 4.44e-04 | 2.29e-01 | 0.137 |
| 246 | ALOX15 | P62T-E | Human | Esophagus | ESCC | 1.44e-17 | 5.17e-01 | 0.1302 |
| 246 | ALOX15 | P65T-E | Human | Esophagus | ESCC | 3.23e-15 | 3.99e-01 | 0.0978 |
| 246 | ALOX15 | P74T-E | Human | Esophagus | ESCC | 3.33e-12 | 4.59e-01 | 0.1479 |
| 246 | ALOX15 | P75T-E | Human | Esophagus | ESCC | 3.52e-19 | 5.30e-01 | 0.1125 |
| 246 | ALOX15 | P84T-E | Human | Esophagus | ESCC | 1.06e-03 | 2.67e-01 | 0.0933 |
| 246 | ALOX15 | P127T-E | Human | Esophagus | ESCC | 7.76e-04 | 1.65e-01 | 0.0826 |
| 246 | ALOX15 | P128T-E | Human | Esophagus | ESCC | 9.55e-03 | 1.47e-01 | 0.1241 |
| Page: 1 |
| Tissue | Expression Dynamics | Abbreviation |
| Esophagus | 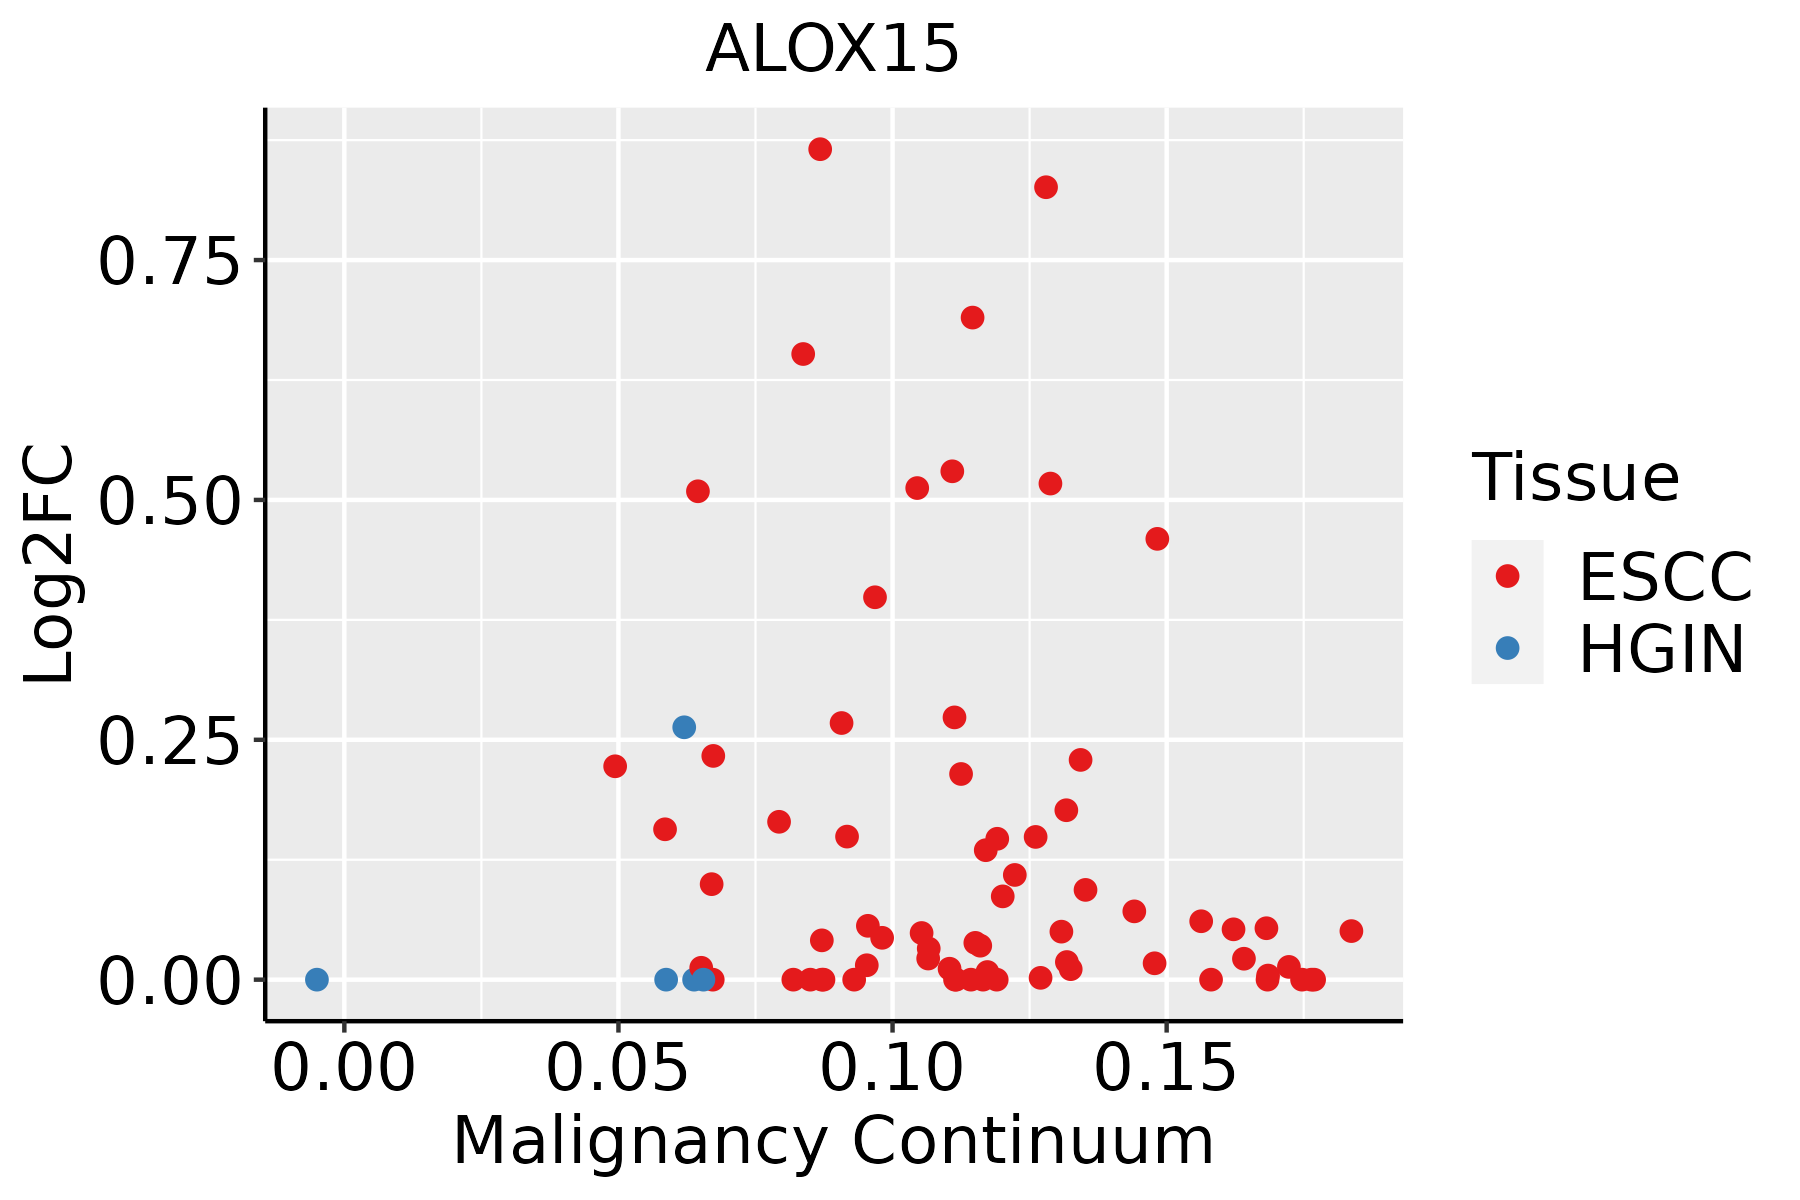 | ESCC: Esophageal squamous cell carcinoma |
| HGIN: High-grade intraepithelial neoplasias | ||
| LGIN: Low-grade intraepithelial neoplasias |
| ∗log2FC in expression of this searched gene in stem-like cells from each diseased tissue sample relative to stem-like cells in normal samples in each tissue plotted against the malignancy continuum. Samples are colored based on if they are from different disease stage. |
Top |
Malignant transformation related pathway analysis |
| Find out the enriched GO biological processes and KEGG pathways involved in transition from healthy to precancer to cancer |
| Tissue | Disease Stage | Enriched GO biological Processes |
| Colorectum | AD |  |
| Colorectum | SER |  |
| Colorectum | MSS |  |
| Colorectum | MSI-H |  |
| Colorectum | FAP |  |
| ∗Top 15 enriched GO BP terms are showed in the bar plot of each disease state in each tissue. Each row represents a significant GO biological process which is colored according to the -log10(p.adjust). |
| Page: 1 2 3 4 5 6 7 8 9 |
| GO ID | Tissue | Disease Stage | Description | Gene Ratio | Bg Ratio | pvalue | p.adjust | Count |
| GO:0034976111 | Esophagus | ESCC | response to endoplasmic reticulum stress | 192/8552 | 256/18723 | 7.15e-22 | 1.30e-19 | 192 |
| GO:0043254111 | Esophagus | ESCC | regulation of protein-containing complex assembly | 278/8552 | 428/18723 | 3.81e-16 | 2.77e-14 | 278 |
| GO:0031334111 | Esophagus | ESCC | positive regulation of protein-containing complex assembly | 166/8552 | 237/18723 | 2.06e-14 | 1.07e-12 | 166 |
| GO:0048732111 | Esophagus | ESCC | gland development | 269/8552 | 436/18723 | 7.81e-12 | 2.95e-10 | 269 |
| GO:1902905111 | Esophagus | ESCC | positive regulation of supramolecular fiber organization | 142/8552 | 209/18723 | 5.51e-11 | 1.76e-09 | 142 |
| GO:1902903111 | Esophagus | ESCC | regulation of supramolecular fiber organization | 237/8552 | 383/18723 | 9.06e-11 | 2.75e-09 | 237 |
| GO:00457865 | Esophagus | ESCC | negative regulation of cell cycle | 236/8552 | 385/18723 | 3.62e-10 | 9.93e-09 | 236 |
| GO:0030522110 | Esophagus | ESCC | intracellular receptor signaling pathway | 170/8552 | 265/18723 | 8.58e-10 | 2.09e-08 | 170 |
| GO:00086544 | Esophagus | ESCC | phospholipid biosynthetic process | 162/8552 | 253/18723 | 2.59e-09 | 5.73e-08 | 162 |
| GO:005149520 | Esophagus | ESCC | positive regulation of cytoskeleton organization | 147/8552 | 226/18723 | 2.93e-09 | 6.38e-08 | 147 |
| GO:003158919 | Esophagus | ESCC | cell-substrate adhesion | 221/8552 | 363/18723 | 3.06e-09 | 6.62e-08 | 221 |
| GO:001081020 | Esophagus | ESCC | regulation of cell-substrate adhesion | 144/8552 | 221/18723 | 3.55e-09 | 7.45e-08 | 144 |
| GO:0051258111 | Esophagus | ESCC | protein polymerization | 183/8552 | 297/18723 | 1.94e-08 | 3.75e-07 | 183 |
| GO:000701527 | Esophagus | ESCC | actin filament organization | 259/8552 | 442/18723 | 2.37e-08 | 4.50e-07 | 259 |
| GO:0032273111 | Esophagus | ESCC | positive regulation of protein polymerization | 95/8552 | 138/18723 | 2.97e-08 | 5.57e-07 | 95 |
| GO:003253520 | Esophagus | ESCC | regulation of cellular component size | 227/8552 | 383/18723 | 4.77e-08 | 8.60e-07 | 227 |
| GO:004578527 | Esophagus | ESCC | positive regulation of cell adhesion | 255/8552 | 437/18723 | 5.07e-08 | 9.11e-07 | 255 |
| GO:003010018 | Esophagus | ESCC | regulation of endocytosis | 135/8552 | 211/18723 | 5.75e-08 | 1.02e-06 | 135 |
| GO:00464744 | Esophagus | ESCC | glycerophospholipid biosynthetic process | 135/8552 | 211/18723 | 5.75e-08 | 1.02e-06 | 135 |
| GO:00435888 | Esophagus | ESCC | skin development | 163/8552 | 263/18723 | 6.48e-08 | 1.14e-06 | 163 |
| Page: 1 2 3 4 5 6 7 |
| Pathway ID | Tissue | Disease Stage | Description | Gene Ratio | Bg Ratio | pvalue | p.adjust | qvalue | Count |
| Page: 1 |
Top |
Cell-cell communication analysis |
| Identification of potential cell-cell interactions between two cell types and their ligand-receptor pairs for different disease states |
| Ligand | Receptor | LRpair | Pathway | Tissue | Disease Stage |
| Page: 1 |
Top |
Single-cell gene regulatory network inference analysis |
| Find out the significant the regulons (TFs) and the target genes of each regulon across cell types for different disease states |
| TF | Cell Type | Tissue | Disease Stage | Target Gene | RSS | Regulon Activity |
| ∗The dot plots of a searched regulon are shown for all cell subpopulations in each disease state of each tissue based on the regulon specific score inferred using pySCENIC and by calculating the average expression. |
| Page: 1 |
Top |
Somatic mutation of malignant transformation related genes |
| Annotation of somatic variants for genes involved in malignant transformation |
| Hugo Symbol | Variant Class | Variant Classification | dbSNP RS | HGVSc | HGVSp | HGVSp Short | SWISSPROT | BIOTYPE | SIFT | PolyPhen | Tumor Sample Barcode | Tissue | Histology | Sex | Age | Stage | Therapy Types | Drugs | Outcome |
| ALOX15 | SNV | Missense_Mutation | novel | c.1196N>A | p.Ile399Asn | p.I399N | P16050 | protein_coding | deleterious(0) | probably_damaging(0.997) | TCGA-5L-AAT1-01 | Breast | breast invasive carcinoma | Female | <65 | III/IV | Hormone Therapy | letrozol | SD |
| ALOX15 | SNV | Missense_Mutation | c.948N>G | p.Ile316Met | p.I316M | P16050 | protein_coding | deleterious(0) | probably_damaging(0.911) | TCGA-A7-A26F-01 | Breast | breast invasive carcinoma | Female | <65 | I/II | Chemotherapy | taxotere | SD | |
| ALOX15 | SNV | Missense_Mutation | novel | c.1747T>C | p.Phe583Leu | p.F583L | P16050 | protein_coding | tolerated(0.59) | benign(0.003) | TCGA-D8-A1XK-01 | Breast | breast invasive carcinoma | Female | <65 | I/II | Chemotherapy | doxorubicine+cyclophosphamide | SD |
| ALOX15 | SNV | Missense_Mutation | c.1621N>A | p.Ala541Thr | p.A541T | P16050 | protein_coding | deleterious(0.02) | benign(0.109) | TCGA-E2-A1LK-01 | Breast | breast invasive carcinoma | Female | >=65 | III/IV | Unknown | Unknown | PD | |
| ALOX15 | insertion | Frame_Shift_Ins | novel | c.1850_1851insATCACTTGGCAGCTGGGCAGACGCCAGCCCGTTA | p.Glu618SerfsTer12 | p.E618Sfs*12 | P16050 | protein_coding | TCGA-A8-A085-01 | Breast | breast invasive carcinoma | Male | <65 | I/II | Hormone Therapy | tamoxiphen | SD | ||
| ALOX15 | SNV | Missense_Mutation | rs143365387 | c.1056N>A | p.Phe352Leu | p.F352L | P16050 | protein_coding | deleterious(0.02) | benign(0.257) | TCGA-AA-3496-01 | Colorectum | colon adenocarcinoma | Female | >=65 | I/II | Unknown | Unknown | SD |
| ALOX15 | SNV | Missense_Mutation | novel | c.857C>T | p.Ala286Val | p.A286V | P16050 | protein_coding | deleterious(0.03) | possibly_damaging(0.62) | TCGA-AA-A010-01 | Colorectum | colon adenocarcinoma | Female | <65 | I/II | Chemotherapy | folinic | CR |
| ALOX15 | SNV | Missense_Mutation | rs760254381 | c.862N>A | p.Val288Ile | p.V288I | P16050 | protein_coding | tolerated(0.15) | benign(0.006) | TCGA-CM-6674-01 | Colorectum | colon adenocarcinoma | Male | <65 | I/II | Unknown | Unknown | SD |
| ALOX15 | SNV | Missense_Mutation | rs763395191 | c.1345N>A | p.Asp449Asn | p.D449N | P16050 | protein_coding | deleterious(0.05) | benign(0.255) | TCGA-G4-6304-01 | Colorectum | colon adenocarcinoma | Female | >=65 | I/II | Chemotherapy | fluorouracil | PD |
| ALOX15 | SNV | Missense_Mutation | rs139214774 | c.271N>A | p.Glu91Lys | p.E91K | P16050 | protein_coding | tolerated(0.19) | benign(0.009) | TCGA-AG-3731-01 | Colorectum | rectum adenocarcinoma | Male | >=65 | III/IV | Chemotherapy | folinic | PR |
| Page: 1 2 3 4 5 6 |
Top |
Related drugs of malignant transformation related genes |
| Identification of chemicals and drugs interact with genes involved in malignant transfromation |
| (DGIdb 4.0) |
| Entrez ID | Symbol | Category | Interaction Types | Drug Claim Name | Drug Name | PMIDs |
| 246 | ALOX15 | ENZYME, DRUGGABLE GENOME | inhibitor | 381744944 | ||
| 246 | ALOX15 | ENZYME, DRUGGABLE GENOME | FEXOFENADINE HYDROCHLORIDE | FEXOFENADINE HYDROCHLORIDE | ||
| 246 | ALOX15 | ENZYME, DRUGGABLE GENOME | CAFFEIC ACID PHENETHYL ESTER | CAFFEIC ACID PHENETHYL ESTER | ||
| 246 | ALOX15 | ENZYME, DRUGGABLE GENOME | ATHRAQUINONES A | ATHRAQUINONES A | ||
| 246 | ALOX15 | ENZYME, DRUGGABLE GENOME | QUINOXALINE-2-CARBOXYLIC ACID | CHEMBL151797 | ||
| 246 | ALOX15 | ENZYME, DRUGGABLE GENOME | MERCURIC CHLORIDE | MERCURIC CHLORIDE | ||
| 246 | ALOX15 | ENZYME, DRUGGABLE GENOME | CISPLATIN | CISPLATIN | ||
| 246 | ALOX15 | ENZYME, DRUGGABLE GENOME | EHNA | EHNA | ||
| 246 | ALOX15 | ENZYME, DRUGGABLE GENOME | 3,4-DIDESMETHYL-5-DESHYDROXY-3'-ETHOXYSCLEROIN | 3,4-DIDESMETHYL-5-DESHYDROXY-3'-ETHOXYSCLEROIN | ||
| 246 | ALOX15 | ENZYME, DRUGGABLE GENOME | DITHIOLETHIONE | DITHIOLETHIONE |
| Page: 1 2 3 4 5 6 7 8 9 10 11 12 13 14 15 16 |

Copyright 2023-Present -The University of Texas Health Science Center at Houston |