
|
|||||
|
 | |
| |
| |
| |
| |
| |
|
Gene: ALMS1 |
Gene summary for ALMS1 |
| Gene information | Species | Human | Gene symbol | ALMS1 | Gene ID | 7840 |
| Gene name | ALMS1 centrosome and basal body associated protein | |
| Gene Alias | ALSS | |
| Cytomap | 2p13.1 | |
| Gene Type | protein-coding | GO ID | GO:0000226 | UniProtAcc | Q8TCU4 |
Top |
Malignant transformation analysis |
| Identification of the aberrant gene expression in precancerous and cancerous lesions by comparing the gene expression of stem-like cells in diseased tissues with normal stem cells |
| Entrez ID | Symbol | Replicates | Species | Organ | Tissue | Adj P-value | Log2FC | Malignancy |
| 7840 | ALMS1 | LZE2T | Human | Esophagus | ESCC | 1.52e-08 | 5.99e-01 | 0.082 |
| 7840 | ALMS1 | LZE4T | Human | Esophagus | ESCC | 2.18e-06 | 1.94e-01 | 0.0811 |
| 7840 | ALMS1 | LZE7T | Human | Esophagus | ESCC | 2.07e-09 | 3.91e-01 | 0.0667 |
| 7840 | ALMS1 | LZE20T | Human | Esophagus | ESCC | 1.26e-02 | 1.11e-01 | 0.0662 |
| 7840 | ALMS1 | LZE24T | Human | Esophagus | ESCC | 2.66e-16 | 3.46e-01 | 0.0596 |
| 7840 | ALMS1 | LZE21T | Human | Esophagus | ESCC | 8.02e-04 | 2.45e-01 | 0.0655 |
| 7840 | ALMS1 | LZE6T | Human | Esophagus | ESCC | 9.61e-05 | 1.96e-01 | 0.0845 |
| 7840 | ALMS1 | P1T-E | Human | Esophagus | ESCC | 2.44e-06 | 2.69e-01 | 0.0875 |
| 7840 | ALMS1 | P2T-E | Human | Esophagus | ESCC | 1.15e-19 | 3.87e-01 | 0.1177 |
| 7840 | ALMS1 | P4T-E | Human | Esophagus | ESCC | 4.13e-17 | 3.43e-01 | 0.1323 |
| 7840 | ALMS1 | P5T-E | Human | Esophagus | ESCC | 8.46e-06 | 1.22e-01 | 0.1327 |
| 7840 | ALMS1 | P8T-E | Human | Esophagus | ESCC | 7.53e-09 | 1.66e-01 | 0.0889 |
| 7840 | ALMS1 | P10T-E | Human | Esophagus | ESCC | 4.34e-12 | 2.25e-01 | 0.116 |
| 7840 | ALMS1 | P11T-E | Human | Esophagus | ESCC | 6.74e-09 | 2.86e-01 | 0.1426 |
| 7840 | ALMS1 | P12T-E | Human | Esophagus | ESCC | 1.07e-12 | 3.25e-01 | 0.1122 |
| 7840 | ALMS1 | P15T-E | Human | Esophagus | ESCC | 3.34e-06 | 1.72e-01 | 0.1149 |
| 7840 | ALMS1 | P16T-E | Human | Esophagus | ESCC | 8.19e-10 | 2.12e-01 | 0.1153 |
| 7840 | ALMS1 | P17T-E | Human | Esophagus | ESCC | 2.68e-03 | 1.82e-01 | 0.1278 |
| 7840 | ALMS1 | P20T-E | Human | Esophagus | ESCC | 3.32e-24 | 4.80e-01 | 0.1124 |
| 7840 | ALMS1 | P21T-E | Human | Esophagus | ESCC | 7.33e-10 | 2.22e-01 | 0.1617 |
| Page: 1 2 3 4 |
| Tissue | Expression Dynamics | Abbreviation |
| Esophagus | 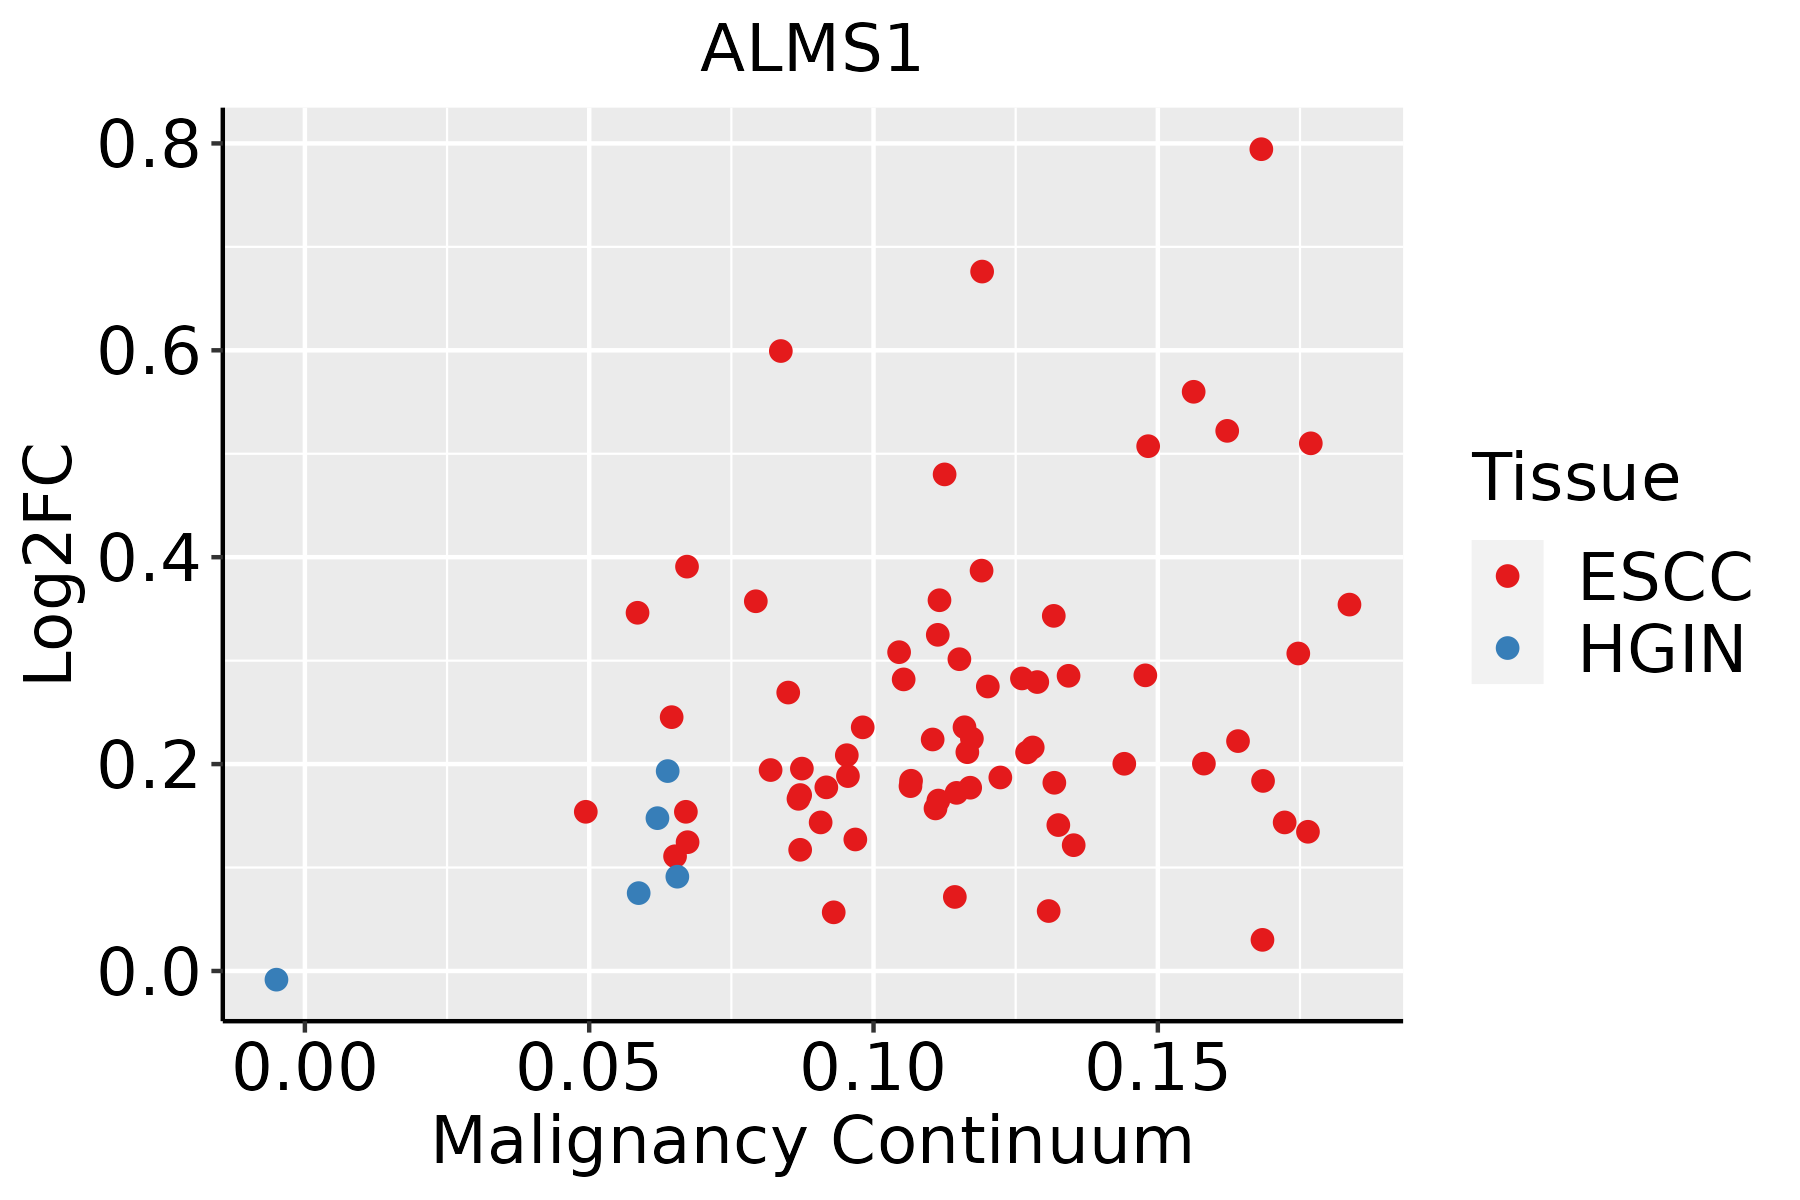 | ESCC: Esophageal squamous cell carcinoma |
| HGIN: High-grade intraepithelial neoplasias | ||
| LGIN: Low-grade intraepithelial neoplasias |
| ∗log2FC in expression of this searched gene in stem-like cells from each diseased tissue sample relative to stem-like cells in normal samples in each tissue plotted against the malignancy continuum. Samples are colored based on if they are from different disease stage. |
Top |
Malignant transformation related pathway analysis |
| Find out the enriched GO biological processes and KEGG pathways involved in transition from healthy to precancer to cancer |
| Tissue | Disease Stage | Enriched GO biological Processes |
| Colorectum | AD |  |
| Colorectum | SER |  |
| Colorectum | MSS |  |
| Colorectum | MSI-H |  |
| Colorectum | FAP |  |
| ∗Top 15 enriched GO BP terms are showed in the bar plot of each disease state in each tissue. Each row represents a significant GO biological process which is colored according to the -log10(p.adjust). |
| Page: 1 2 3 4 5 6 7 8 9 |
| GO ID | Tissue | Disease Stage | Description | Gene Ratio | Bg Ratio | pvalue | p.adjust | Count |
| GO:001619715 | Esophagus | ESCC | endosomal transport | 168/8552 | 230/18723 | 2.28e-17 | 1.93e-15 | 168 |
| GO:1902903111 | Esophagus | ESCC | regulation of supramolecular fiber organization | 237/8552 | 383/18723 | 9.06e-11 | 2.75e-09 | 237 |
| GO:000701527 | Esophagus | ESCC | actin filament organization | 259/8552 | 442/18723 | 2.37e-08 | 4.50e-07 | 259 |
| GO:0032970111 | Esophagus | ESCC | regulation of actin filament-based process | 231/8552 | 397/18723 | 2.91e-07 | 4.20e-06 | 231 |
| GO:0032956111 | Esophagus | ESCC | regulation of actin cytoskeleton organization | 210/8552 | 358/18723 | 4.40e-07 | 6.00e-06 | 210 |
| GO:011005327 | Esophagus | ESCC | regulation of actin filament organization | 166/8552 | 278/18723 | 1.54e-06 | 1.85e-05 | 166 |
| GO:190211514 | Esophagus | ESCC | regulation of organelle assembly | 116/8552 | 186/18723 | 3.15e-06 | 3.53e-05 | 116 |
| GO:005101727 | Esophagus | ESCC | actin filament bundle assembly | 100/8552 | 157/18723 | 3.87e-06 | 4.17e-05 | 100 |
| GO:00070982 | Esophagus | ESCC | centrosome cycle | 85/8552 | 130/18723 | 4.41e-06 | 4.69e-05 | 85 |
| GO:00310233 | Esophagus | ESCC | microtubule organizing center organization | 92/8552 | 143/18723 | 5.04e-06 | 5.31e-05 | 92 |
| GO:006157227 | Esophagus | ESCC | actin filament bundle organization | 101/8552 | 161/18723 | 9.22e-06 | 8.82e-05 | 101 |
| GO:003003820 | Esophagus | ESCC | contractile actin filament bundle assembly | 67/8552 | 106/18723 | 2.03e-04 | 1.28e-03 | 67 |
| GO:004314920 | Esophagus | ESCC | stress fiber assembly | 67/8552 | 106/18723 | 2.03e-04 | 1.28e-03 | 67 |
| GO:00328864 | Esophagus | ESCC | regulation of microtubule-based process | 134/8552 | 240/18723 | 9.44e-04 | 4.80e-03 | 134 |
| GO:003223120 | Esophagus | ESCC | regulation of actin filament bundle assembly | 64/8552 | 105/18723 | 1.15e-03 | 5.70e-03 | 64 |
| GO:005149225 | Esophagus | ESCC | regulation of stress fiber assembly | 56/8552 | 91/18723 | 1.66e-03 | 7.68e-03 | 56 |
| GO:003103219 | Esophagus | ESCC | actomyosin structure organization | 108/8552 | 196/18723 | 4.86e-03 | 1.88e-02 | 108 |
| GO:011002025 | Esophagus | ESCC | regulation of actomyosin structure organization | 59/8552 | 100/18723 | 4.98e-03 | 1.91e-02 | 59 |
| GO:01201624 | Esophagus | ESCC | positive regulation of cold-induced thermogenesis | 57/8552 | 97/18723 | 6.43e-03 | 2.35e-02 | 57 |
| GO:01061066 | Esophagus | ESCC | cold-induced thermogenesis | 80/8552 | 144/18723 | 1.07e-02 | 3.65e-02 | 80 |
| Page: 1 2 |
| Pathway ID | Tissue | Disease Stage | Description | Gene Ratio | Bg Ratio | pvalue | p.adjust | qvalue | Count |
| Page: 1 |
Top |
Cell-cell communication analysis |
| Identification of potential cell-cell interactions between two cell types and their ligand-receptor pairs for different disease states |
| Ligand | Receptor | LRpair | Pathway | Tissue | Disease Stage |
| Page: 1 |
Top |
Single-cell gene regulatory network inference analysis |
| Find out the significant the regulons (TFs) and the target genes of each regulon across cell types for different disease states |
| TF | Cell Type | Tissue | Disease Stage | Target Gene | RSS | Regulon Activity |
| ∗The dot plots of a searched regulon are shown for all cell subpopulations in each disease state of each tissue based on the regulon specific score inferred using pySCENIC and by calculating the average expression. |
| Page: 1 |
Top |
Somatic mutation of malignant transformation related genes |
| Annotation of somatic variants for genes involved in malignant transformation |
| Hugo Symbol | Variant Class | Variant Classification | dbSNP RS | HGVSc | HGVSp | HGVSp Short | SWISSPROT | BIOTYPE | SIFT | PolyPhen | Tumor Sample Barcode | Tissue | Histology | Sex | Age | Stage | Therapy Types | Drugs | Outcome |
| ALMS1 | SNV | Missense_Mutation | novel | c.392C>G | p.Ser131Cys | p.S131C | protein_coding | deleterious(0.04) | benign(0.042) | TCGA-A2-A25D-01 | Breast | breast invasive carcinoma | Female | >=65 | III/IV | Hormone Therapy | tamoxiphen | SD | |
| ALMS1 | SNV | Missense_Mutation | novel | c.8176A>G | p.Ile2726Val | p.I2726V | protein_coding | tolerated(0.1) | benign(0.421) | TCGA-A2-A3XV-01 | Breast | breast invasive carcinoma | Female | <65 | I/II | Chemotherapy | carboplatin | CR | |
| ALMS1 | SNV | Missense_Mutation | novel | c.10957N>A | p.Asp3653Asn | p.D3653N | protein_coding | deleterious(0.03) | benign(0.221) | TCGA-A8-A081-01 | Breast | breast invasive carcinoma | Female | >=65 | I/II | Unknown | Unknown | SD | |
| ALMS1 | SNV | Missense_Mutation | novel | c.1254N>T | p.Lys418Asn | p.K418N | protein_coding | deleterious_low_confidence(0) | possibly_damaging(0.882) | TCGA-A8-A09Z-01 | Breast | breast invasive carcinoma | Female | >=65 | I/II | Unknown | Unknown | SD | |
| ALMS1 | SNV | Missense_Mutation | novel | c.5954N>T | p.Ser1985Phe | p.S1985F | protein_coding | deleterious(0.03) | benign(0.162) | TCGA-AC-A23H-01 | Breast | breast invasive carcinoma | Female | >=65 | I/II | Unknown | Unknown | PD | |
| ALMS1 | SNV | Missense_Mutation | novel | c.11134N>C | p.Glu3712Gln | p.E3712Q | protein_coding | deleterious(0.01) | probably_damaging(0.99) | TCGA-AC-A6IX-01 | Breast | breast invasive carcinoma | Female | <65 | III/IV | Unknown | Unknown | SD | |
| ALMS1 | SNV | Missense_Mutation | novel | c.1133N>C | p.Glu378Ala | p.E378A | protein_coding | deleterious(0.04) | benign(0.023) | TCGA-AN-A046-01 | Breast | breast invasive carcinoma | Female | >=65 | I/II | Unknown | Unknown | SD | |
| ALMS1 | SNV | Missense_Mutation | rs769734500 | c.1927N>A | p.Glu643Lys | p.E643K | protein_coding | deleterious(0.03) | possibly_damaging(0.511) | TCGA-AN-A046-01 | Breast | breast invasive carcinoma | Female | >=65 | I/II | Unknown | Unknown | SD | |
| ALMS1 | SNV | Missense_Mutation | novel | c.3162N>T | p.Glu1054Asp | p.E1054D | protein_coding | tolerated(0.09) | benign(0.03) | TCGA-AN-A046-01 | Breast | breast invasive carcinoma | Female | >=65 | I/II | Unknown | Unknown | SD | |
| ALMS1 | SNV | Missense_Mutation | novel | c.9679C>T | p.His3227Tyr | p.H3227Y | protein_coding | tolerated(0.13) | benign(0.012) | TCGA-AN-A0AT-01 | Breast | breast invasive carcinoma | Female | <65 | I/II | Unknown | Unknown | SD |
| Page: 1 2 3 4 5 6 7 8 9 10 11 12 13 14 15 16 17 18 19 20 21 22 23 24 25 26 27 28 29 30 31 32 33 34 35 36 37 38 39 40 41 42 43 |
Top |
Related drugs of malignant transformation related genes |
| Identification of chemicals and drugs interact with genes involved in malignant transfromation |
| (DGIdb 4.0) |
| Entrez ID | Symbol | Category | Interaction Types | Drug Claim Name | Drug Name | PMIDs |
| Page: 1 |

Copyright 2023-Present -The University of Texas Health Science Center at Houston |