
|
|||||
|
 | |
| |
| |
| |
| |
| |
|
Gene: ALKBH5 |
Gene summary for ALKBH5 |
| Gene information | Species | Human | Gene symbol | ALKBH5 | Gene ID | 54890 |
| Gene name | alkB homolog 5, RNA demethylase | |
| Gene Alias | ABH5 | |
| Cytomap | 17p11.2 | |
| Gene Type | protein-coding | GO ID | GO:0000003 | UniProtAcc | Q6P6C2 |
Top |
Malignant transformation analysis |
| Identification of the aberrant gene expression in precancerous and cancerous lesions by comparing the gene expression of stem-like cells in diseased tissues with normal stem cells |
| Entrez ID | Symbol | Replicates | Species | Organ | Tissue | Adj P-value | Log2FC | Malignancy |
| 54890 | ALKBH5 | HTA11_2487_2000001011 | Human | Colorectum | SER | 1.05e-03 | 1.87e-01 | -0.1808 |
| 54890 | ALKBH5 | HTA11_1938_2000001011 | Human | Colorectum | AD | 1.31e-02 | 3.17e-01 | -0.0811 |
| 54890 | ALKBH5 | HTA11_347_2000001011 | Human | Colorectum | AD | 6.06e-14 | 4.59e-01 | -0.1954 |
| 54890 | ALKBH5 | HTA11_411_2000001011 | Human | Colorectum | SER | 9.40e-03 | 4.77e-01 | -0.2602 |
| 54890 | ALKBH5 | HTA11_3361_2000001011 | Human | Colorectum | AD | 5.67e-03 | 3.48e-01 | -0.1207 |
| 54890 | ALKBH5 | HTA11_696_2000001011 | Human | Colorectum | AD | 2.56e-07 | 3.39e-01 | -0.1464 |
| 54890 | ALKBH5 | HTA11_866_2000001011 | Human | Colorectum | AD | 2.07e-02 | 1.98e-01 | -0.1001 |
| 54890 | ALKBH5 | HTA11_1391_2000001011 | Human | Colorectum | AD | 2.94e-08 | 4.67e-01 | -0.059 |
| 54890 | ALKBH5 | HTA11_2992_2000001011 | Human | Colorectum | SER | 5.42e-04 | 4.12e-01 | -0.1706 |
| 54890 | ALKBH5 | HTA11_5216_2000001011 | Human | Colorectum | SER | 3.40e-02 | 4.09e-01 | -0.1462 |
| 54890 | ALKBH5 | HTA11_546_2000001011 | Human | Colorectum | AD | 8.96e-03 | 4.38e-01 | -0.0842 |
| 54890 | ALKBH5 | HTA11_866_3004761011 | Human | Colorectum | AD | 1.28e-04 | 3.33e-01 | 0.096 |
| 54890 | ALKBH5 | HTA11_10623_2000001011 | Human | Colorectum | AD | 3.74e-04 | 3.94e-01 | -0.0177 |
| 54890 | ALKBH5 | HTA11_6801_2000001011 | Human | Colorectum | SER | 2.51e-03 | 4.92e-01 | 0.0171 |
| 54890 | ALKBH5 | HTA11_10711_2000001011 | Human | Colorectum | AD | 3.07e-02 | 2.59e-01 | 0.0338 |
| 54890 | ALKBH5 | HTA11_7696_3000711011 | Human | Colorectum | AD | 3.18e-06 | 2.64e-01 | 0.0674 |
| 54890 | ALKBH5 | HTA11_99999971662_82457 | Human | Colorectum | MSS | 2.35e-05 | 2.08e-01 | 0.3859 |
| 54890 | ALKBH5 | A018-E-020 | Human | Colorectum | FAP | 2.03e-02 | -1.53e-01 | -0.2034 |
| 54890 | ALKBH5 | LZE4T | Human | Esophagus | ESCC | 3.83e-07 | 5.21e-02 | 0.0811 |
| 54890 | ALKBH5 | LZE7T | Human | Esophagus | ESCC | 4.51e-09 | 1.90e-01 | 0.0667 |
| Page: 1 2 3 4 5 6 7 |
| Tissue | Expression Dynamics | Abbreviation |
| Colorectum (GSE201348) |  | FAP: Familial adenomatous polyposis |
| CRC: Colorectal cancer | ||
| Colorectum (HTA11) |  | AD: Adenomas |
| SER: Sessile serrated lesions | ||
| MSI-H: Microsatellite-high colorectal cancer | ||
| MSS: Microsatellite stable colorectal cancer | ||
| Esophagus | 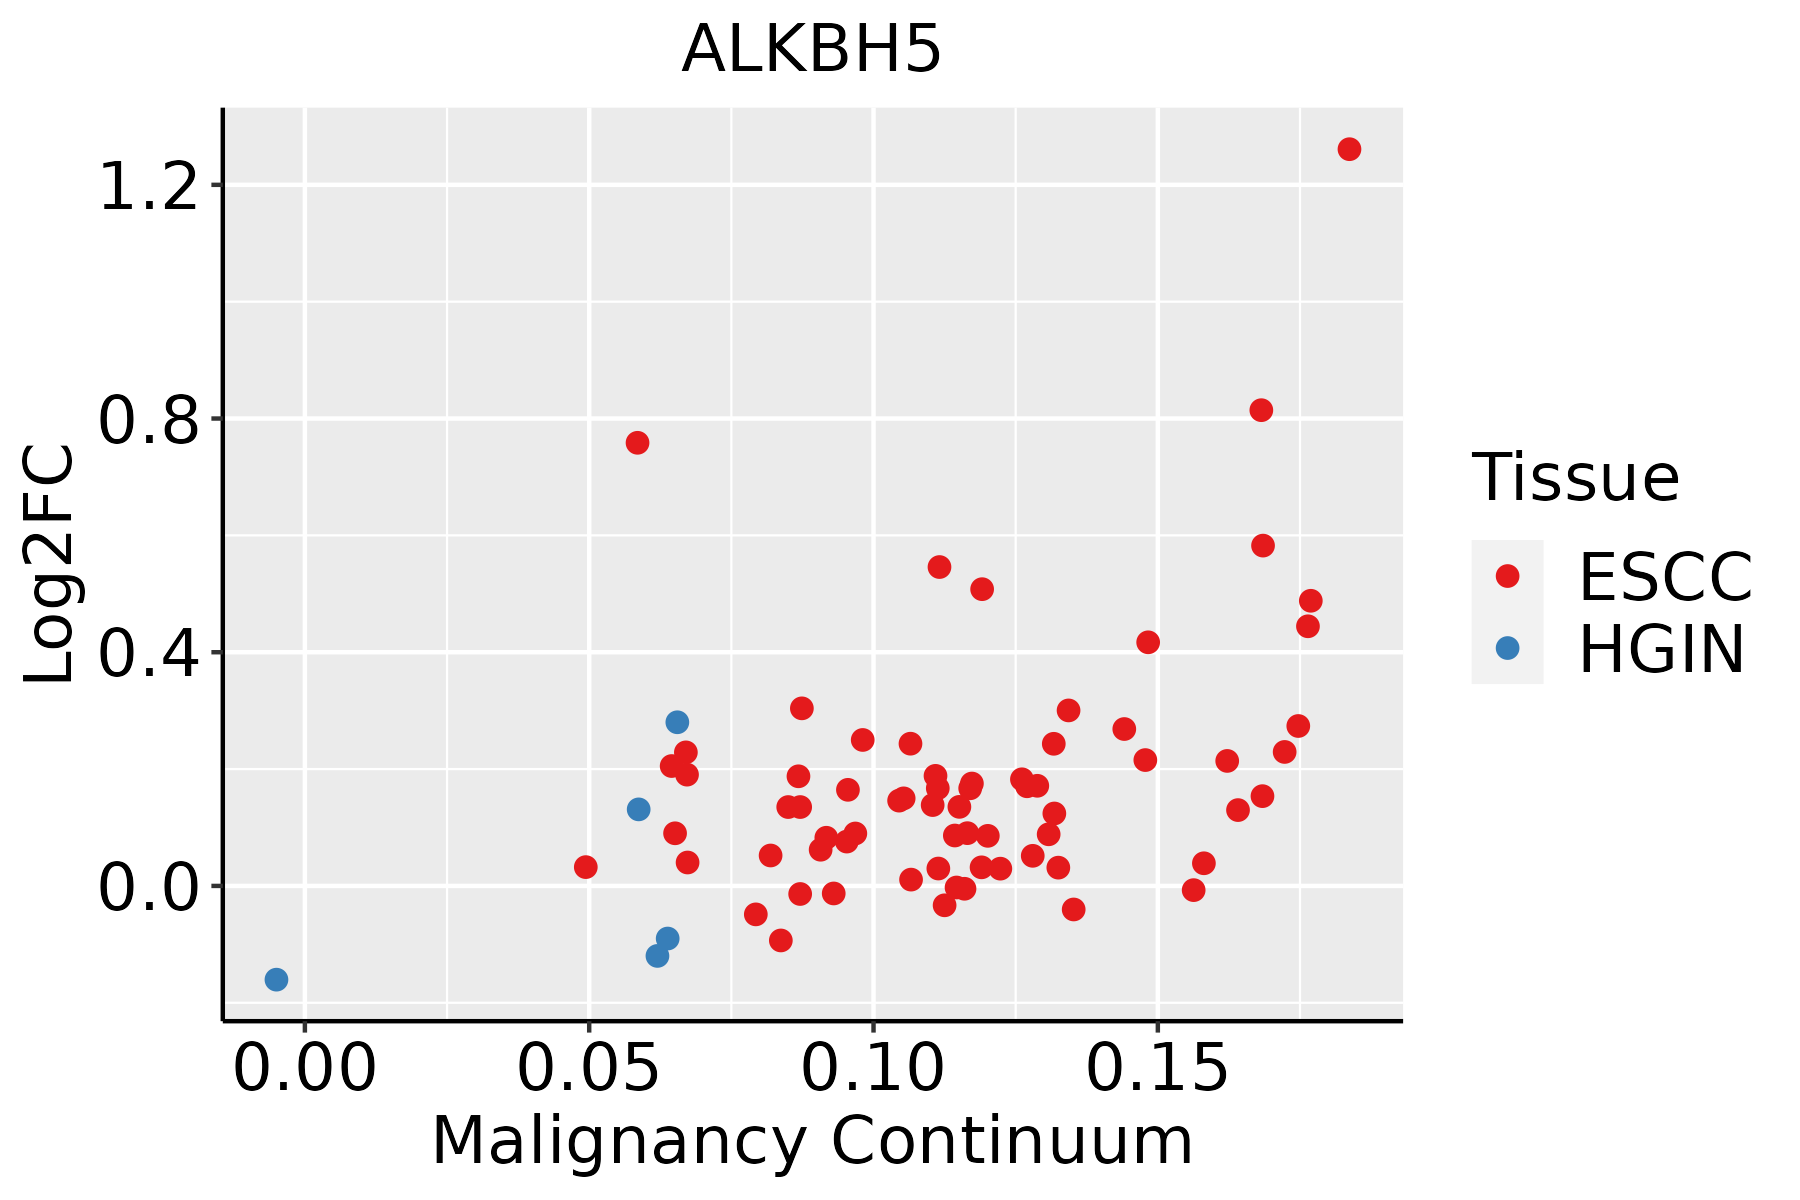 | ESCC: Esophageal squamous cell carcinoma |
| HGIN: High-grade intraepithelial neoplasias | ||
| LGIN: Low-grade intraepithelial neoplasias | ||
| Liver | 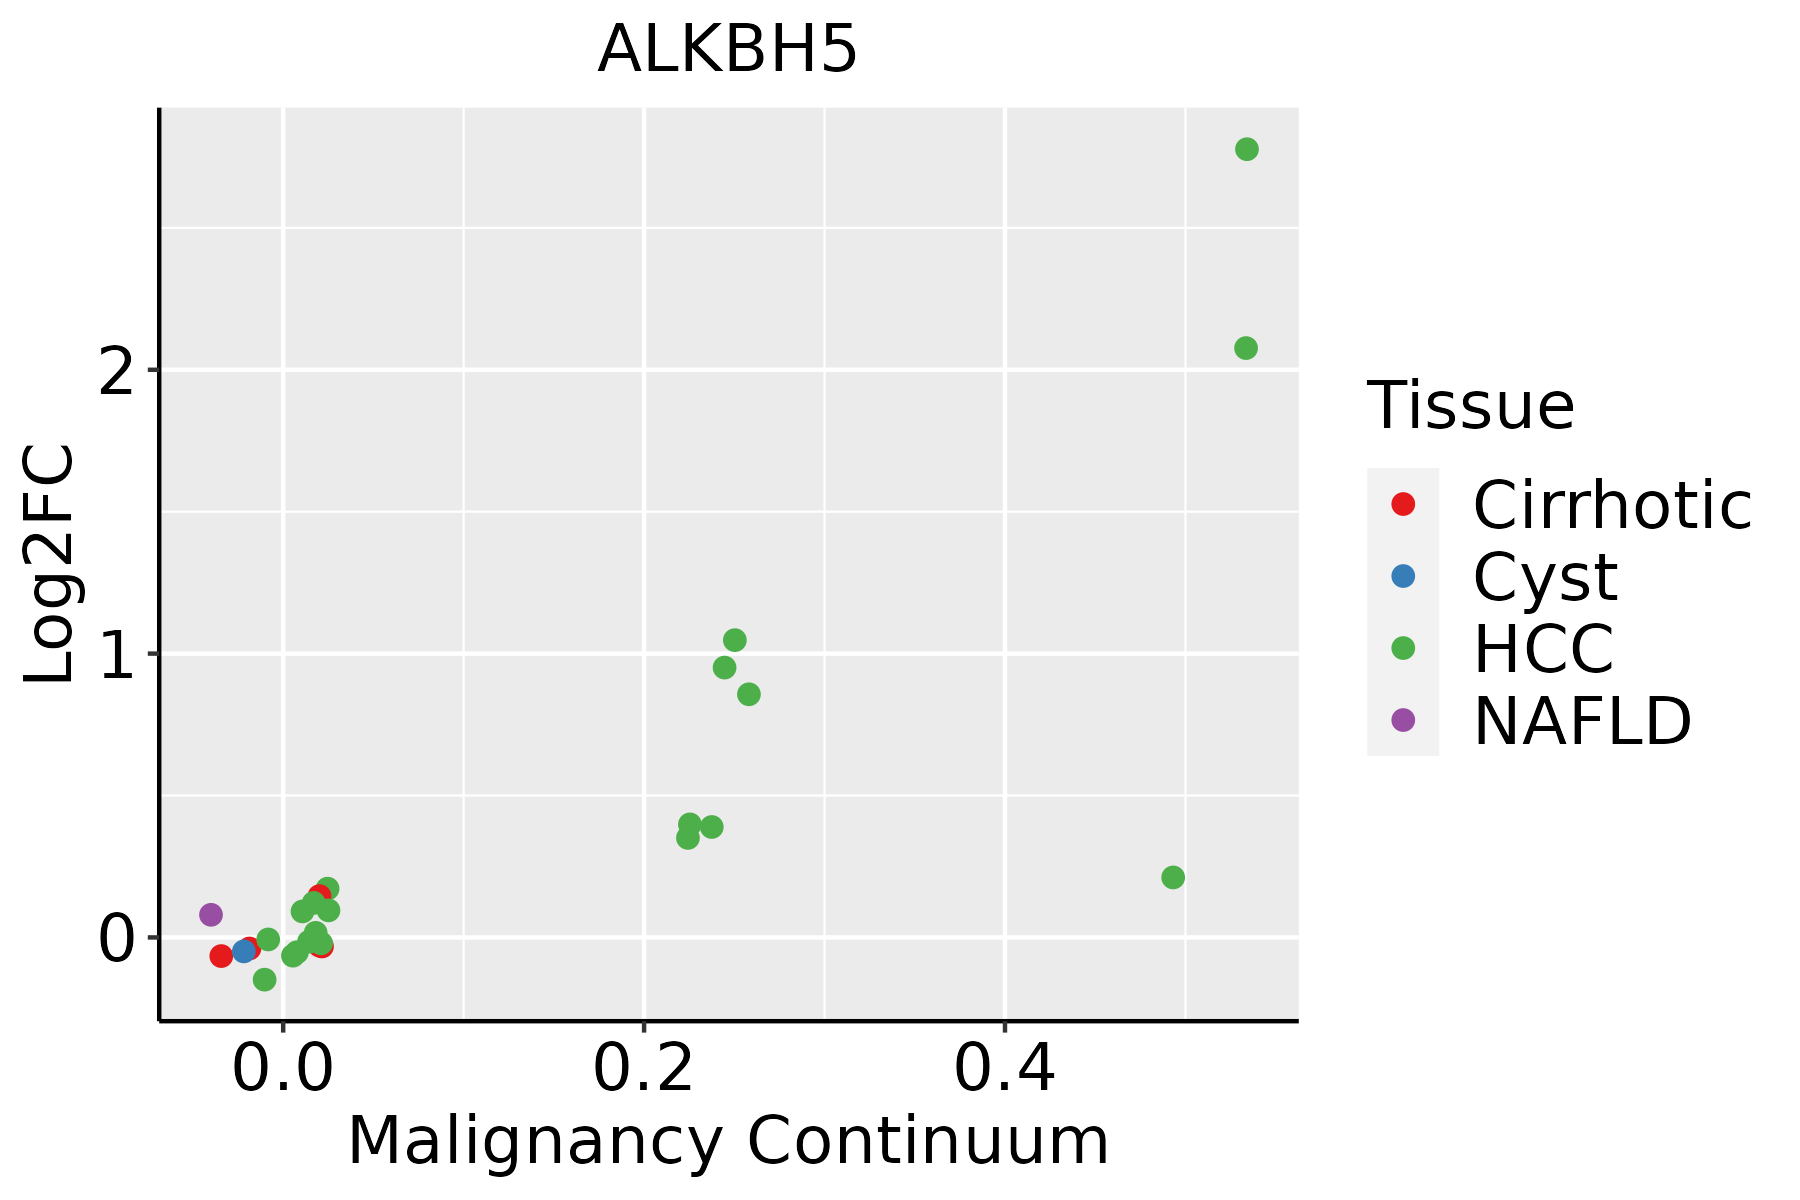 | HCC: Hepatocellular carcinoma |
| NAFLD: Non-alcoholic fatty liver disease | ||
| Oral Cavity | 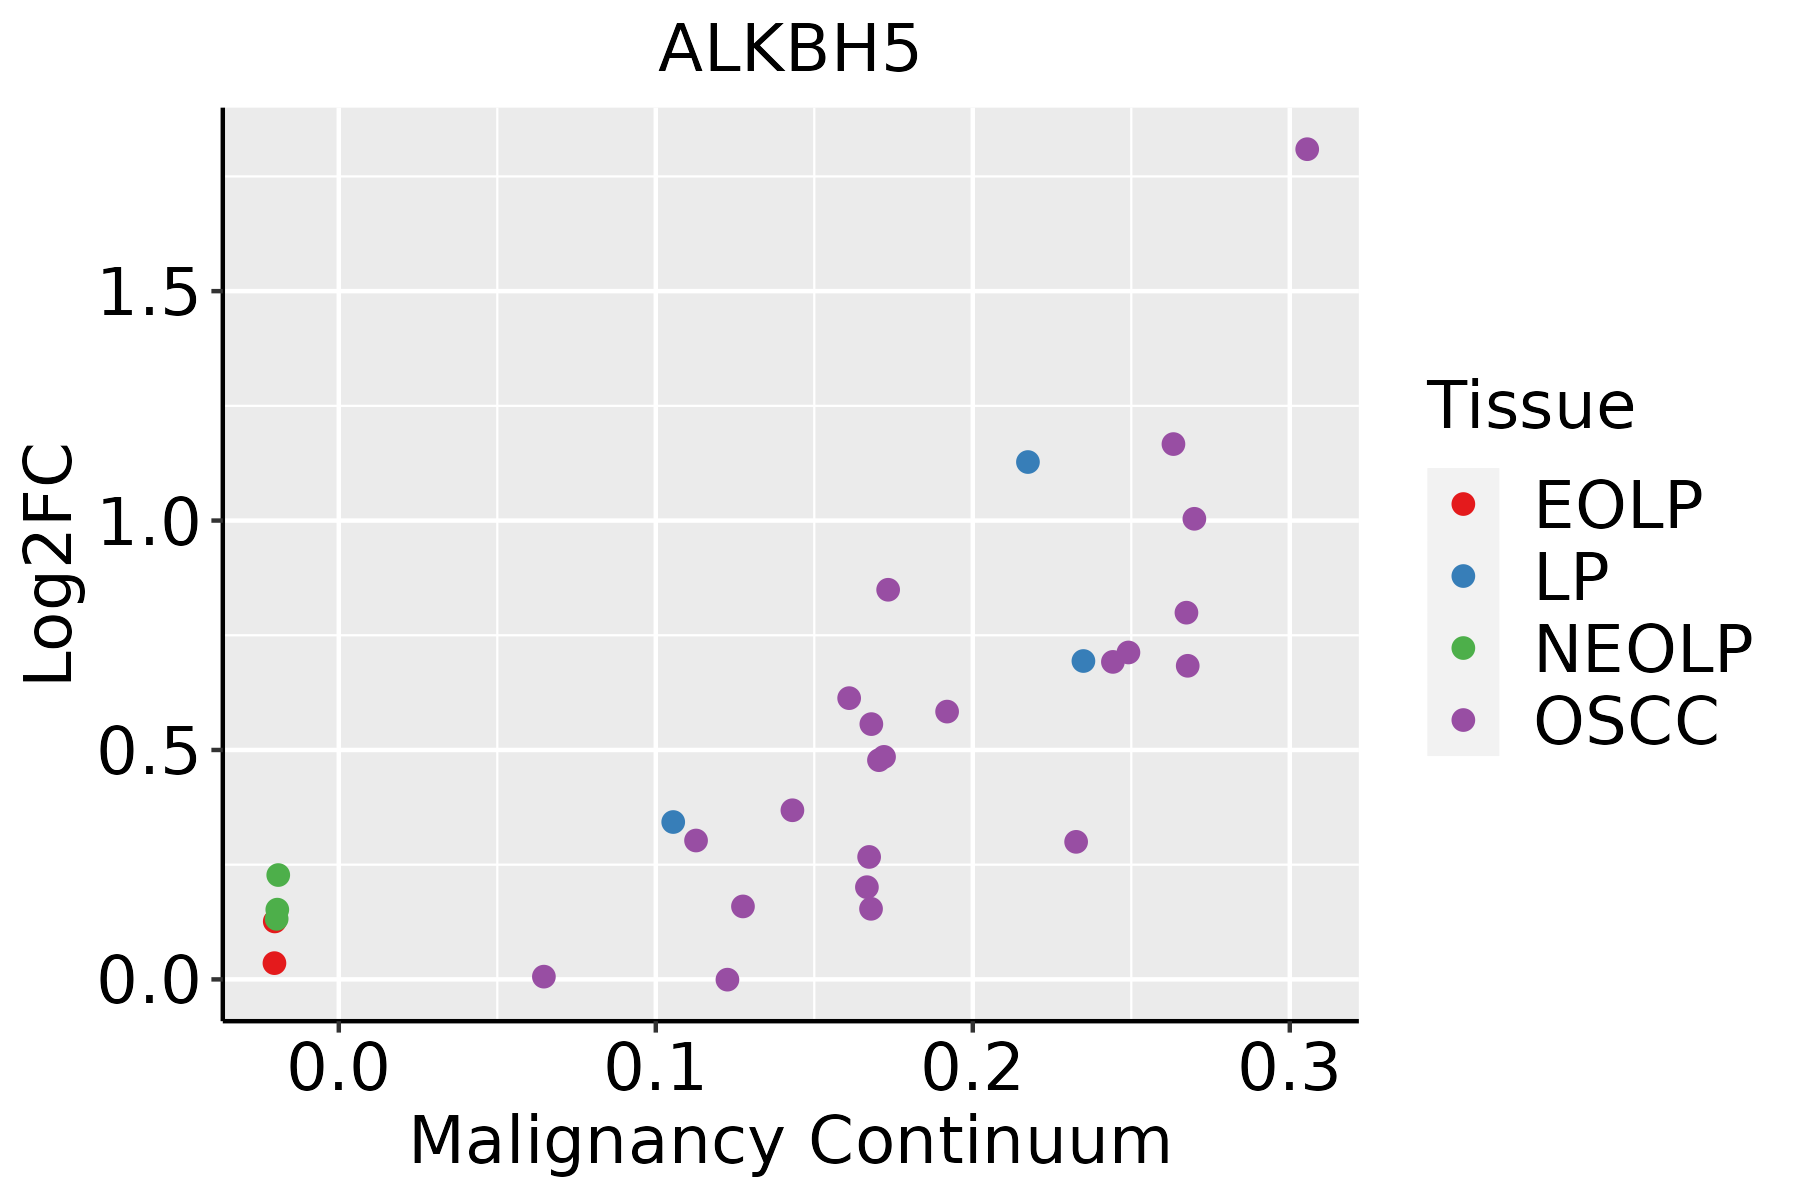 | EOLP: Erosive Oral lichen planus |
| LP: leukoplakia | ||
| NEOLP: Non-erosive oral lichen planus | ||
| OSCC: Oral squamous cell carcinoma | ||
| Skin | 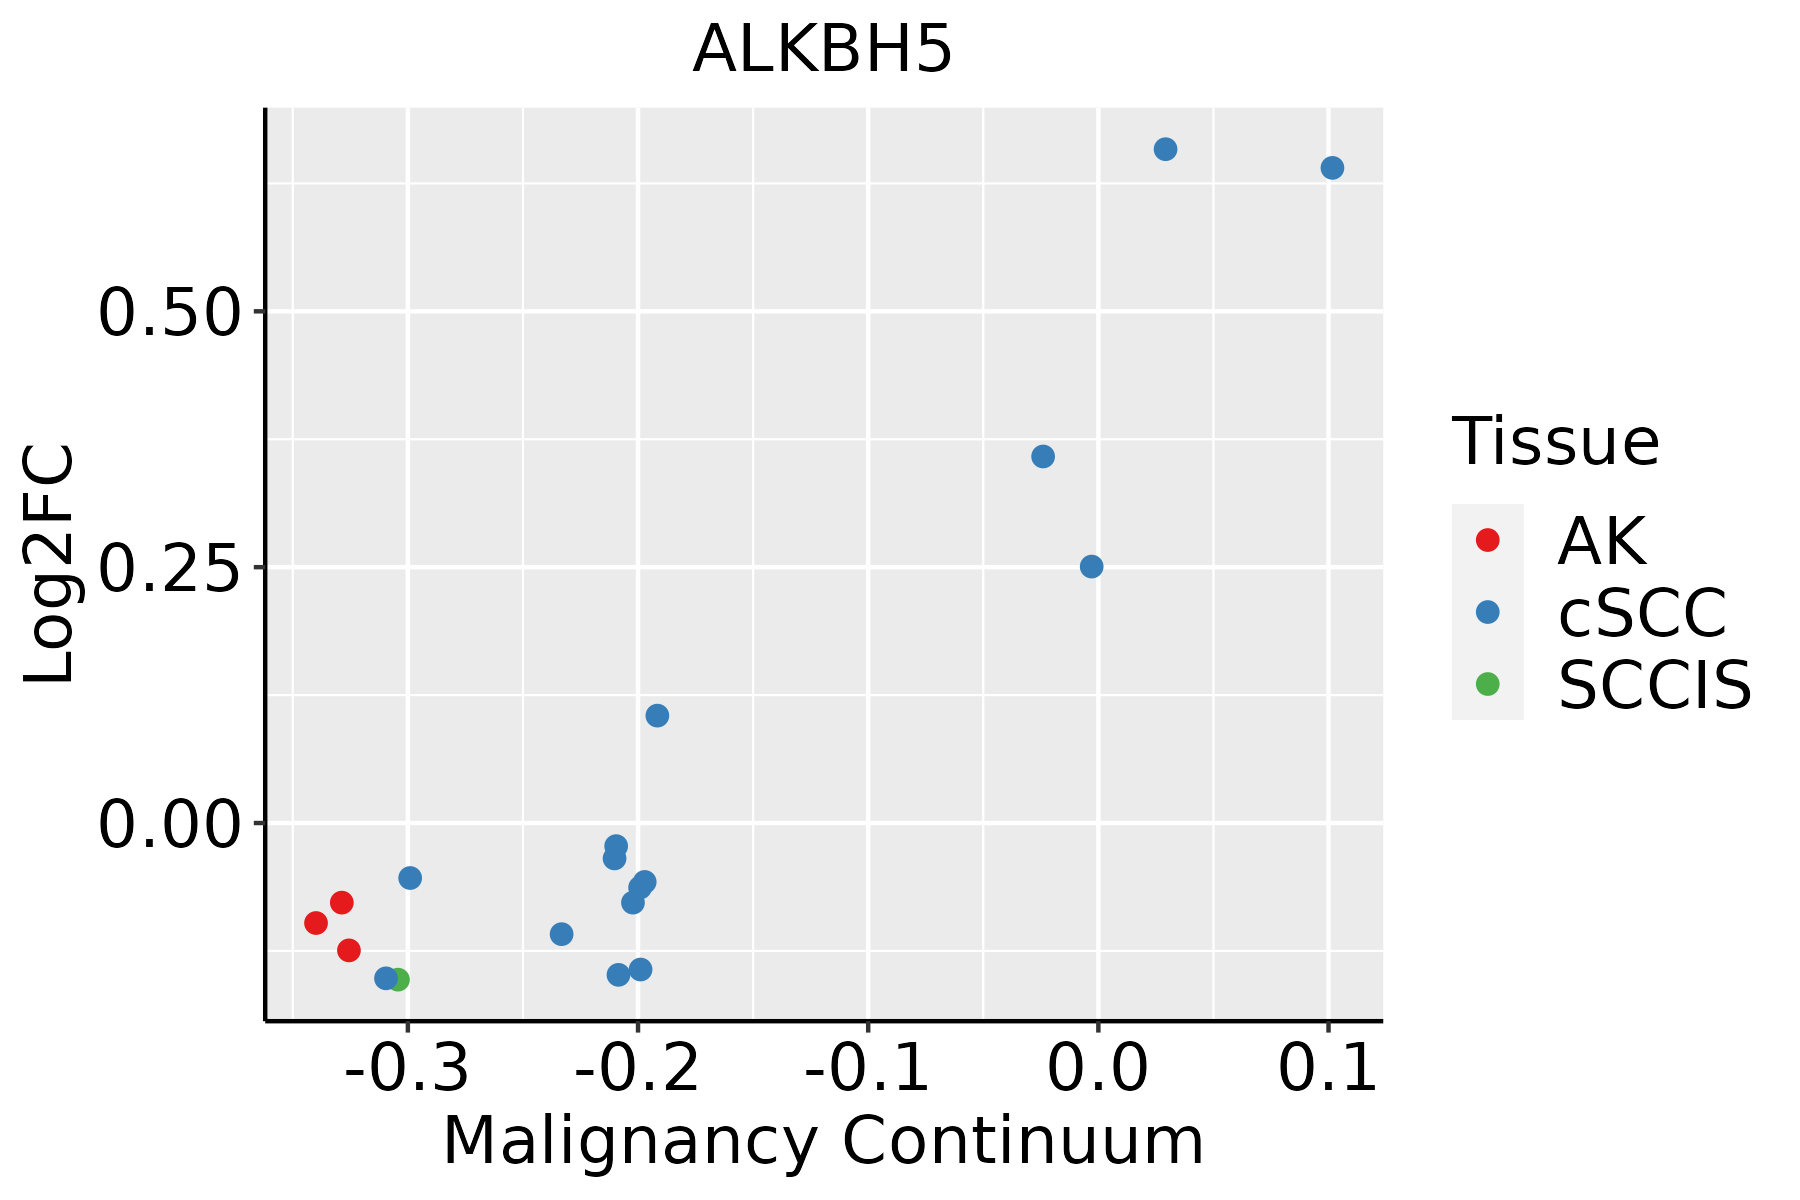 | AK: Actinic keratosis |
| cSCC: Cutaneous squamous cell carcinoma | ||
| SCCIS:squamous cell carcinoma in situ | ||
| Thyroid |  | ATC: Anaplastic thyroid cancer |
| HT: Hashimoto's thyroiditis | ||
| PTC: Papillary thyroid cancer |
| ∗log2FC in expression of this searched gene in stem-like cells from each diseased tissue sample relative to stem-like cells in normal samples in each tissue plotted against the malignancy continuum. Samples are colored based on if they are from different disease stage. |
Top |
Malignant transformation related pathway analysis |
| Find out the enriched GO biological processes and KEGG pathways involved in transition from healthy to precancer to cancer |
| Tissue | Disease Stage | Enriched GO biological Processes |
| Colorectum | AD |  |
| Colorectum | SER |  |
| Colorectum | MSS |  |
| Colorectum | MSI-H |  |
| Colorectum | FAP |  |
| ∗Top 15 enriched GO BP terms are showed in the bar plot of each disease state in each tissue. Each row represents a significant GO biological process which is colored according to the -log10(p.adjust). |
| Page: 1 2 3 4 5 6 7 8 9 |
| GO ID | Tissue | Disease Stage | Description | Gene Ratio | Bg Ratio | pvalue | p.adjust | Count |
| GO:1903311 | Colorectum | AD | regulation of mRNA metabolic process | 117/3918 | 288/18723 | 1.69e-14 | 4.23e-12 | 117 |
| GO:0006401 | Colorectum | AD | RNA catabolic process | 102/3918 | 278/18723 | 8.64e-10 | 6.76e-08 | 102 |
| GO:0044270 | Colorectum | AD | cellular nitrogen compound catabolic process | 147/3918 | 451/18723 | 3.35e-09 | 2.23e-07 | 147 |
| GO:0046700 | Colorectum | AD | heterocycle catabolic process | 145/3918 | 445/18723 | 4.37e-09 | 2.84e-07 | 145 |
| GO:0006402 | Colorectum | AD | mRNA catabolic process | 87/3918 | 232/18723 | 4.40e-09 | 2.84e-07 | 87 |
| GO:0034655 | Colorectum | AD | nucleobase-containing compound catabolic process | 133/3918 | 407/18723 | 1.56e-08 | 9.12e-07 | 133 |
| GO:0019439 | Colorectum | AD | aromatic compound catabolic process | 146/3918 | 467/18723 | 7.48e-08 | 3.84e-06 | 146 |
| GO:1901361 | Colorectum | AD | organic cyclic compound catabolic process | 153/3918 | 495/18723 | 8.23e-08 | 4.18e-06 | 153 |
| GO:0006913 | Colorectum | AD | nucleocytoplasmic transport | 102/3918 | 301/18723 | 1.00e-07 | 4.85e-06 | 102 |
| GO:0051169 | Colorectum | AD | nuclear transport | 102/3918 | 301/18723 | 1.00e-07 | 4.85e-06 | 102 |
| GO:0061013 | Colorectum | AD | regulation of mRNA catabolic process | 64/3918 | 166/18723 | 1.44e-07 | 6.59e-06 | 64 |
| GO:0043487 | Colorectum | AD | regulation of RNA stability | 63/3918 | 170/18723 | 9.17e-07 | 3.12e-05 | 63 |
| GO:0043488 | Colorectum | AD | regulation of mRNA stability | 59/3918 | 158/18723 | 1.50e-06 | 4.66e-05 | 59 |
| GO:0006403 | Colorectum | AD | RNA localization | 71/3918 | 201/18723 | 1.54e-06 | 4.76e-05 | 71 |
| GO:0051236 | Colorectum | AD | establishment of RNA localization | 58/3918 | 166/18723 | 1.95e-05 | 4.01e-04 | 58 |
| GO:0015931 | Colorectum | AD | nucleobase-containing compound transport | 73/3918 | 222/18723 | 2.02e-05 | 4.10e-04 | 73 |
| GO:0050657 | Colorectum | AD | nucleic acid transport | 57/3918 | 163/18723 | 2.22e-05 | 4.39e-04 | 57 |
| GO:0050658 | Colorectum | AD | RNA transport | 57/3918 | 163/18723 | 2.22e-05 | 4.39e-04 | 57 |
| GO:0051168 | Colorectum | AD | nuclear export | 53/3918 | 154/18723 | 6.89e-05 | 1.11e-03 | 53 |
| GO:0070482 | Colorectum | AD | response to oxygen levels | 99/3918 | 347/18723 | 4.29e-04 | 4.82e-03 | 99 |
| Page: 1 2 3 4 5 6 7 8 9 10 11 12 13 14 15 16 17 |
| Pathway ID | Tissue | Disease Stage | Description | Gene Ratio | Bg Ratio | pvalue | p.adjust | qvalue | Count |
| Page: 1 |
Top |
Cell-cell communication analysis |
| Identification of potential cell-cell interactions between two cell types and their ligand-receptor pairs for different disease states |
| Ligand | Receptor | LRpair | Pathway | Tissue | Disease Stage |
| Page: 1 |
Top |
Single-cell gene regulatory network inference analysis |
| Find out the significant the regulons (TFs) and the target genes of each regulon across cell types for different disease states |
| TF | Cell Type | Tissue | Disease Stage | Target Gene | RSS | Regulon Activity |
| ∗The dot plots of a searched regulon are shown for all cell subpopulations in each disease state of each tissue based on the regulon specific score inferred using pySCENIC and by calculating the average expression. |
| Page: 1 |
Top |
Somatic mutation of malignant transformation related genes |
| Annotation of somatic variants for genes involved in malignant transformation |
| Hugo Symbol | Variant Class | Variant Classification | dbSNP RS | HGVSc | HGVSp | HGVSp Short | SWISSPROT | BIOTYPE | SIFT | PolyPhen | Tumor Sample Barcode | Tissue | Histology | Sex | Age | Stage | Therapy Types | Drugs | Outcome |
| ALKBH5 | SNV | Missense_Mutation | novel | c.579N>G | p.Asn193Lys | p.N193K | Q6P6C2 | protein_coding | deleterious(0) | probably_damaging(0.999) | TCGA-A2-A04V-01 | Breast | breast invasive carcinoma | Female | <65 | I/II | Chemotherapy | cytoxan | PD |
| ALKBH5 | SNV | Missense_Mutation | c.877N>C | p.Glu293Gln | p.E293Q | Q6P6C2 | protein_coding | deleterious(0.04) | possibly_damaging(0.484) | TCGA-AC-A23H-01 | Breast | breast invasive carcinoma | Female | >=65 | I/II | Unknown | Unknown | PD | |
| ALKBH5 | SNV | Missense_Mutation | c.871N>T | p.Arg291Trp | p.R291W | Q6P6C2 | protein_coding | deleterious(0) | probably_damaging(0.992) | TCGA-AO-A0J3-01 | Breast | breast invasive carcinoma | Female | >=65 | I/II | Chemotherapy | cyclophosphamide | SD | |
| ALKBH5 | SNV | Missense_Mutation | novel | c.458N>G | p.Glu153Gly | p.E153G | Q6P6C2 | protein_coding | deleterious(0.01) | probably_damaging(0.998) | TCGA-D8-A140-01 | Breast | breast invasive carcinoma | Female | <65 | I/II | Chemotherapy | doxorubicin+cyclophosphamid | SD |
| ALKBH5 | insertion | Nonsense_Mutation | novel | c.1030_1031insTTGATTCTCAAGAGATGGCTTATGGGTCTTCGGGGCCTTG | p.Lys344IlefsTer14 | p.K344Ifs*14 | Q6P6C2 | protein_coding | TCGA-AR-A0TY-01 | Breast | breast invasive carcinoma | Female | <65 | I/II | Unspecific | Paclitaxel | PD | ||
| ALKBH5 | SNV | Missense_Mutation | c.979N>T | p.Arg327Cys | p.R327C | Q6P6C2 | protein_coding | deleterious_low_confidence(0) | possibly_damaging(0.88) | TCGA-C5-A1MJ-01 | Cervix | cervical & endocervical cancer | Female | <65 | I/II | Unknown | Unknown | SD | |
| ALKBH5 | SNV | Missense_Mutation | c.1168N>G | p.Lys390Glu | p.K390E | Q6P6C2 | protein_coding | deleterious_low_confidence(0) | probably_damaging(0.981) | TCGA-AD-6895-01 | Colorectum | colon adenocarcinoma | Male | >=65 | III/IV | Unknown | Unknown | SD | |
| ALKBH5 | SNV | Missense_Mutation | rs751699434 | c.1117N>A | p.Glu373Lys | p.E373K | Q6P6C2 | protein_coding | tolerated_low_confidence(0.09) | benign(0.212) | TCGA-AZ-4315-01 | Colorectum | colon adenocarcinoma | Male | <65 | I/II | Unknown | Unknown | SD |
| ALKBH5 | SNV | Missense_Mutation | c.686G>A | p.Gly229Asp | p.G229D | Q6P6C2 | protein_coding | deleterious(0) | probably_damaging(0.999) | TCGA-CK-5916-01 | Colorectum | colon adenocarcinoma | Female | >=65 | I/II | Unknown | Unknown | PD | |
| ALKBH5 | SNV | Missense_Mutation | c.245N>T | p.Ala82Val | p.A82V | Q6P6C2 | protein_coding | tolerated(0.44) | possibly_damaging(0.837) | TCGA-CM-4743-01 | Colorectum | colon adenocarcinoma | Male | >=65 | I/II | Chemotherapy | capecitabine | SD |
| Page: 1 2 3 |
Top |
Related drugs of malignant transformation related genes |
| Identification of chemicals and drugs interact with genes involved in malignant transfromation |
| (DGIdb 4.0) |
| Entrez ID | Symbol | Category | Interaction Types | Drug Claim Name | Drug Name | PMIDs |
| Page: 1 |

Copyright 2023-Present -The University of Texas Health Science Center at Houston |