
|
|||||
|
 | |
| |
| |
| |
| |
| |
|
Gene: ALKBH2 |
Gene summary for ALKBH2 |
| Gene information | Species | Human | Gene symbol | ALKBH2 | Gene ID | 121642 |
| Gene name | alkB homolog 2, alpha-ketoglutarate dependent dioxygenase | |
| Gene Alias | ABH2 | |
| Cytomap | 12q24.11 | |
| Gene Type | protein-coding | GO ID | GO:0006139 | UniProtAcc | Q6NS38 |
Top |
Malignant transformation analysis |
| Identification of the aberrant gene expression in precancerous and cancerous lesions by comparing the gene expression of stem-like cells in diseased tissues with normal stem cells |
| Entrez ID | Symbol | Replicates | Species | Organ | Tissue | Adj P-value | Log2FC | Malignancy |
| 121642 | ALKBH2 | LZE4T | Human | Esophagus | ESCC | 4.70e-03 | 6.97e-02 | 0.0811 |
| 121642 | ALKBH2 | LZE7T | Human | Esophagus | ESCC | 1.97e-03 | 2.96e-01 | 0.0667 |
| 121642 | ALKBH2 | LZE22D1 | Human | Esophagus | HGIN | 1.50e-02 | 1.16e-01 | 0.0595 |
| 121642 | ALKBH2 | LZE22T | Human | Esophagus | ESCC | 2.56e-03 | 2.60e-01 | 0.068 |
| 121642 | ALKBH2 | LZE24T | Human | Esophagus | ESCC | 2.06e-13 | 4.04e-01 | 0.0596 |
| 121642 | ALKBH2 | LZE22D3 | Human | Esophagus | HGIN | 3.58e-03 | 4.82e-01 | 0.0653 |
| 121642 | ALKBH2 | LZE6T | Human | Esophagus | ESCC | 3.41e-03 | 1.01e-01 | 0.0845 |
| 121642 | ALKBH2 | P1T-E | Human | Esophagus | ESCC | 9.77e-10 | 3.61e-01 | 0.0875 |
| 121642 | ALKBH2 | P2T-E | Human | Esophagus | ESCC | 2.90e-49 | 1.04e+00 | 0.1177 |
| 121642 | ALKBH2 | P4T-E | Human | Esophagus | ESCC | 3.98e-26 | 6.96e-01 | 0.1323 |
| 121642 | ALKBH2 | P5T-E | Human | Esophagus | ESCC | 5.03e-17 | 2.40e-01 | 0.1327 |
| 121642 | ALKBH2 | P8T-E | Human | Esophagus | ESCC | 1.36e-16 | 2.70e-01 | 0.0889 |
| 121642 | ALKBH2 | P9T-E | Human | Esophagus | ESCC | 7.34e-10 | 2.30e-01 | 0.1131 |
| 121642 | ALKBH2 | P10T-E | Human | Esophagus | ESCC | 5.04e-23 | 5.36e-01 | 0.116 |
| 121642 | ALKBH2 | P11T-E | Human | Esophagus | ESCC | 6.74e-12 | 5.82e-01 | 0.1426 |
| 121642 | ALKBH2 | P12T-E | Human | Esophagus | ESCC | 9.22e-32 | 3.51e-01 | 0.1122 |
| 121642 | ALKBH2 | P15T-E | Human | Esophagus | ESCC | 1.21e-10 | 2.02e-01 | 0.1149 |
| 121642 | ALKBH2 | P16T-E | Human | Esophagus | ESCC | 1.68e-32 | 5.89e-01 | 0.1153 |
| 121642 | ALKBH2 | P17T-E | Human | Esophagus | ESCC | 3.62e-12 | 4.06e-01 | 0.1278 |
| 121642 | ALKBH2 | P19T-E | Human | Esophagus | ESCC | 5.42e-05 | 8.37e-01 | 0.1662 |
| Page: 1 2 3 4 5 |
| Tissue | Expression Dynamics | Abbreviation |
| Esophagus | 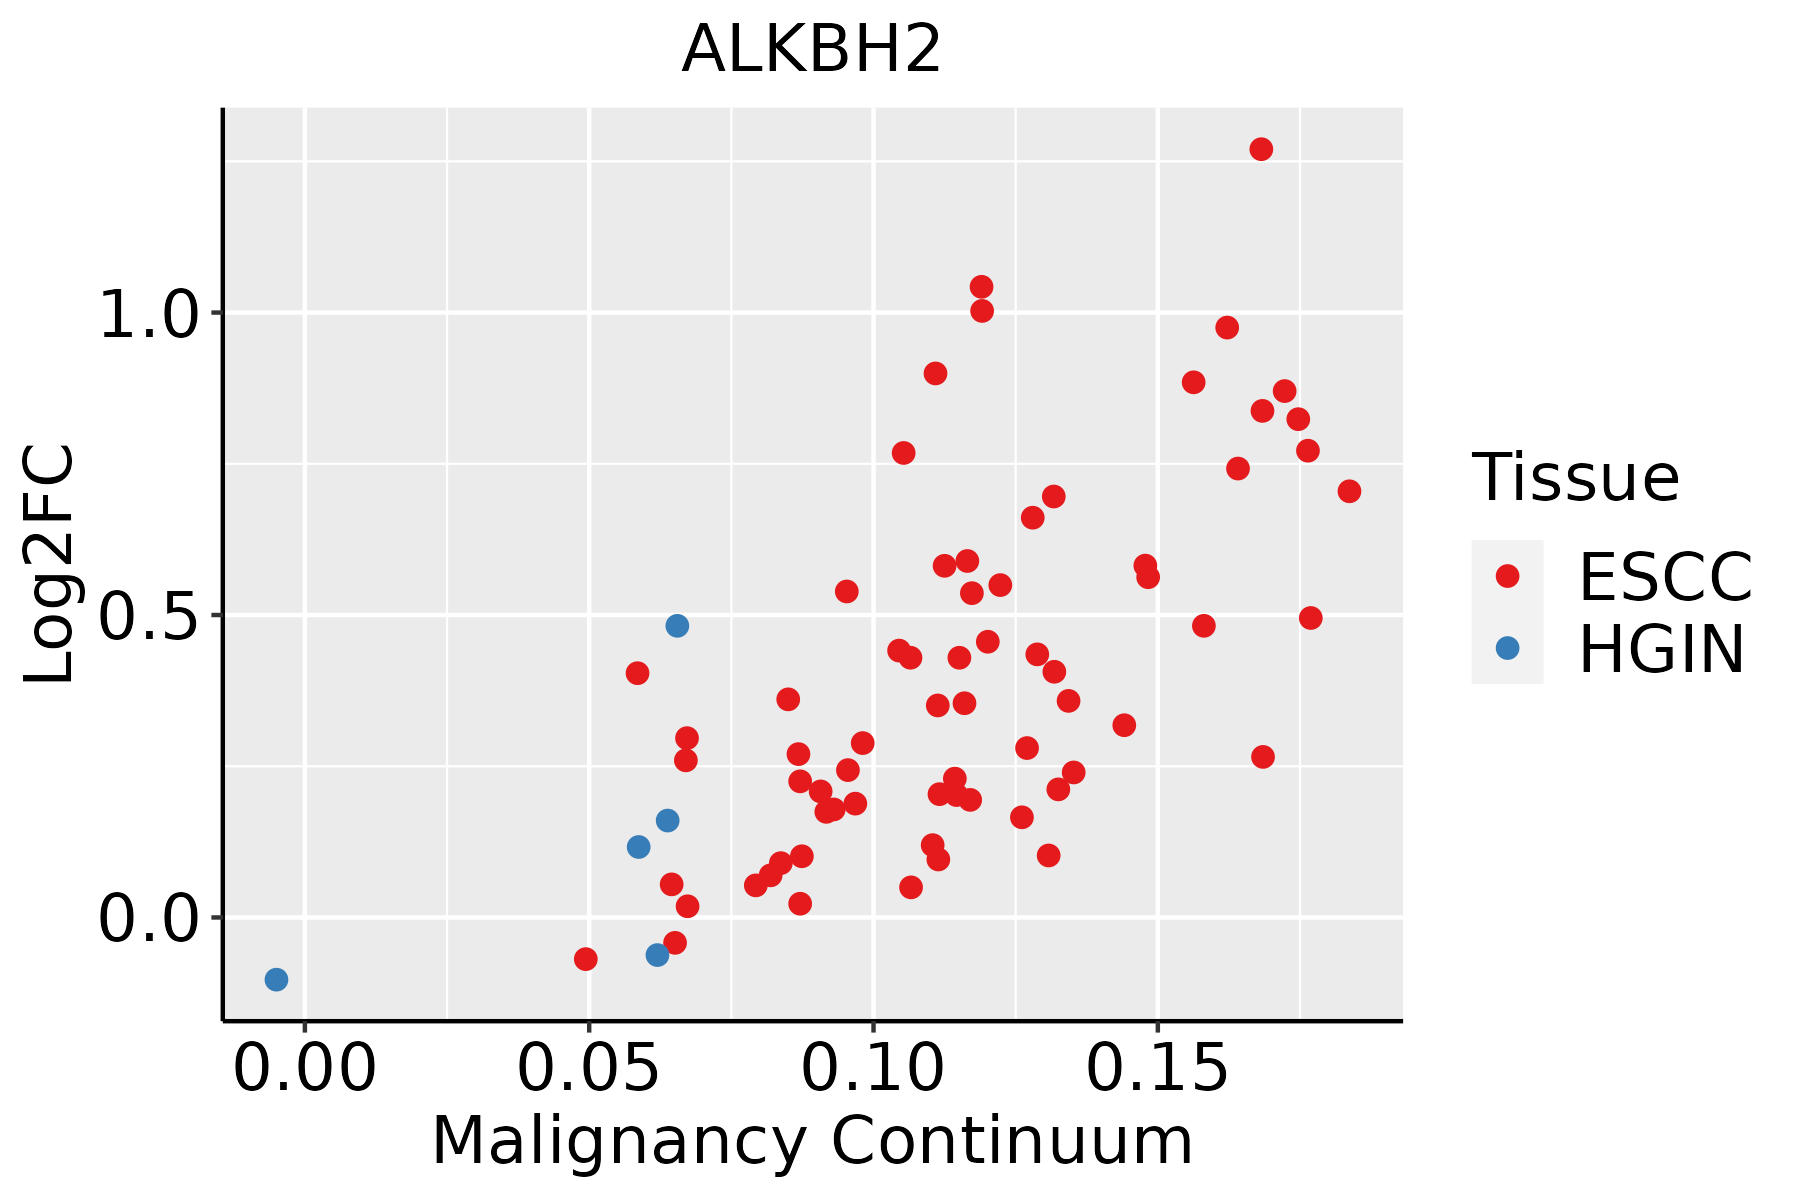 | ESCC: Esophageal squamous cell carcinoma |
| HGIN: High-grade intraepithelial neoplasias | ||
| LGIN: Low-grade intraepithelial neoplasias | ||
| Liver | 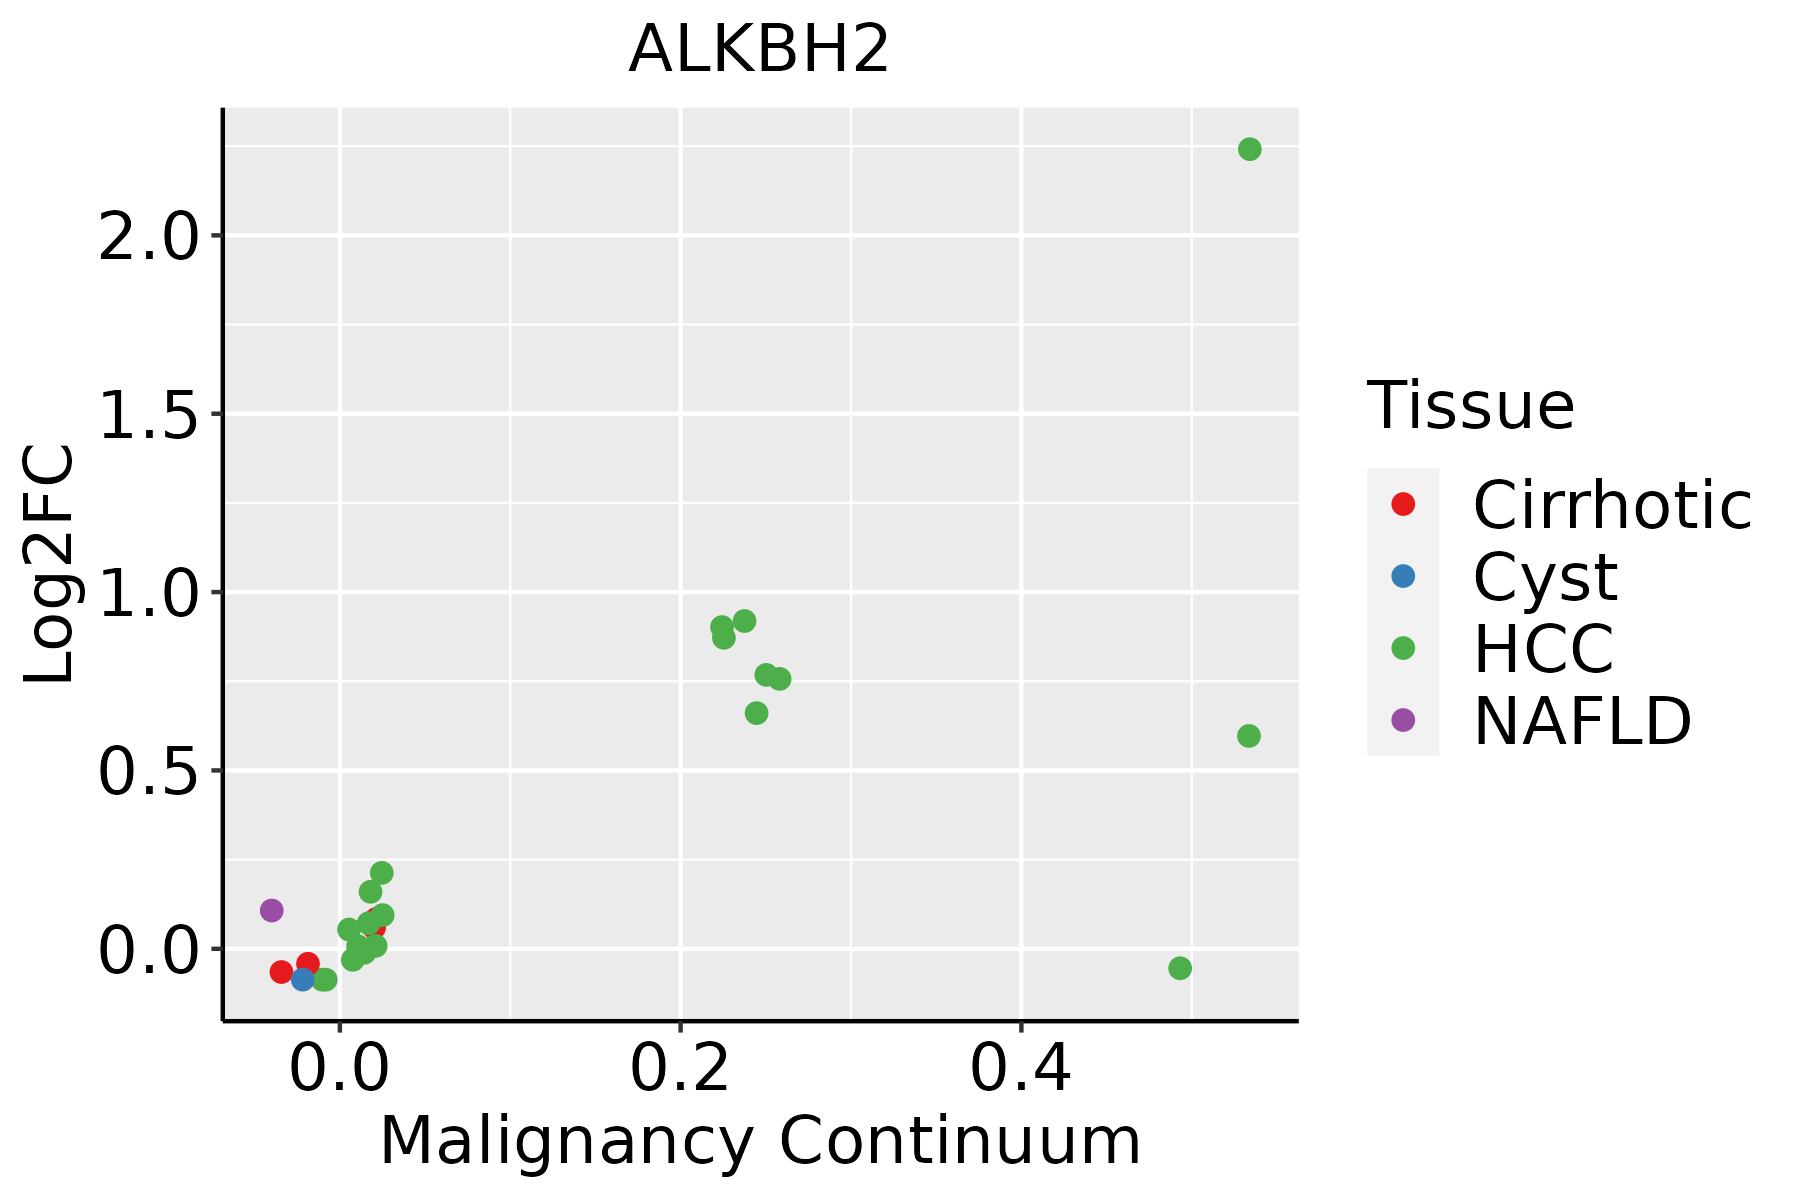 | HCC: Hepatocellular carcinoma |
| NAFLD: Non-alcoholic fatty liver disease | ||
| Oral Cavity | 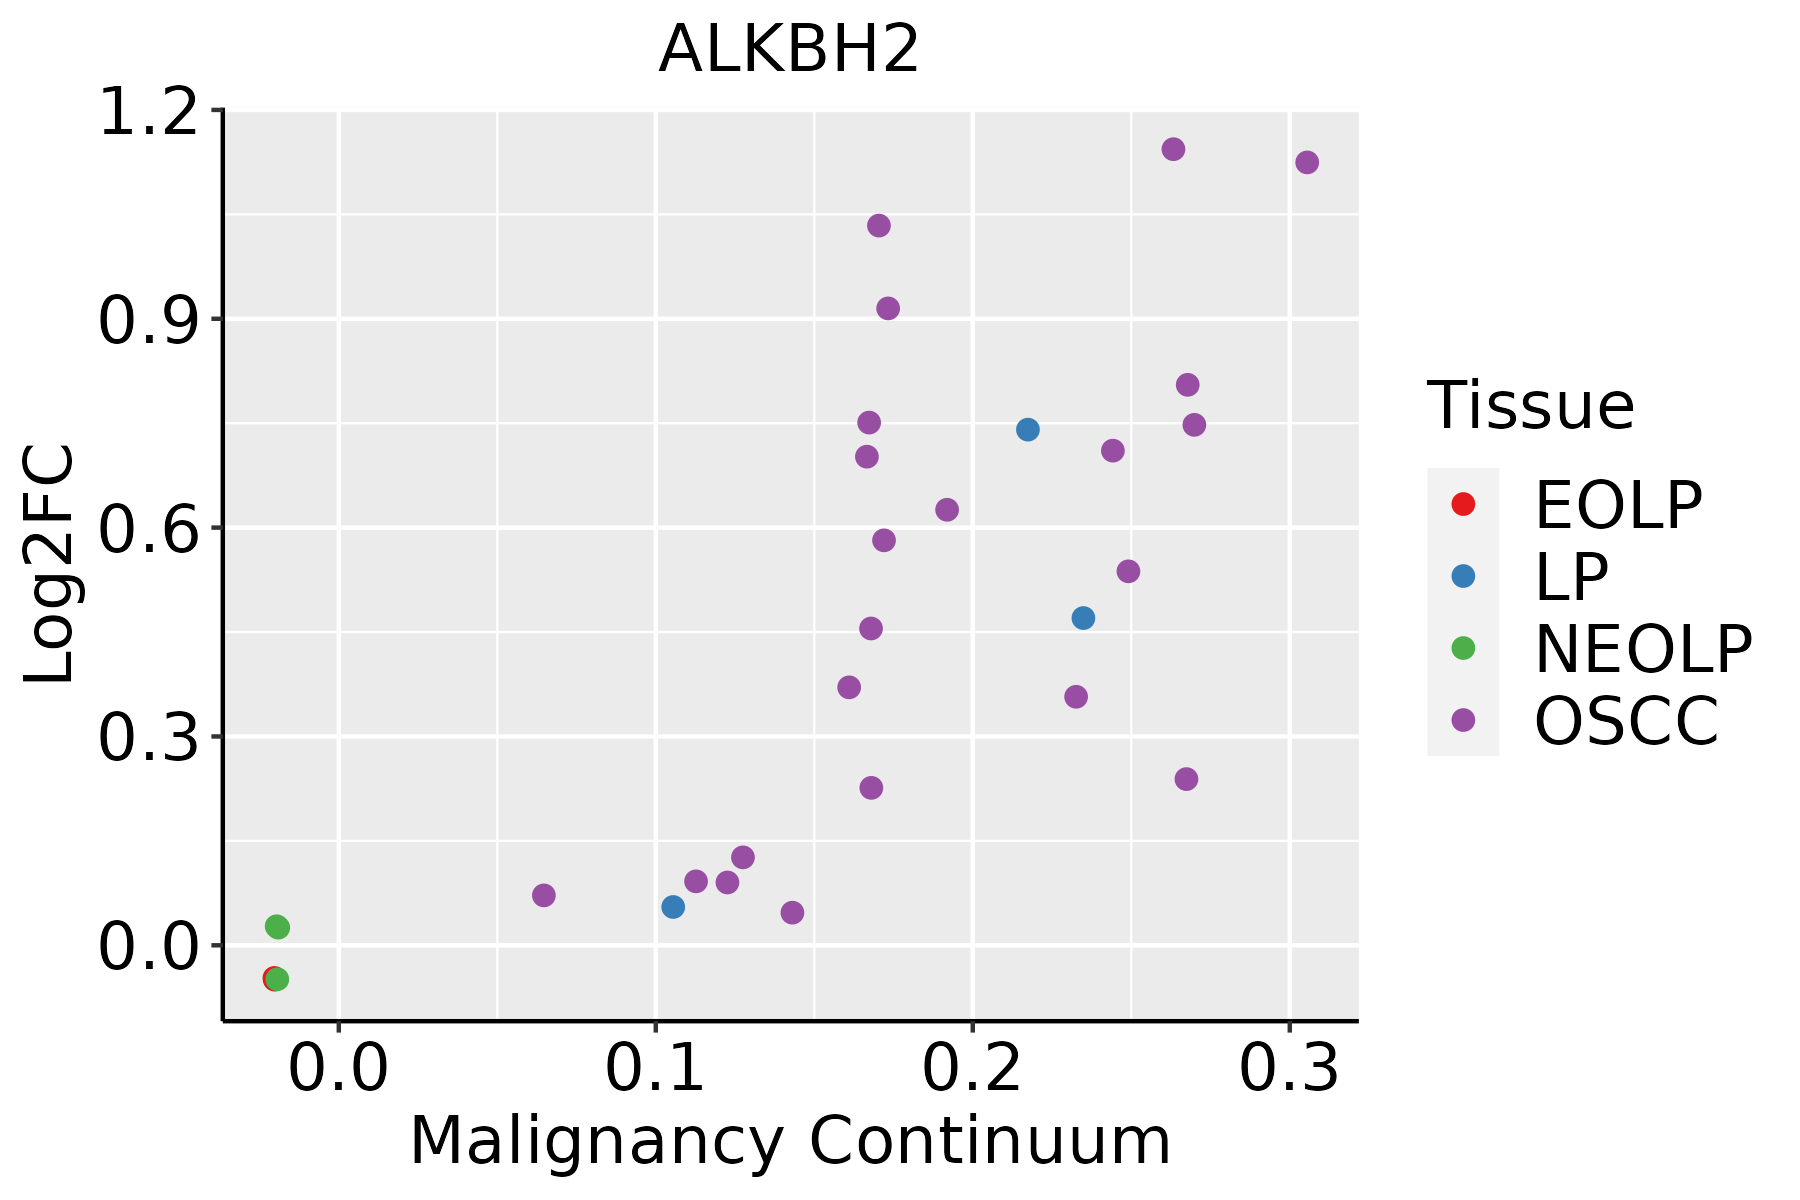 | EOLP: Erosive Oral lichen planus |
| LP: leukoplakia | ||
| NEOLP: Non-erosive oral lichen planus | ||
| OSCC: Oral squamous cell carcinoma | ||
| Skin | 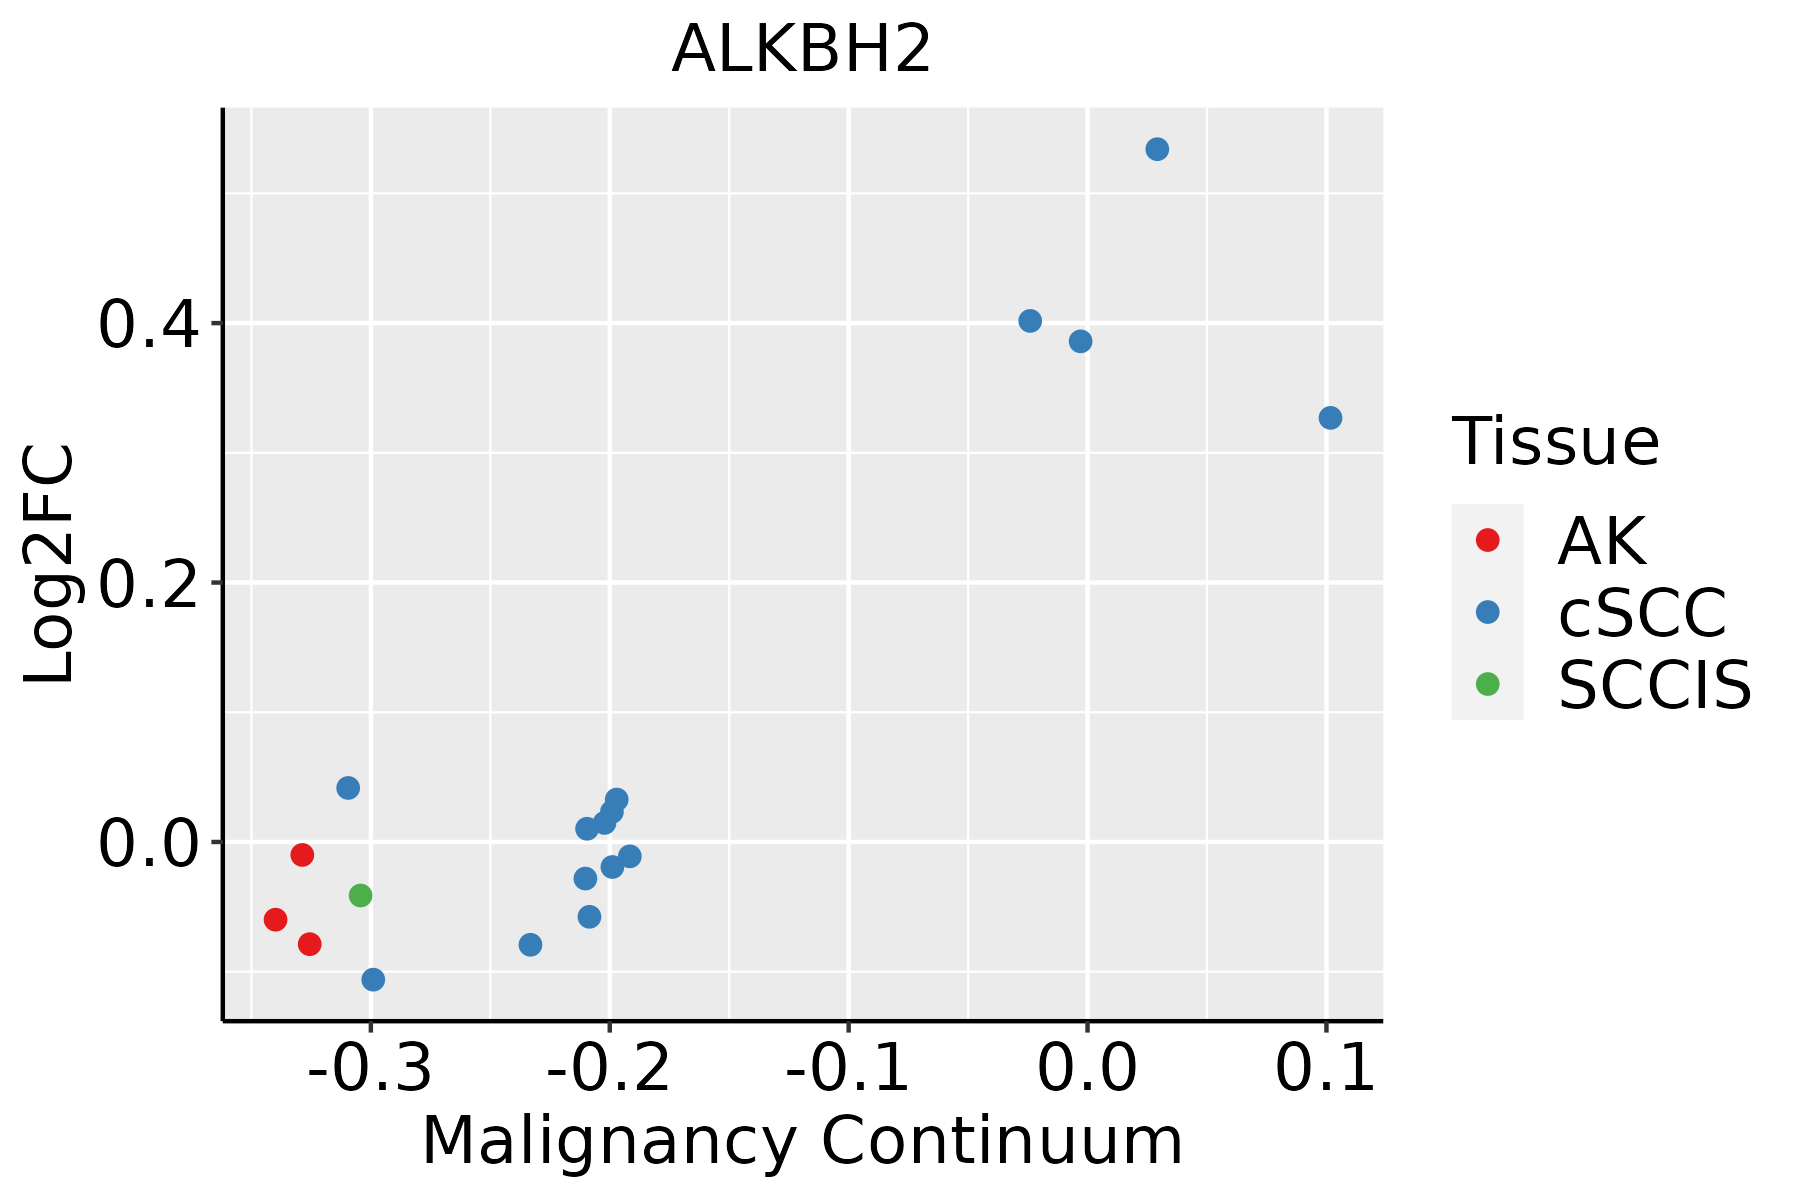 | AK: Actinic keratosis |
| cSCC: Cutaneous squamous cell carcinoma | ||
| SCCIS:squamous cell carcinoma in situ |
| ∗log2FC in expression of this searched gene in stem-like cells from each diseased tissue sample relative to stem-like cells in normal samples in each tissue plotted against the malignancy continuum. Samples are colored based on if they are from different disease stage. |
Top |
Malignant transformation related pathway analysis |
| Find out the enriched GO biological processes and KEGG pathways involved in transition from healthy to precancer to cancer |
| Tissue | Disease Stage | Enriched GO biological Processes |
| Colorectum | AD |  |
| Colorectum | SER |  |
| Colorectum | MSS |  |
| Colorectum | MSI-H |  |
| Colorectum | FAP |  |
| ∗Top 15 enriched GO BP terms are showed in the bar plot of each disease state in each tissue. Each row represents a significant GO biological process which is colored according to the -log10(p.adjust). |
| Page: 1 2 3 4 5 6 7 8 9 |
| GO ID | Tissue | Disease Stage | Description | Gene Ratio | Bg Ratio | pvalue | p.adjust | Count |
| GO:0006304 | Esophagus | ESCC | DNA modification | 68/8552 | 120/18723 | 9.95e-03 | 3.42e-02 | 68 |
| GO:0070989 | Liver | Cirrhotic | oxidative demethylation | 10/4634 | 19/18723 | 8.23e-03 | 3.83e-02 | 10 |
| Page: 1 |
| Pathway ID | Tissue | Disease Stage | Description | Gene Ratio | Bg Ratio | pvalue | p.adjust | qvalue | Count |
| Page: 1 |
Top |
Cell-cell communication analysis |
| Identification of potential cell-cell interactions between two cell types and their ligand-receptor pairs for different disease states |
| Ligand | Receptor | LRpair | Pathway | Tissue | Disease Stage |
| Page: 1 |
Top |
Single-cell gene regulatory network inference analysis |
| Find out the significant the regulons (TFs) and the target genes of each regulon across cell types for different disease states |
| TF | Cell Type | Tissue | Disease Stage | Target Gene | RSS | Regulon Activity |
| ∗The dot plots of a searched regulon are shown for all cell subpopulations in each disease state of each tissue based on the regulon specific score inferred using pySCENIC and by calculating the average expression. |
| Page: 1 |
Top |
Somatic mutation of malignant transformation related genes |
| Annotation of somatic variants for genes involved in malignant transformation |
| Hugo Symbol | Variant Class | Variant Classification | dbSNP RS | HGVSc | HGVSp | HGVSp Short | SWISSPROT | BIOTYPE | SIFT | PolyPhen | Tumor Sample Barcode | Tissue | Histology | Sex | Age | Stage | Therapy Types | Drugs | Outcome |
| ALKBH2 | SNV | Missense_Mutation | c.62N>G | p.Glu21Gly | p.E21G | Q6NS38 | protein_coding | tolerated_low_confidence(0.12) | benign(0) | TCGA-A7-A26I-01 | Breast | breast invasive carcinoma | Female | >=65 | I/II | Chemotherapy | cytoxan | SD | |
| ALKBH2 | SNV | Missense_Mutation | c.578G>C | p.Arg193Thr | p.R193T | Q6NS38 | protein_coding | deleterious(0) | probably_damaging(1) | TCGA-C8-A26Y-01 | Breast | breast invasive carcinoma | Female | >=65 | I/II | Unknown | Unknown | SD | |
| ALKBH2 | SNV | Missense_Mutation | c.725N>T | p.Lys242Met | p.K242M | Q6NS38 | protein_coding | deleterious(0) | probably_damaging(0.979) | TCGA-DS-A1OC-01 | Cervix | cervical & endocervical cancer | Female | <65 | I/II | Chemotherapy | gemcitabine | SD | |
| ALKBH2 | SNV | Missense_Mutation | c.355G>A | p.Gly119Arg | p.G119R | Q6NS38 | protein_coding | deleterious(0.01) | probably_damaging(0.997) | TCGA-CK-4951-01 | Colorectum | colon adenocarcinoma | Female | >=65 | I/II | Unknown | Unknown | PD | |
| ALKBH2 | SNV | Missense_Mutation | novel | c.718G>A | p.Val240Met | p.V240M | Q6NS38 | protein_coding | deleterious(0.04) | benign(0.192) | TCGA-AX-A2HD-01 | Endometrium | uterine corpus endometrioid carcinoma | Female | >=65 | III/IV | Unknown | Unknown | SD |
| ALKBH2 | SNV | Missense_Mutation | c.26N>T | p.Ala9Val | p.A9V | Q6NS38 | protein_coding | tolerated_low_confidence(0.14) | benign(0.003) | TCGA-B5-A11O-01 | Endometrium | uterine corpus endometrioid carcinoma | Female | <65 | I/II | Unknown | Unknown | PD | |
| ALKBH2 | SNV | Missense_Mutation | rs141848154 | c.695C>T | p.Thr232Met | p.T232M | Q6NS38 | protein_coding | tolerated(0.06) | possibly_damaging(0.524) | TCGA-DI-A1C3-01 | Endometrium | uterine corpus endometrioid carcinoma | Female | <65 | I/II | Unknown | Unknown | SD |
| ALKBH2 | SNV | Missense_Mutation | novel | c.544A>G | p.Ser182Gly | p.S182G | Q6NS38 | protein_coding | tolerated(0.1) | benign(0.03) | TCGA-EO-A22R-01 | Endometrium | uterine corpus endometrioid carcinoma | Female | <65 | I/II | Unknown | Unknown | SD |
| ALKBH2 | SNV | Missense_Mutation | novel | c.479G>T | p.Arg160Met | p.R160M | Q6NS38 | protein_coding | deleterious(0) | probably_damaging(0.996) | TCGA-EO-A22R-01 | Endometrium | uterine corpus endometrioid carcinoma | Female | <65 | I/II | Unknown | Unknown | SD |
| ALKBH2 | SNV | Missense_Mutation | novel | c.782N>C | p.Lys261Thr | p.K261T | Q6NS38 | protein_coding | deleterious_low_confidence(0) | possibly_damaging(0.784) | TCGA-EO-A3AY-01 | Endometrium | uterine corpus endometrioid carcinoma | Female | <65 | I/II | Unknown | Unknown | PD |
| Page: 1 2 3 |
Top |
Related drugs of malignant transformation related genes |
| Identification of chemicals and drugs interact with genes involved in malignant transfromation |
| (DGIdb 4.0) |
| Entrez ID | Symbol | Category | Interaction Types | Drug Claim Name | Drug Name | PMIDs |
| Page: 1 |

Copyright 2023-Present -The University of Texas Health Science Center at Houston |