
|
|||||
|
 | |
| |
| |
| |
| |
| |
|
Gene: ALG8 |
Gene summary for ALG8 |
| Gene information | Species | Human | Gene symbol | ALG8 | Gene ID | 79053 |
| Gene name | ALG8 alpha-1,3-glucosyltransferase | |
| Gene Alias | CDG1H | |
| Cytomap | 11q14.1 | |
| Gene Type | protein-coding | GO ID | GO:0006464 | UniProtAcc | Q9BVK2 |
Top |
Malignant transformation analysis |
| Identification of the aberrant gene expression in precancerous and cancerous lesions by comparing the gene expression of stem-like cells in diseased tissues with normal stem cells |
| Entrez ID | Symbol | Replicates | Species | Organ | Tissue | Adj P-value | Log2FC | Malignancy |
| 79053 | ALG8 | GSM4909293 | Human | Breast | IDC | 6.04e-05 | 1.78e-01 | 0.1581 |
| 79053 | ALG8 | GSM4909298 | Human | Breast | IDC | 7.79e-57 | 8.29e-01 | 0.1551 |
| 79053 | ALG8 | GSM4909304 | Human | Breast | IDC | 7.07e-06 | 2.96e-01 | 0.1636 |
| 79053 | ALG8 | GSM4909308 | Human | Breast | IDC | 1.08e-04 | 2.33e-01 | 0.158 |
| 79053 | ALG8 | GSM4909317 | Human | Breast | IDC | 9.99e-03 | 1.51e-01 | 0.1355 |
| 79053 | ALG8 | GSM4909319 | Human | Breast | IDC | 8.05e-03 | -1.80e-02 | 0.1563 |
| 79053 | ALG8 | brca2 | Human | Breast | Precancer | 6.05e-05 | 1.64e-01 | -0.024 |
| 79053 | ALG8 | P3 | Human | Breast | IDC | 3.41e-08 | 6.20e-01 | 0.1542 |
| 79053 | ALG8 | DCIS2 | Human | Breast | DCIS | 7.08e-25 | 3.85e-02 | 0.0085 |
| 79053 | ALG8 | LZE2T | Human | Esophagus | ESCC | 1.16e-04 | 7.61e-01 | 0.082 |
| 79053 | ALG8 | LZE4T | Human | Esophagus | ESCC | 1.13e-05 | 1.17e-01 | 0.0811 |
| 79053 | ALG8 | LZE7T | Human | Esophagus | ESCC | 1.58e-06 | 1.76e-01 | 0.0667 |
| 79053 | ALG8 | LZE8T | Human | Esophagus | ESCC | 4.98e-06 | 1.77e-01 | 0.067 |
| 79053 | ALG8 | LZE20T | Human | Esophagus | ESCC | 8.49e-05 | 1.74e-01 | 0.0662 |
| 79053 | ALG8 | LZE22D1 | Human | Esophagus | HGIN | 4.52e-05 | 1.64e-01 | 0.0595 |
| 79053 | ALG8 | LZE24T | Human | Esophagus | ESCC | 1.69e-19 | 5.05e-01 | 0.0596 |
| 79053 | ALG8 | LZE6T | Human | Esophagus | ESCC | 1.83e-03 | 4.35e-01 | 0.0845 |
| 79053 | ALG8 | P1T-E | Human | Esophagus | ESCC | 6.01e-03 | 1.09e-01 | 0.0875 |
| 79053 | ALG8 | P2T-E | Human | Esophagus | ESCC | 1.45e-14 | 2.08e-01 | 0.1177 |
| 79053 | ALG8 | P4T-E | Human | Esophagus | ESCC | 9.81e-37 | 7.90e-01 | 0.1323 |
| Page: 1 2 3 4 5 |
| Tissue | Expression Dynamics | Abbreviation |
| Breast |  | IDC: Invasive ductal carcinoma |
| DCIS: Ductal carcinoma in situ | ||
| Precancer(BRCA1-mut): Precancerous lesion from BRCA1 mutation carriers | ||
| Esophagus | 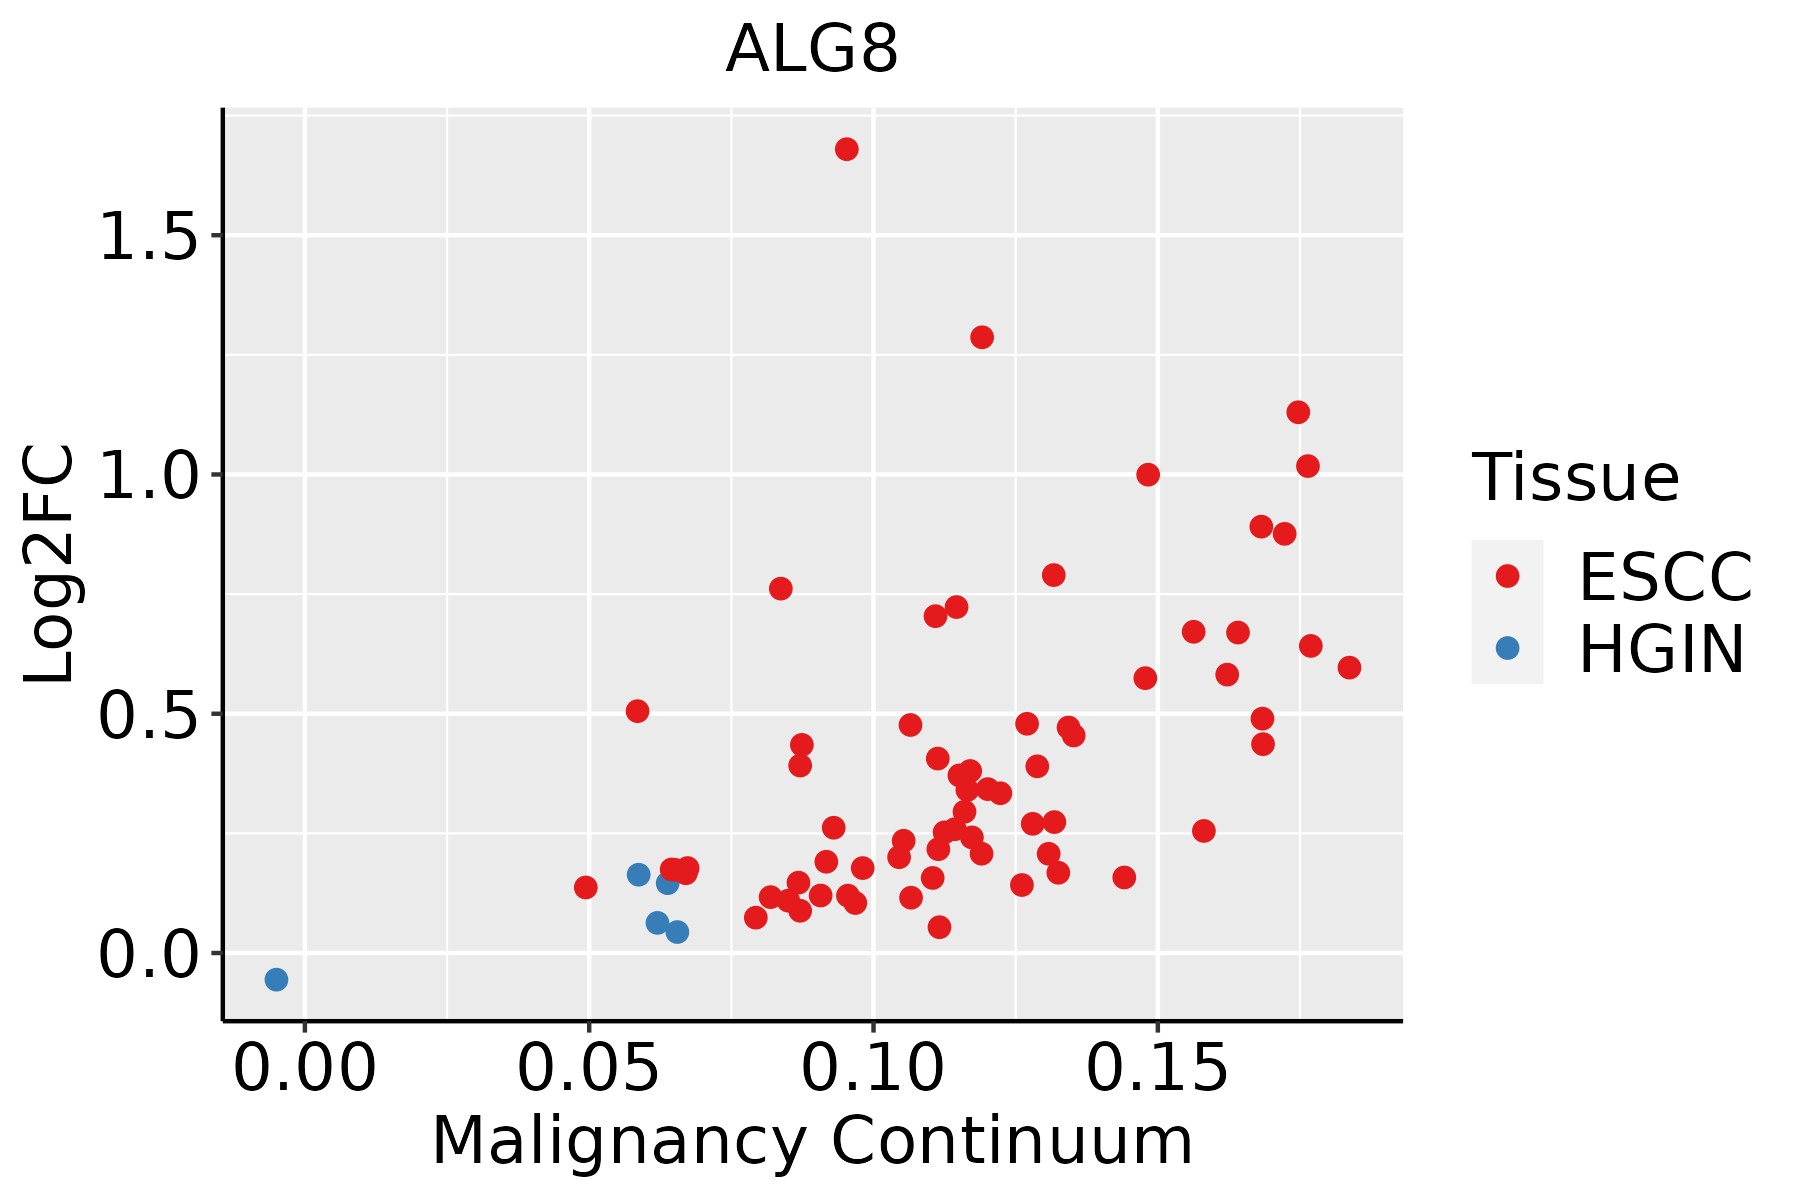 | ESCC: Esophageal squamous cell carcinoma |
| HGIN: High-grade intraepithelial neoplasias | ||
| LGIN: Low-grade intraepithelial neoplasias | ||
| Liver | 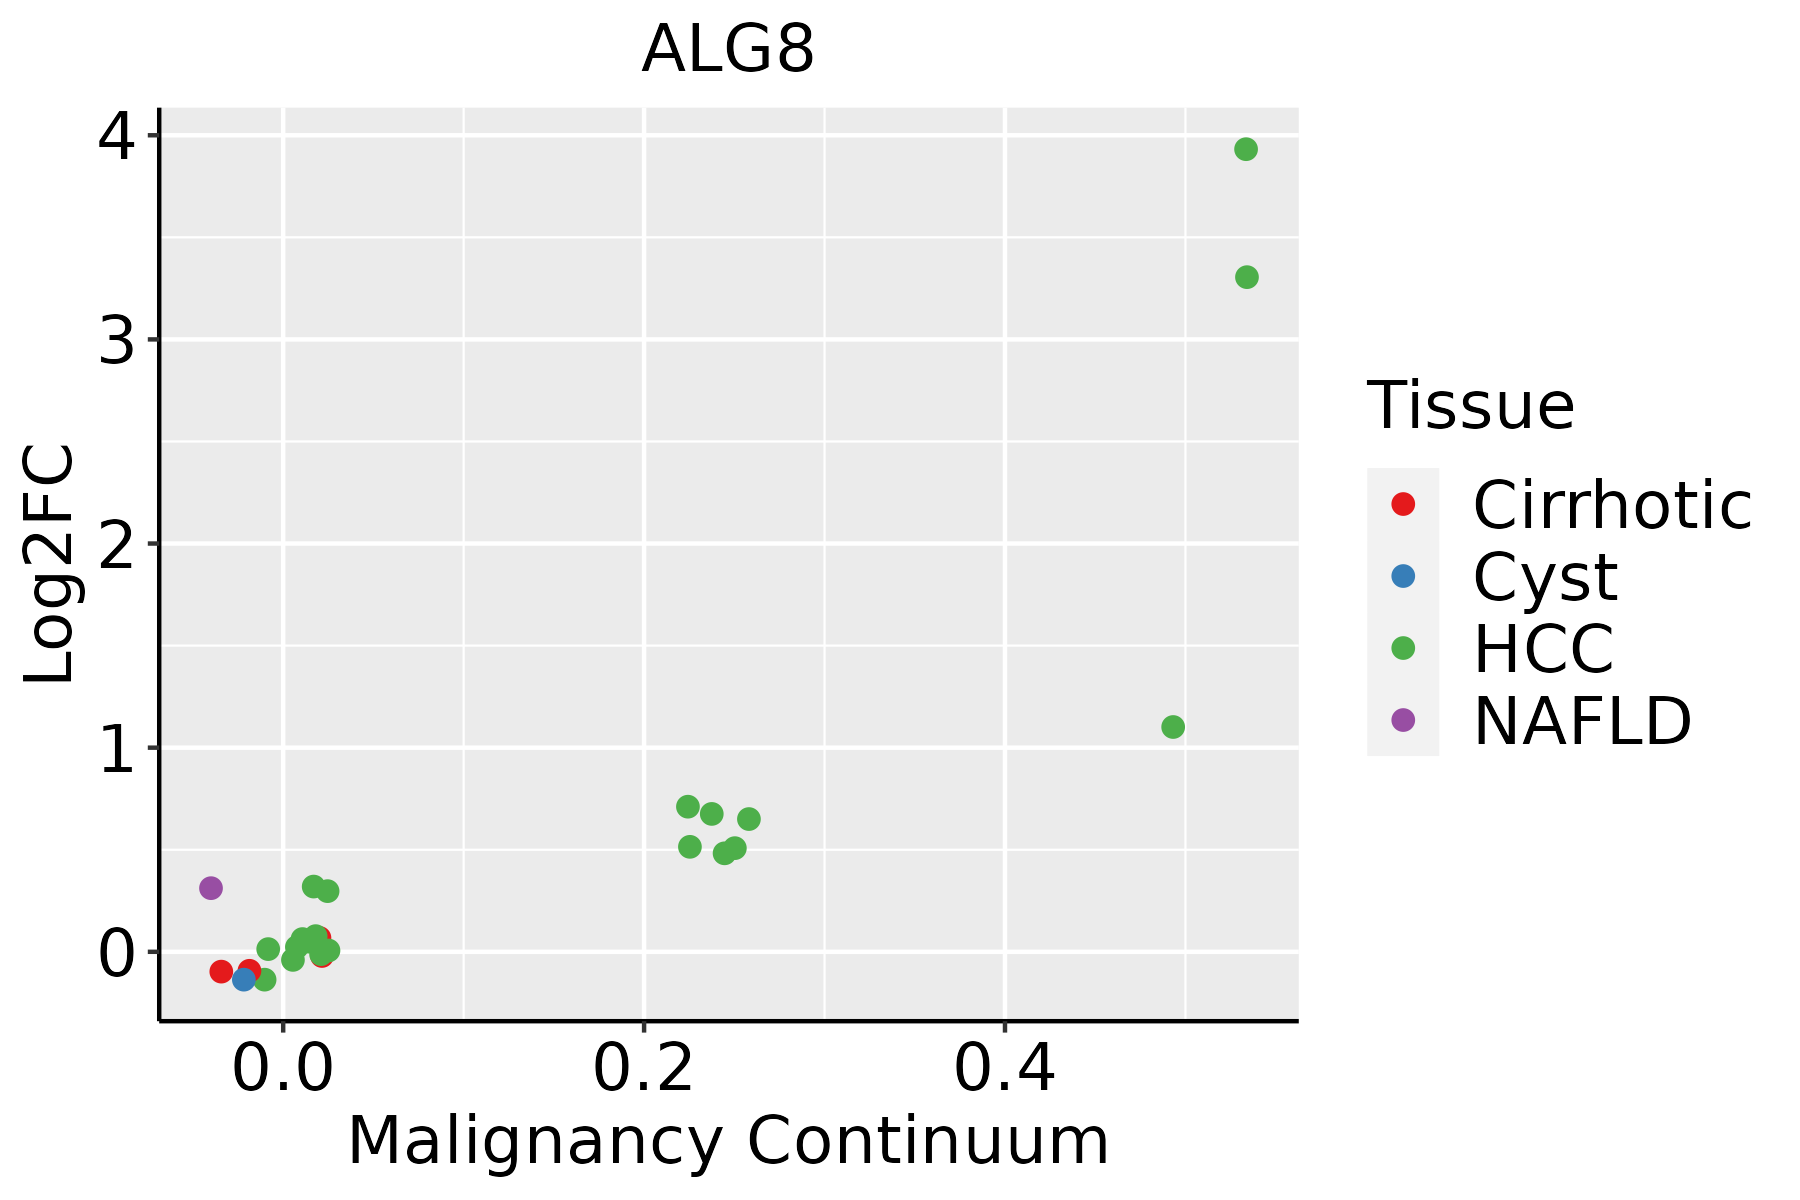 | HCC: Hepatocellular carcinoma |
| NAFLD: Non-alcoholic fatty liver disease | ||
| Oral Cavity | 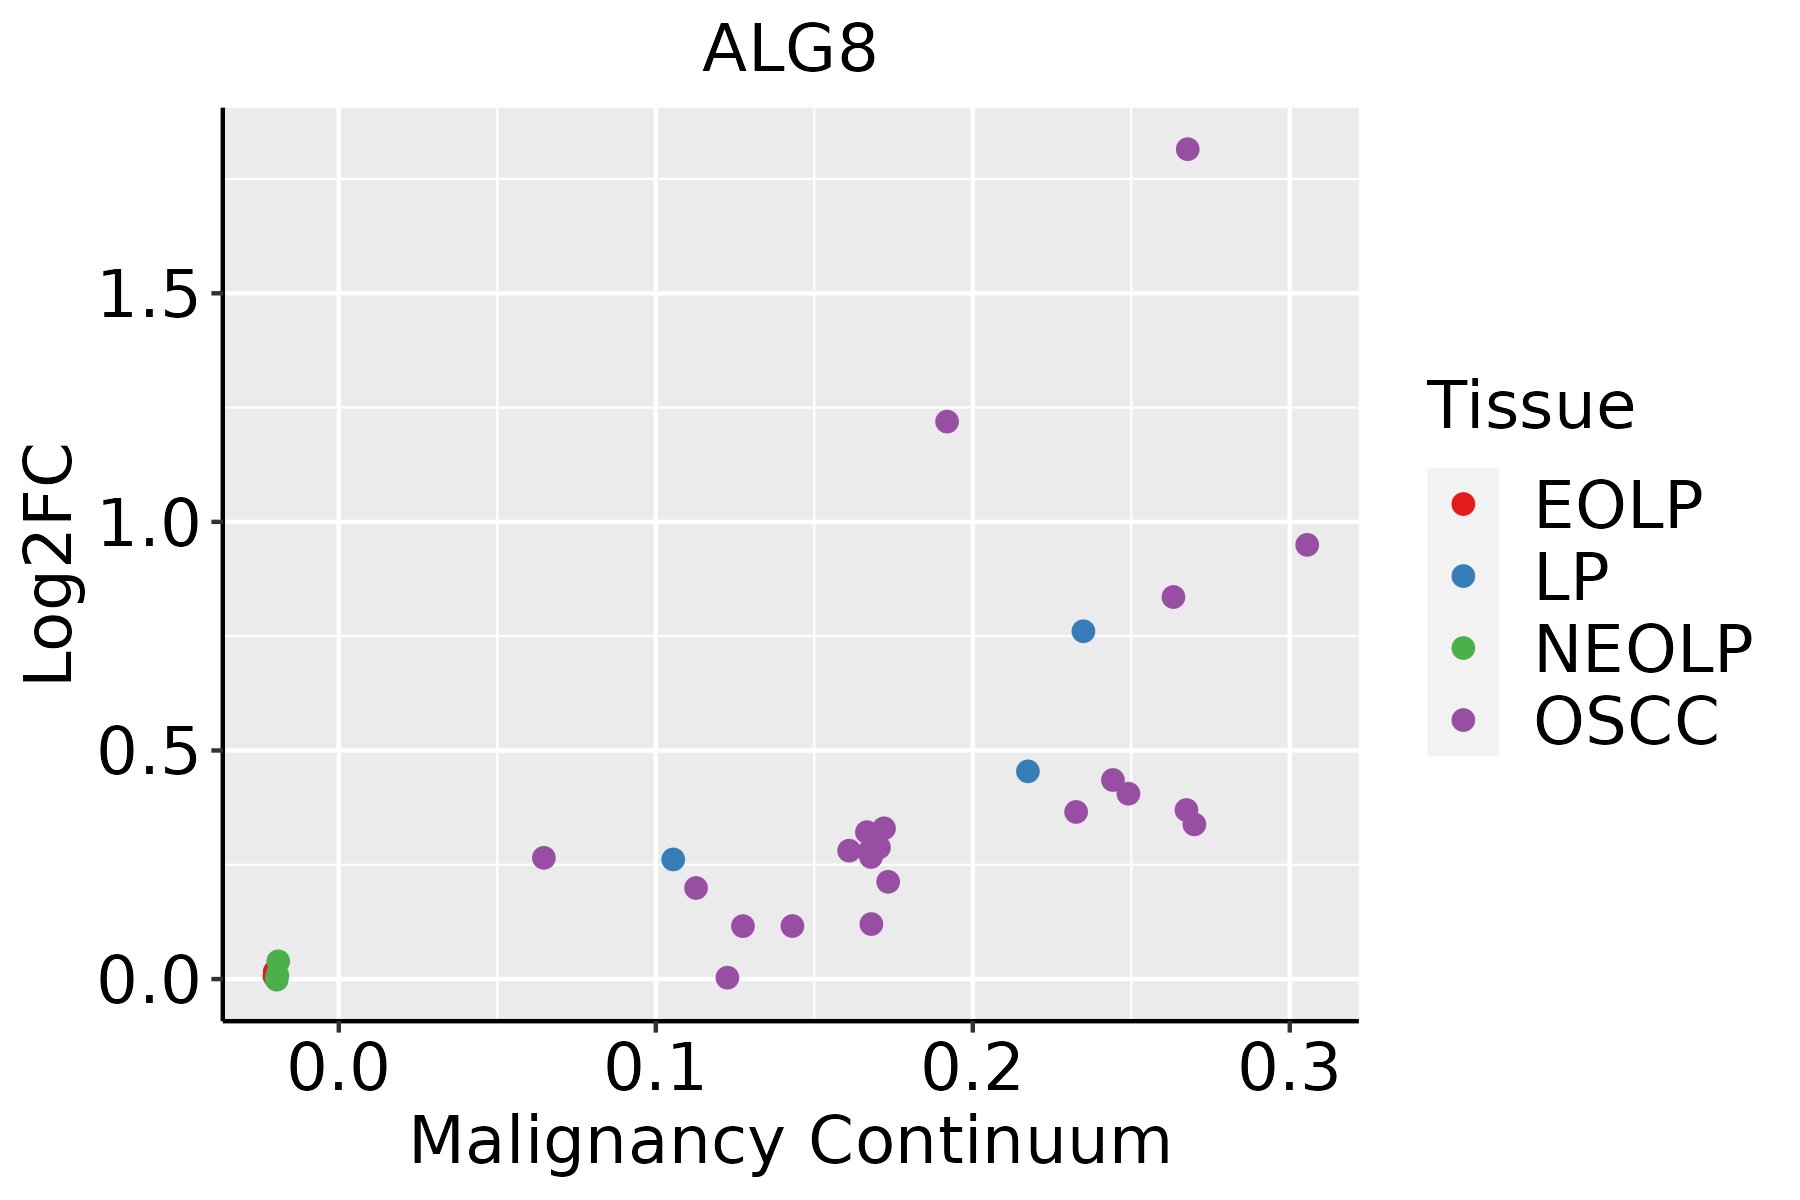 | EOLP: Erosive Oral lichen planus |
| LP: leukoplakia | ||
| NEOLP: Non-erosive oral lichen planus | ||
| OSCC: Oral squamous cell carcinoma | ||
| Skin | 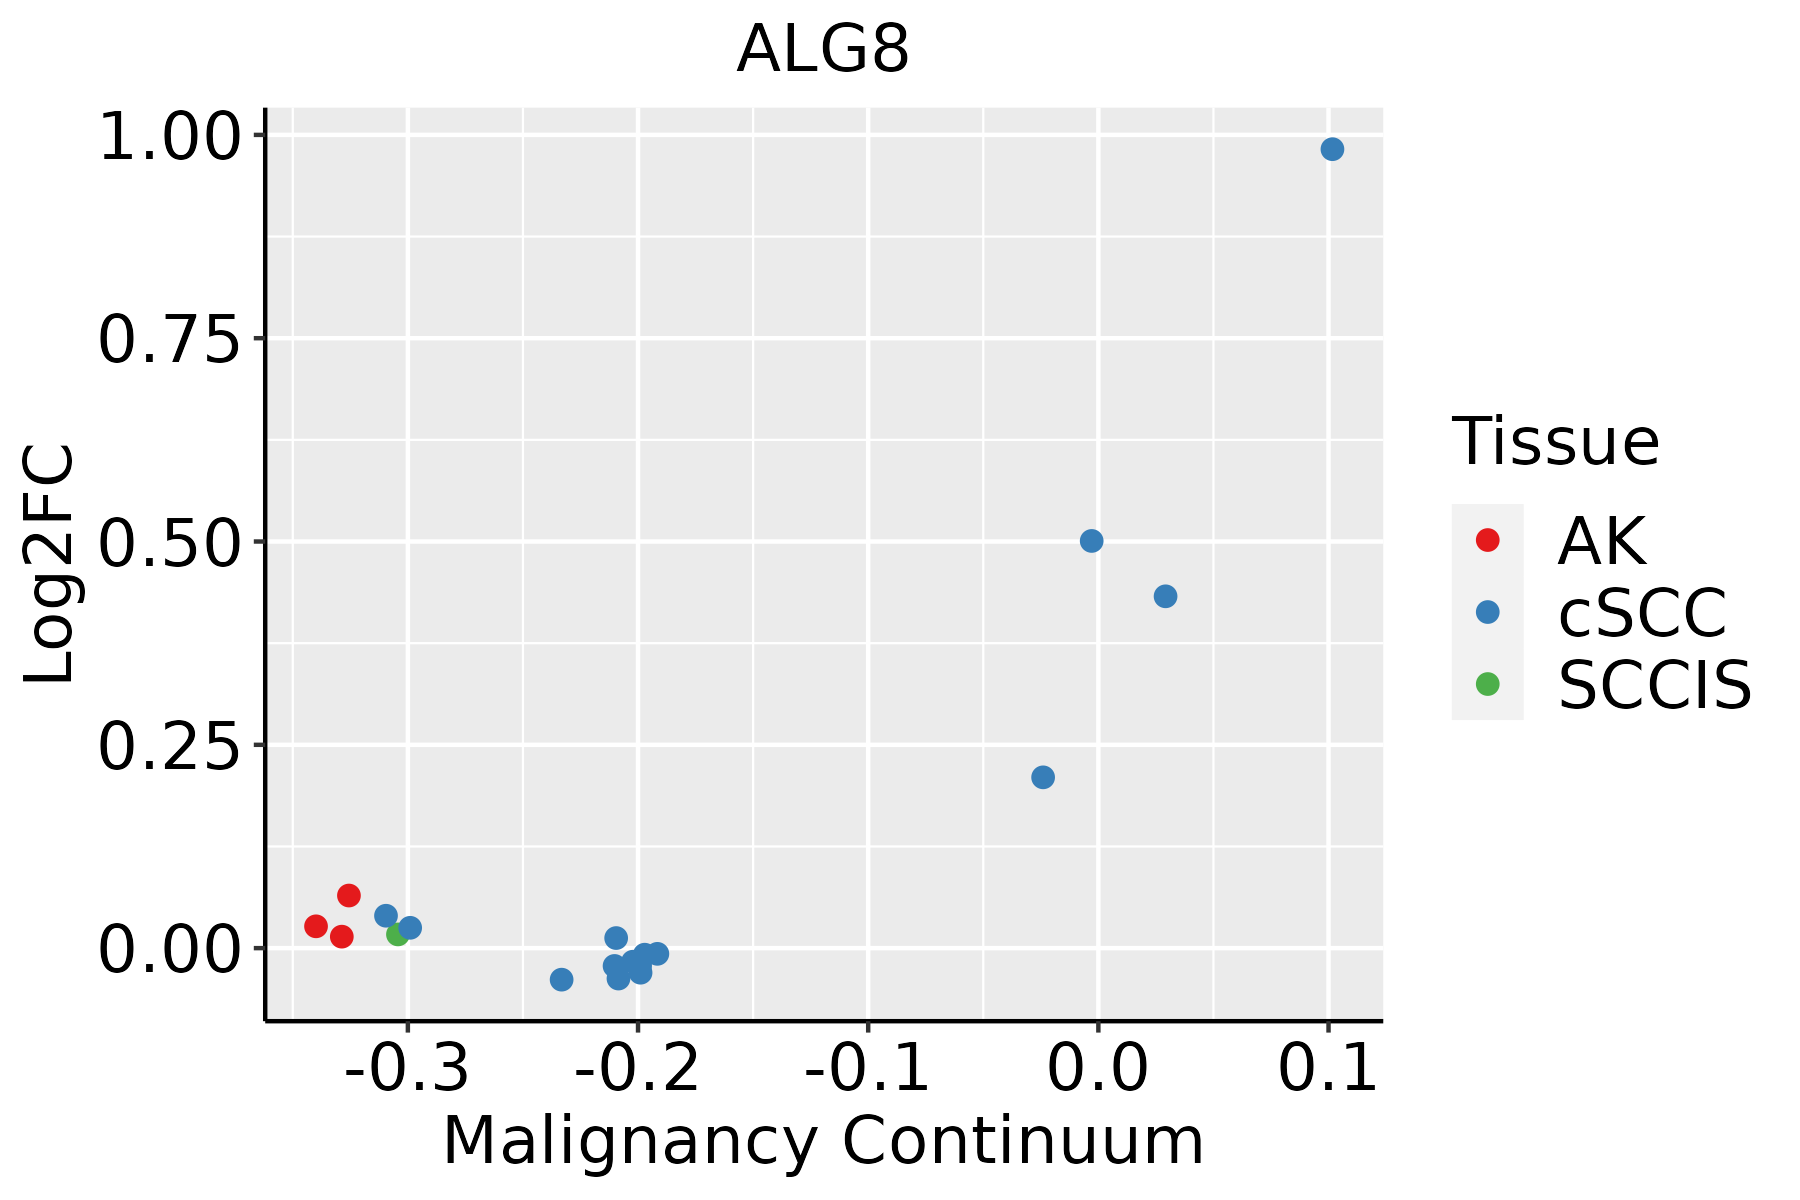 | AK: Actinic keratosis |
| cSCC: Cutaneous squamous cell carcinoma | ||
| SCCIS:squamous cell carcinoma in situ |
| ∗log2FC in expression of this searched gene in stem-like cells from each diseased tissue sample relative to stem-like cells in normal samples in each tissue plotted against the malignancy continuum. Samples are colored based on if they are from different disease stage. |
Top |
Malignant transformation related pathway analysis |
| Find out the enriched GO biological processes and KEGG pathways involved in transition from healthy to precancer to cancer |
| Tissue | Disease Stage | Enriched GO biological Processes |
| Colorectum | AD |  |
| Colorectum | SER |  |
| Colorectum | MSS |  |
| Colorectum | MSI-H |  |
| Colorectum | FAP |  |
| ∗Top 15 enriched GO BP terms are showed in the bar plot of each disease state in each tissue. Each row represents a significant GO biological process which is colored according to the -log10(p.adjust). |
| Page: 1 2 3 4 5 6 7 8 9 |
| GO ID | Tissue | Disease Stage | Description | Gene Ratio | Bg Ratio | pvalue | p.adjust | Count |
| GO:00064876 | Esophagus | HGIN | protein N-linked glycosylation | 17/2587 | 65/18723 | 6.04e-03 | 4.87e-02 | 17 |
| GO:000648714 | Esophagus | ESCC | protein N-linked glycosylation | 51/8552 | 65/18723 | 6.41e-08 | 1.13e-06 | 51 |
| GO:00091002 | Esophagus | ESCC | glycoprotein metabolic process | 226/8552 | 387/18723 | 2.64e-07 | 3.94e-06 | 226 |
| GO:00181969 | Esophagus | ESCC | peptidyl-asparagine modification | 22/8552 | 24/18723 | 2.82e-06 | 3.21e-05 | 22 |
| GO:00700854 | Esophagus | ESCC | glycosylation | 144/8552 | 240/18723 | 5.12e-06 | 5.38e-05 | 144 |
| GO:00182799 | Esophagus | ESCC | protein N-linked glycosylation via asparagine | 21/8552 | 23/18723 | 5.69e-06 | 5.90e-05 | 21 |
| GO:00064865 | Esophagus | ESCC | protein glycosylation | 135/8552 | 226/18723 | 1.36e-05 | 1.24e-04 | 135 |
| GO:00434135 | Esophagus | ESCC | macromolecule glycosylation | 135/8552 | 226/18723 | 1.36e-05 | 1.24e-04 | 135 |
| GO:00091012 | Esophagus | ESCC | glycoprotein biosynthetic process | 181/8552 | 317/18723 | 2.54e-05 | 2.15e-04 | 181 |
| GO:00064882 | Esophagus | ESCC | dolichol-linked oligosaccharide biosynthetic process | 14/8552 | 18/18723 | 5.77e-03 | 2.14e-02 | 14 |
| GO:00064902 | Esophagus | ESCC | oligosaccharide-lipid intermediate biosynthetic process | 14/8552 | 19/18723 | 1.27e-02 | 4.21e-02 | 14 |
| GO:000648711 | Liver | HCC | protein N-linked glycosylation | 48/7958 | 65/18723 | 2.85e-07 | 5.00e-06 | 48 |
| GO:001819611 | Liver | HCC | peptidyl-asparagine modification | 21/7958 | 24/18723 | 6.62e-06 | 7.97e-05 | 21 |
| GO:001827911 | Liver | HCC | protein N-linked glycosylation via asparagine | 20/7958 | 23/18723 | 1.37e-05 | 1.51e-04 | 20 |
| GO:00064862 | Liver | HCC | protein glycosylation | 122/7958 | 226/18723 | 3.11e-04 | 2.21e-03 | 122 |
| GO:00434132 | Liver | HCC | macromolecule glycosylation | 122/7958 | 226/18723 | 3.11e-04 | 2.21e-03 | 122 |
| GO:00700852 | Liver | HCC | glycosylation | 128/7958 | 240/18723 | 4.35e-04 | 2.92e-03 | 128 |
| GO:0009100 | Liver | HCC | glycoprotein metabolic process | 193/7958 | 387/18723 | 1.89e-03 | 9.62e-03 | 193 |
| GO:00064875 | Oral cavity | OSCC | protein N-linked glycosylation | 44/7305 | 65/18723 | 2.63e-06 | 3.26e-05 | 44 |
| GO:00181968 | Oral cavity | OSCC | peptidyl-asparagine modification | 20/7305 | 24/18723 | 1.10e-05 | 1.14e-04 | 20 |
| Page: 1 2 |
| Pathway ID | Tissue | Disease Stage | Description | Gene Ratio | Bg Ratio | pvalue | p.adjust | qvalue | Count |
| hsa005106 | Esophagus | HGIN | N-Glycan biosynthesis | 17/1383 | 53/8465 | 3.43e-03 | 2.54e-02 | 2.02e-02 | 17 |
| hsa0051013 | Esophagus | HGIN | N-Glycan biosynthesis | 17/1383 | 53/8465 | 3.43e-03 | 2.54e-02 | 2.02e-02 | 17 |
| hsa0051023 | Esophagus | ESCC | N-Glycan biosynthesis | 39/4205 | 53/8465 | 3.26e-04 | 1.15e-03 | 5.89e-04 | 39 |
| hsa0051033 | Esophagus | ESCC | N-Glycan biosynthesis | 39/4205 | 53/8465 | 3.26e-04 | 1.15e-03 | 5.89e-04 | 39 |
| hsa0051021 | Liver | HCC | N-Glycan biosynthesis | 40/4020 | 53/8465 | 2.95e-05 | 1.87e-04 | 1.04e-04 | 40 |
| hsa0051031 | Liver | HCC | N-Glycan biosynthesis | 40/4020 | 53/8465 | 2.95e-05 | 1.87e-04 | 1.04e-04 | 40 |
| hsa005105 | Oral cavity | OSCC | N-Glycan biosynthesis | 39/3704 | 53/8465 | 9.77e-06 | 4.36e-05 | 2.22e-05 | 39 |
| hsa0051012 | Oral cavity | OSCC | N-Glycan biosynthesis | 39/3704 | 53/8465 | 9.77e-06 | 4.36e-05 | 2.22e-05 | 39 |
| hsa0051022 | Oral cavity | LP | N-Glycan biosynthesis | 31/2418 | 53/8465 | 4.86e-06 | 4.14e-05 | 2.67e-05 | 31 |
| hsa0051032 | Oral cavity | LP | N-Glycan biosynthesis | 31/2418 | 53/8465 | 4.86e-06 | 4.14e-05 | 2.67e-05 | 31 |
| Page: 1 |
Top |
Cell-cell communication analysis |
| Identification of potential cell-cell interactions between two cell types and their ligand-receptor pairs for different disease states |
| Ligand | Receptor | LRpair | Pathway | Tissue | Disease Stage |
| Page: 1 |
Top |
Single-cell gene regulatory network inference analysis |
| Find out the significant the regulons (TFs) and the target genes of each regulon across cell types for different disease states |
| TF | Cell Type | Tissue | Disease Stage | Target Gene | RSS | Regulon Activity |
| ∗The dot plots of a searched regulon are shown for all cell subpopulations in each disease state of each tissue based on the regulon specific score inferred using pySCENIC and by calculating the average expression. |
| Page: 1 |
Top |
Somatic mutation of malignant transformation related genes |
| Annotation of somatic variants for genes involved in malignant transformation |
| Hugo Symbol | Variant Class | Variant Classification | dbSNP RS | HGVSc | HGVSp | HGVSp Short | SWISSPROT | BIOTYPE | SIFT | PolyPhen | Tumor Sample Barcode | Tissue | Histology | Sex | Age | Stage | Therapy Types | Drugs | Outcome |
| ALG8 | SNV | Missense_Mutation | c.988N>T | p.Pro330Ser | p.P330S | Q9BVK2 | protein_coding | deleterious(0) | probably_damaging(1) | TCGA-A8-A09A-01 | Breast | breast invasive carcinoma | Female | <65 | I/II | Hormone Therapy | tamoxiphen | SD | |
| ALG8 | insertion | Frame_Shift_Ins | novel | c.913_914insCTGCCTGCCTTGGCCTCCCT | p.Phe305SerfsTer19 | p.F305Sfs*19 | Q9BVK2 | protein_coding | TCGA-BH-A0B8-01 | Breast | breast invasive carcinoma | Female | <65 | I/II | Hormone Therapy | arimidex | SD | ||
| ALG8 | insertion | Nonsense_Mutation | novel | c.911_912insCTCCTAACCTCAAGTG | p.Lys304AsnfsTer3 | p.K304Nfs*3 | Q9BVK2 | protein_coding | TCGA-BH-A0B8-01 | Breast | breast invasive carcinoma | Female | <65 | I/II | Hormone Therapy | arimidex | SD | ||
| ALG8 | insertion | In_Frame_Ins | novel | c.715_716insAATGTATTTTAAAATTAATTTCACCTCTTTACAAAC | p.Ile239delinsLysCysIleLeuLysLeuIleSerProLeuTyrLysLeu | p.I239delinsKCILKLISPLYKL | Q9BVK2 | protein_coding | TCGA-BH-A0HK-01 | Breast | breast invasive carcinoma | Female | >=65 | I/II | Hormone Therapy | arimidex | SD | ||
| ALG8 | deletion | Frame_Shift_Del | novel | c.1413delN | p.Val472SerfsTer14 | p.V472Sfs*14 | Q9BVK2 | protein_coding | TCGA-D8-A27V-01 | Breast | breast invasive carcinoma | Female | <65 | I/II | Hormone Therapy | tamoxiphen | SD | ||
| ALG8 | SNV | Missense_Mutation | c.484C>G | p.His162Asp | p.H162D | Q9BVK2 | protein_coding | deleterious(0.02) | probably_damaging(0.956) | TCGA-C5-A8XK-01 | Cervix | cervical & endocervical cancer | Female | <65 | I/II | Chemotherapy | cisplatin | SD | |
| ALG8 | SNV | Missense_Mutation | c.790N>G | p.Gln264Glu | p.Q264E | Q9BVK2 | protein_coding | deleterious(0) | probably_damaging(0.998) | TCGA-EK-A2RK-01 | Cervix | cervical & endocervical cancer | Female | >=65 | I/II | Unknown | Unknown | SD | |
| ALG8 | SNV | Missense_Mutation | c.484N>T | p.His162Tyr | p.H162Y | Q9BVK2 | protein_coding | deleterious(0) | probably_damaging(0.983) | TCGA-LP-A4AV-01 | Cervix | cervical & endocervical cancer | Female | <65 | I/II | Unknown | Unknown | SD | |
| ALG8 | SNV | Missense_Mutation | novel | c.709N>T | p.Arg237Cys | p.R237C | Q9BVK2 | protein_coding | deleterious(0) | probably_damaging(0.977) | TCGA-AA-3984-01 | Colorectum | colon adenocarcinoma | Female | <65 | I/II | Unknown | Unknown | SD |
| ALG8 | SNV | Missense_Mutation | c.1535N>G | p.Val512Gly | p.V512G | Q9BVK2 | protein_coding | tolerated(0.16) | benign(0.112) | TCGA-AA-A010-01 | Colorectum | colon adenocarcinoma | Female | <65 | I/II | Chemotherapy | folinic | CR |
| Page: 1 2 3 4 5 6 |
Top |
Related drugs of malignant transformation related genes |
| Identification of chemicals and drugs interact with genes involved in malignant transfromation |
| (DGIdb 4.0) |
| Entrez ID | Symbol | Category | Interaction Types | Drug Claim Name | Drug Name | PMIDs |
| Page: 1 |

Copyright 2023-Present -The University of Texas Health Science Center at Houston |