
|
|||||
|
 | |
| |
| |
| |
| |
| |
|
Gene: ALG6 |
Gene summary for ALG6 |
| Gene information | Species | Human | Gene symbol | ALG6 | Gene ID | 29929 |
| Gene name | ALG6 alpha-1,3-glucosyltransferase | |
| Gene Alias | CDG1C | |
| Cytomap | 1p31.3 | |
| Gene Type | protein-coding | GO ID | GO:0006464 | UniProtAcc | Q9Y672 |
Top |
Malignant transformation analysis |
| Identification of the aberrant gene expression in precancerous and cancerous lesions by comparing the gene expression of stem-like cells in diseased tissues with normal stem cells |
| Entrez ID | Symbol | Replicates | Species | Organ | Tissue | Adj P-value | Log2FC | Malignancy |
| 29929 | ALG6 | LZE4T | Human | Esophagus | ESCC | 3.77e-05 | 9.18e-02 | 0.0811 |
| 29929 | ALG6 | LZE8T | Human | Esophagus | ESCC | 1.37e-04 | 1.28e-01 | 0.067 |
| 29929 | ALG6 | LZE24T | Human | Esophagus | ESCC | 1.56e-11 | 2.20e-01 | 0.0596 |
| 29929 | ALG6 | LZE21T | Human | Esophagus | ESCC | 8.06e-03 | 1.43e-01 | 0.0655 |
| 29929 | ALG6 | LZE6T | Human | Esophagus | ESCC | 1.82e-04 | 1.32e-01 | 0.0845 |
| 29929 | ALG6 | P2T-E | Human | Esophagus | ESCC | 1.51e-30 | 4.56e-01 | 0.1177 |
| 29929 | ALG6 | P4T-E | Human | Esophagus | ESCC | 8.85e-18 | 3.64e-01 | 0.1323 |
| 29929 | ALG6 | P5T-E | Human | Esophagus | ESCC | 1.42e-08 | 1.20e-01 | 0.1327 |
| 29929 | ALG6 | P8T-E | Human | Esophagus | ESCC | 9.53e-11 | 1.74e-01 | 0.0889 |
| 29929 | ALG6 | P9T-E | Human | Esophagus | ESCC | 6.77e-05 | 1.10e-01 | 0.1131 |
| 29929 | ALG6 | P10T-E | Human | Esophagus | ESCC | 1.31e-17 | 2.81e-01 | 0.116 |
| 29929 | ALG6 | P11T-E | Human | Esophagus | ESCC | 1.73e-06 | 2.41e-01 | 0.1426 |
| 29929 | ALG6 | P12T-E | Human | Esophagus | ESCC | 1.55e-11 | 2.16e-01 | 0.1122 |
| 29929 | ALG6 | P15T-E | Human | Esophagus | ESCC | 3.52e-13 | 1.91e-01 | 0.1149 |
| 29929 | ALG6 | P16T-E | Human | Esophagus | ESCC | 5.58e-12 | 2.21e-01 | 0.1153 |
| 29929 | ALG6 | P17T-E | Human | Esophagus | ESCC | 3.80e-02 | 8.45e-02 | 0.1278 |
| 29929 | ALG6 | P20T-E | Human | Esophagus | ESCC | 1.63e-10 | 2.05e-01 | 0.1124 |
| 29929 | ALG6 | P21T-E | Human | Esophagus | ESCC | 3.68e-24 | 3.12e-01 | 0.1617 |
| 29929 | ALG6 | P22T-E | Human | Esophagus | ESCC | 5.05e-11 | 1.26e-01 | 0.1236 |
| 29929 | ALG6 | P23T-E | Human | Esophagus | ESCC | 3.05e-18 | 4.40e-01 | 0.108 |
| Page: 1 2 3 4 |
| Tissue | Expression Dynamics | Abbreviation |
| Esophagus | 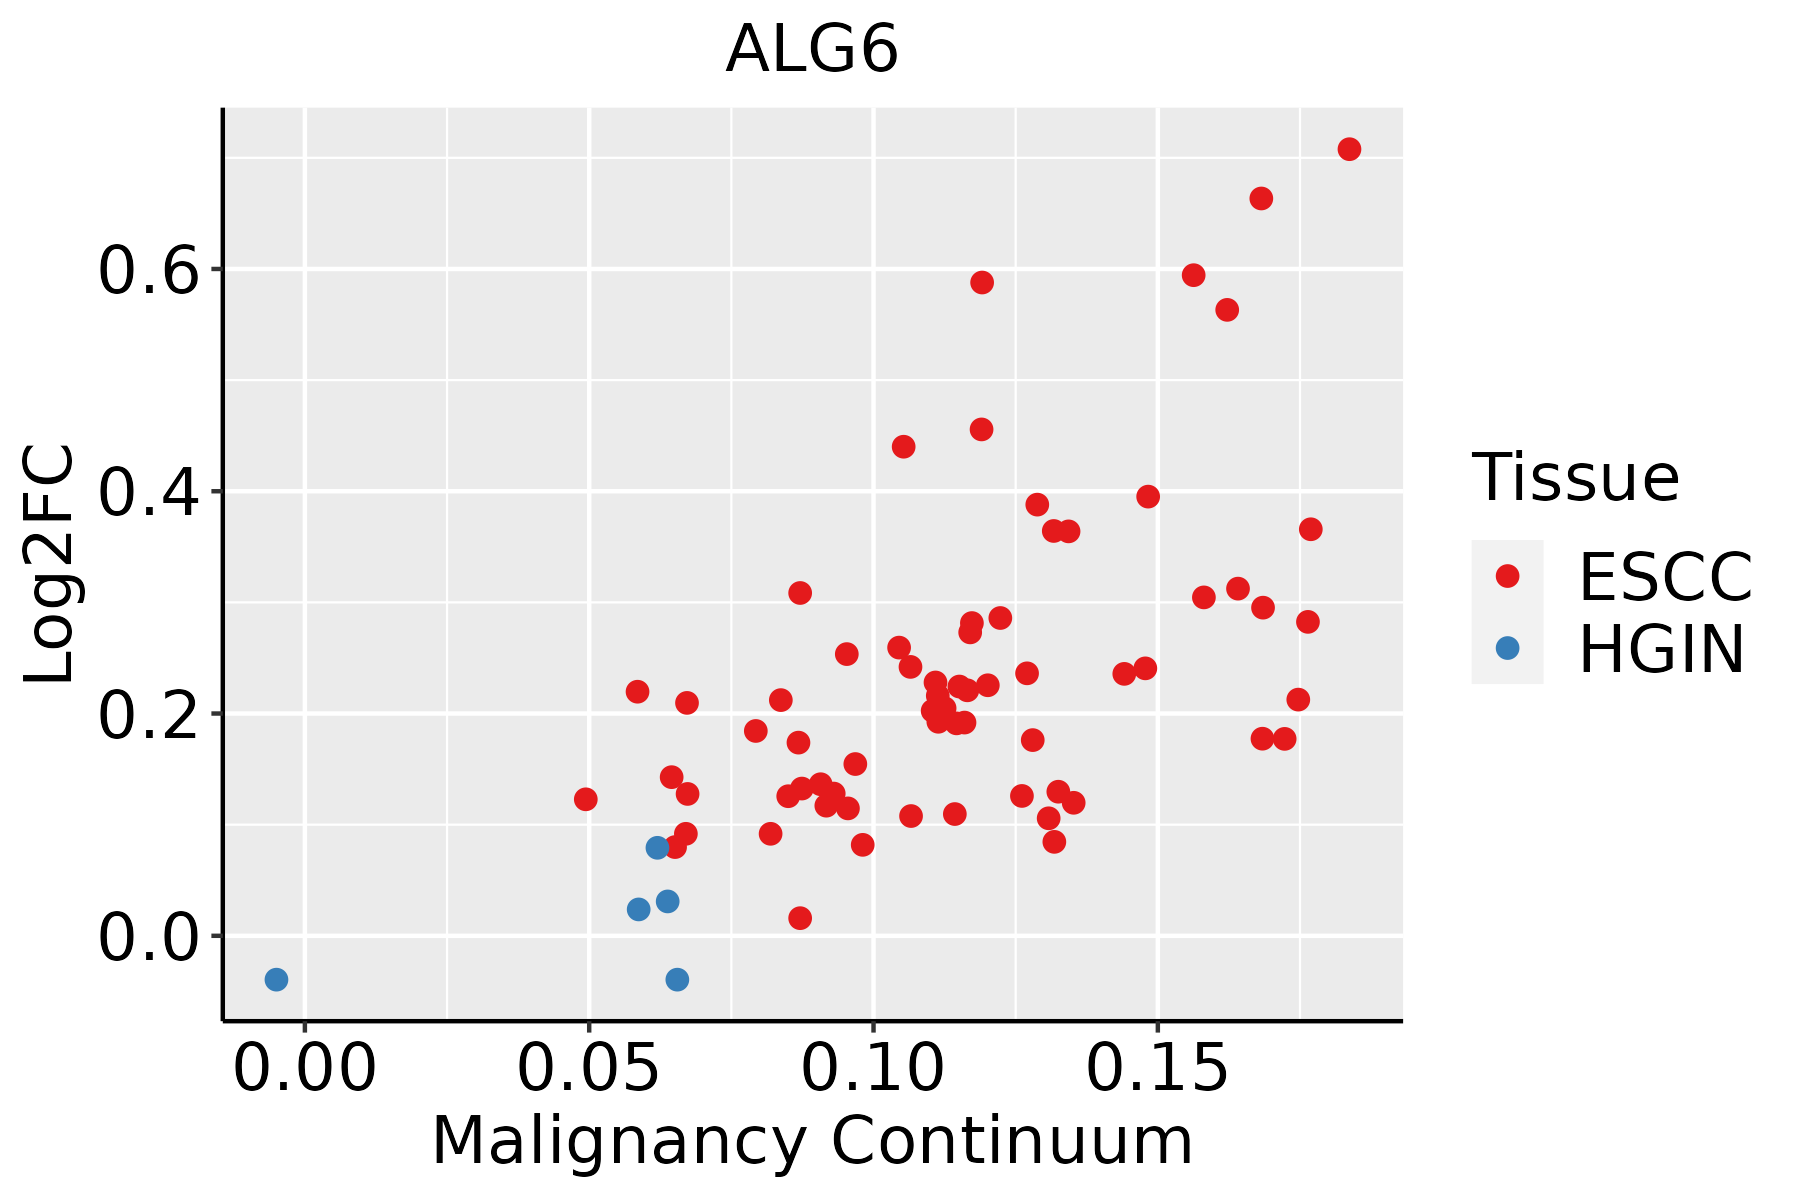 | ESCC: Esophageal squamous cell carcinoma |
| HGIN: High-grade intraepithelial neoplasias | ||
| LGIN: Low-grade intraepithelial neoplasias | ||
| Oral Cavity | 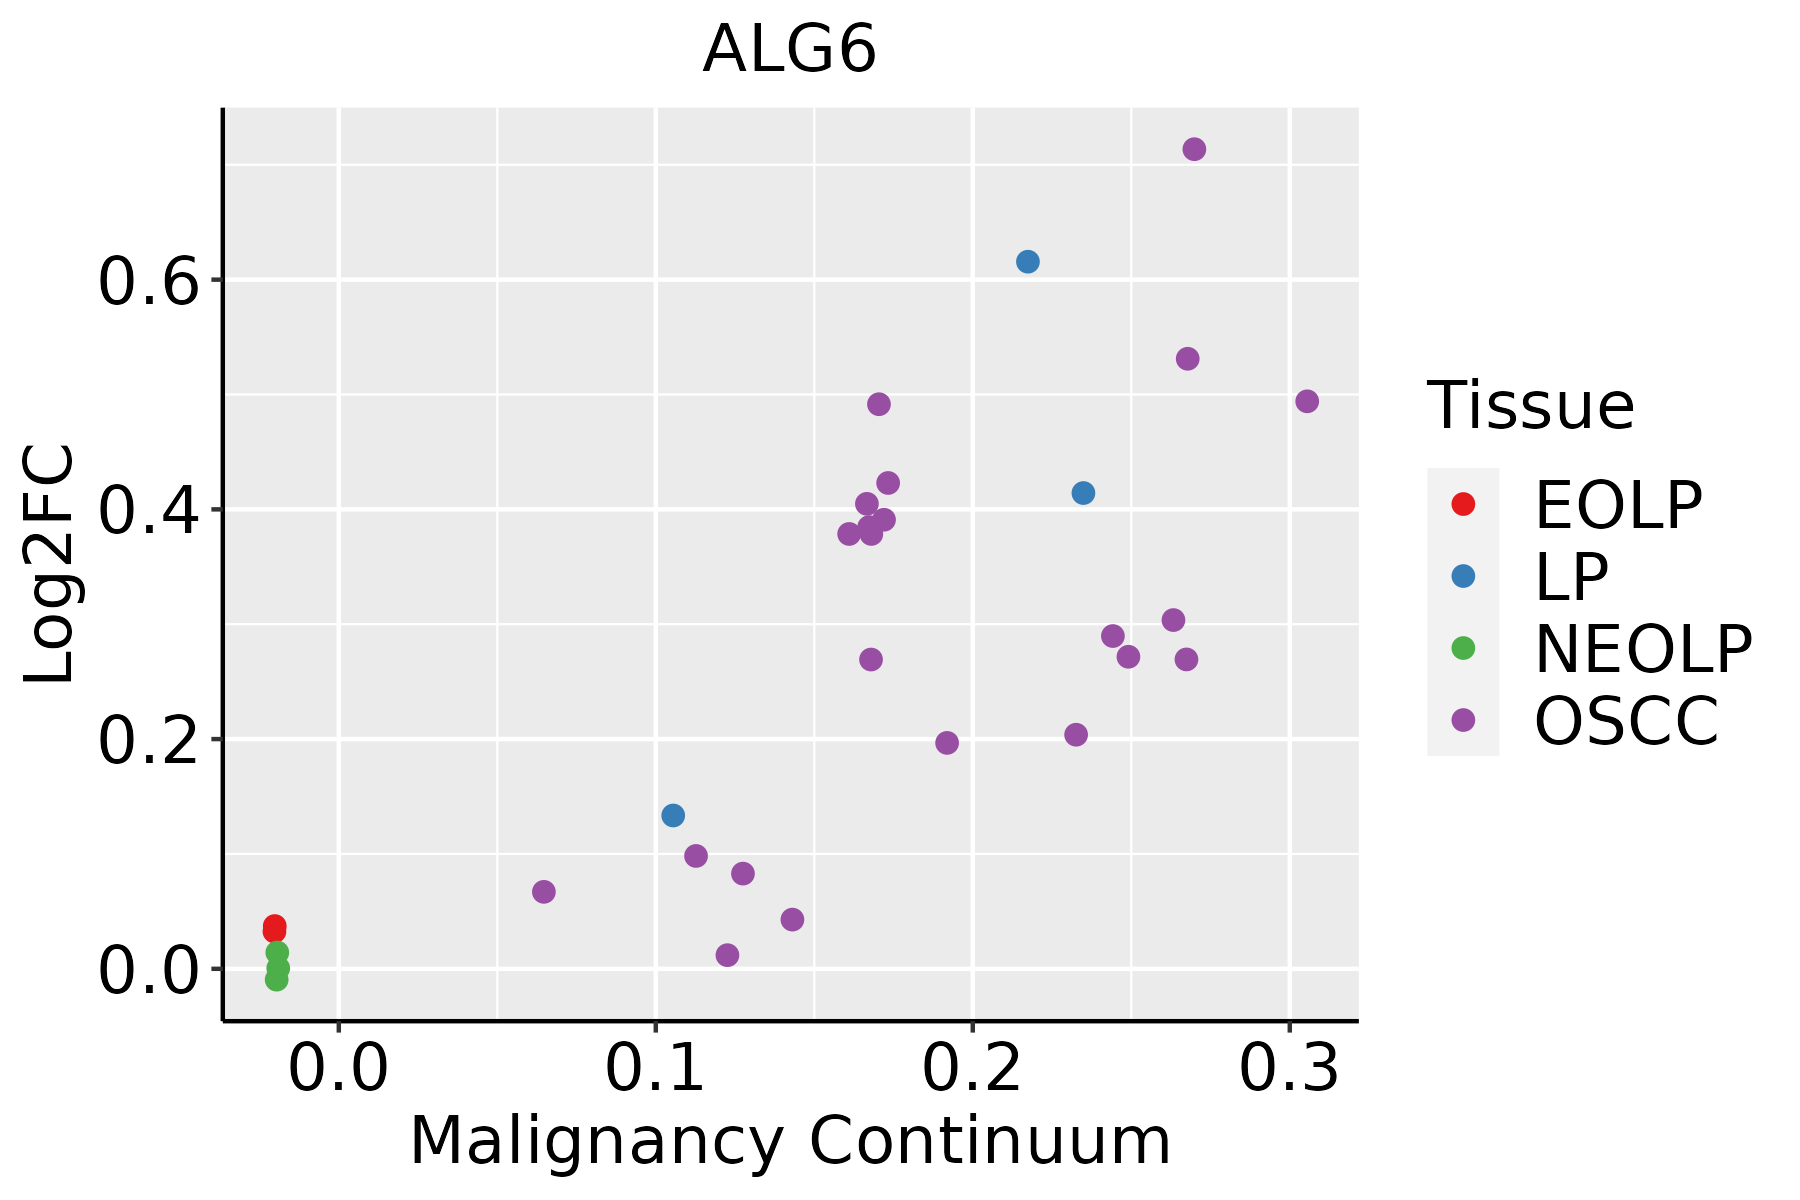 | EOLP: Erosive Oral lichen planus |
| LP: leukoplakia | ||
| NEOLP: Non-erosive oral lichen planus | ||
| OSCC: Oral squamous cell carcinoma |
| ∗log2FC in expression of this searched gene in stem-like cells from each diseased tissue sample relative to stem-like cells in normal samples in each tissue plotted against the malignancy continuum. Samples are colored based on if they are from different disease stage. |
Top |
Malignant transformation related pathway analysis |
| Find out the enriched GO biological processes and KEGG pathways involved in transition from healthy to precancer to cancer |
| Tissue | Disease Stage | Enriched GO biological Processes |
| Colorectum | AD |  |
| Colorectum | SER |  |
| Colorectum | MSS |  |
| Colorectum | MSI-H |  |
| Colorectum | FAP |  |
| ∗Top 15 enriched GO BP terms are showed in the bar plot of each disease state in each tissue. Each row represents a significant GO biological process which is colored according to the -log10(p.adjust). |
| Page: 1 2 3 4 5 6 7 8 9 |
| GO ID | Tissue | Disease Stage | Description | Gene Ratio | Bg Ratio | pvalue | p.adjust | Count |
| GO:000648714 | Esophagus | ESCC | protein N-linked glycosylation | 51/8552 | 65/18723 | 6.41e-08 | 1.13e-06 | 51 |
| GO:00091002 | Esophagus | ESCC | glycoprotein metabolic process | 226/8552 | 387/18723 | 2.64e-07 | 3.94e-06 | 226 |
| GO:00700854 | Esophagus | ESCC | glycosylation | 144/8552 | 240/18723 | 5.12e-06 | 5.38e-05 | 144 |
| GO:00064865 | Esophagus | ESCC | protein glycosylation | 135/8552 | 226/18723 | 1.36e-05 | 1.24e-04 | 135 |
| GO:00434135 | Esophagus | ESCC | macromolecule glycosylation | 135/8552 | 226/18723 | 1.36e-05 | 1.24e-04 | 135 |
| GO:00091012 | Esophagus | ESCC | glycoprotein biosynthetic process | 181/8552 | 317/18723 | 2.54e-05 | 2.15e-04 | 181 |
| GO:00064882 | Esophagus | ESCC | dolichol-linked oligosaccharide biosynthetic process | 14/8552 | 18/18723 | 5.77e-03 | 2.14e-02 | 14 |
| GO:00064902 | Esophagus | ESCC | oligosaccharide-lipid intermediate biosynthetic process | 14/8552 | 19/18723 | 1.27e-02 | 4.21e-02 | 14 |
| GO:00064875 | Oral cavity | OSCC | protein N-linked glycosylation | 44/7305 | 65/18723 | 2.63e-06 | 3.26e-05 | 44 |
| GO:0006488 | Oral cavity | OSCC | dolichol-linked oligosaccharide biosynthetic process | 15/7305 | 18/18723 | 1.53e-04 | 1.07e-03 | 15 |
| GO:00091001 | Oral cavity | OSCC | glycoprotein metabolic process | 185/7305 | 387/18723 | 2.37e-04 | 1.54e-03 | 185 |
| GO:0006490 | Oral cavity | OSCC | oligosaccharide-lipid intermediate biosynthetic process | 15/7305 | 19/18723 | 4.64e-04 | 2.76e-03 | 15 |
| GO:00091011 | Oral cavity | OSCC | glycoprotein biosynthetic process | 151/7305 | 317/18723 | 1.01e-03 | 5.26e-03 | 151 |
| GO:00064864 | Oral cavity | OSCC | protein glycosylation | 111/7305 | 226/18723 | 1.22e-03 | 6.10e-03 | 111 |
| GO:00434134 | Oral cavity | OSCC | macromolecule glycosylation | 111/7305 | 226/18723 | 1.22e-03 | 6.10e-03 | 111 |
| GO:00700853 | Oral cavity | OSCC | glycosylation | 117/7305 | 240/18723 | 1.29e-03 | 6.42e-03 | 117 |
| GO:000648713 | Oral cavity | LP | protein N-linked glycosylation | 35/4623 | 65/18723 | 4.33e-07 | 1.22e-05 | 35 |
| GO:00064881 | Oral cavity | LP | dolichol-linked oligosaccharide biosynthetic process | 12/4623 | 18/18723 | 2.02e-04 | 2.20e-03 | 12 |
| GO:00064901 | Oral cavity | LP | oligosaccharide-lipid intermediate biosynthetic process | 12/4623 | 19/18723 | 4.25e-04 | 4.08e-03 | 12 |
| GO:007008511 | Oral cavity | LP | glycosylation | 77/4623 | 240/18723 | 5.60e-03 | 3.38e-02 | 77 |
| Page: 1 2 |
| Pathway ID | Tissue | Disease Stage | Description | Gene Ratio | Bg Ratio | pvalue | p.adjust | qvalue | Count |
| hsa0051023 | Esophagus | ESCC | N-Glycan biosynthesis | 39/4205 | 53/8465 | 3.26e-04 | 1.15e-03 | 5.89e-04 | 39 |
| hsa0051033 | Esophagus | ESCC | N-Glycan biosynthesis | 39/4205 | 53/8465 | 3.26e-04 | 1.15e-03 | 5.89e-04 | 39 |
| hsa005105 | Oral cavity | OSCC | N-Glycan biosynthesis | 39/3704 | 53/8465 | 9.77e-06 | 4.36e-05 | 2.22e-05 | 39 |
| hsa0051012 | Oral cavity | OSCC | N-Glycan biosynthesis | 39/3704 | 53/8465 | 9.77e-06 | 4.36e-05 | 2.22e-05 | 39 |
| hsa0051022 | Oral cavity | LP | N-Glycan biosynthesis | 31/2418 | 53/8465 | 4.86e-06 | 4.14e-05 | 2.67e-05 | 31 |
| hsa0051032 | Oral cavity | LP | N-Glycan biosynthesis | 31/2418 | 53/8465 | 4.86e-06 | 4.14e-05 | 2.67e-05 | 31 |
| Page: 1 |
Top |
Cell-cell communication analysis |
| Identification of potential cell-cell interactions between two cell types and their ligand-receptor pairs for different disease states |
| Ligand | Receptor | LRpair | Pathway | Tissue | Disease Stage |
| Page: 1 |
Top |
Single-cell gene regulatory network inference analysis |
| Find out the significant the regulons (TFs) and the target genes of each regulon across cell types for different disease states |
| TF | Cell Type | Tissue | Disease Stage | Target Gene | RSS | Regulon Activity |
| ∗The dot plots of a searched regulon are shown for all cell subpopulations in each disease state of each tissue based on the regulon specific score inferred using pySCENIC and by calculating the average expression. |
| Page: 1 |
Top |
Somatic mutation of malignant transformation related genes |
| Annotation of somatic variants for genes involved in malignant transformation |
| Hugo Symbol | Variant Class | Variant Classification | dbSNP RS | HGVSc | HGVSp | HGVSp Short | SWISSPROT | BIOTYPE | SIFT | PolyPhen | Tumor Sample Barcode | Tissue | Histology | Sex | Age | Stage | Therapy Types | Drugs | Outcome |
| ALG6 | SNV | Missense_Mutation | novel | c.823G>T | p.Val275Leu | p.V275L | Q9Y672 | protein_coding | deleterious(0.03) | benign(0.307) | TCGA-A2-A1FW-01 | Breast | breast invasive carcinoma | Female | <65 | III/IV | Chemotherapy | cytoxan | SD |
| ALG6 | SNV | Missense_Mutation | novel | c.823N>T | p.Val275Leu | p.V275L | Q9Y672 | protein_coding | deleterious(0.03) | benign(0.307) | TCGA-A2-A1G0-01 | Breast | breast invasive carcinoma | Female | <65 | I/II | Chemotherapy | taxotere | SD |
| ALG6 | SNV | Missense_Mutation | novel | c.823N>T | p.Val275Leu | p.V275L | Q9Y672 | protein_coding | deleterious(0.03) | benign(0.307) | TCGA-A8-A09V-01 | Breast | breast invasive carcinoma | Female | <65 | I/II | Hormone Therapy | tamoxiphen | SD |
| ALG6 | SNV | Missense_Mutation | c.112N>G | p.Tyr38Asp | p.Y38D | Q9Y672 | protein_coding | deleterious(0) | probably_damaging(0.998) | TCGA-BH-A0W7-01 | Breast | breast invasive carcinoma | Female | <65 | I/II | Chemotherapy | taxotere | CR | |
| ALG6 | insertion | Nonsense_Mutation | novel | c.656_657insATCTCTTCACTAAGCTTTTATTTGAAAGGTAAAGTACAGA | p.Phe219LeufsTer5 | p.F219Lfs*5 | Q9Y672 | protein_coding | TCGA-AO-A03R-01 | Breast | breast invasive carcinoma | Female | <65 | I/II | Chemotherapy | doxorubicin | SD | ||
| ALG6 | SNV | Missense_Mutation | c.1507C>G | p.Gln503Glu | p.Q503E | Q9Y672 | protein_coding | tolerated(0.05) | benign(0.003) | TCGA-C5-A1M7-01 | Cervix | cervical & endocervical cancer | Female | <65 | I/II | Unknown | Unknown | SD | |
| ALG6 | SNV | Missense_Mutation | c.1277N>A | p.Arg426Lys | p.R426K | Q9Y672 | protein_coding | tolerated(0.9) | benign(0.007) | TCGA-JW-A5VL-01 | Cervix | cervical & endocervical cancer | Female | <65 | I/II | Unknown | Unknown | SD | |
| ALG6 | insertion | Frame_Shift_Ins | novel | c.1088_1089insT | p.Met365TyrfsTer12 | p.M365Yfs*12 | Q9Y672 | protein_coding | TCGA-BI-A0VR-01 | Cervix | cervical & endocervical cancer | Female | <65 | III/IV | Unknown | Unknown | SD | ||
| ALG6 | deletion | Frame_Shift_Del | novel | c.1228_1229delAA | p.Lys410AspfsTer3 | p.K410Dfs*3 | Q9Y672 | protein_coding | TCGA-EA-A3HU-01 | Cervix | cervical & endocervical cancer | Female | <65 | I/II | Unknown | Unknown | SD | ||
| ALG6 | insertion | Nonsense_Mutation | novel | c.894_895insATAATGAGGTAAGAGAAACAAAGTTTGTATGTAGTATTTT | p.Ser301ArgfsTer2 | p.S301Rfs*2 | Q9Y672 | protein_coding | TCGA-MA-AA43-01 | Cervix | cervical & endocervical cancer | Female | <65 | III/IV | Unknown | Unknown | SD |
| Page: 1 2 3 4 5 6 |
Top |
Related drugs of malignant transformation related genes |
| Identification of chemicals and drugs interact with genes involved in malignant transfromation |
| (DGIdb 4.0) |
| Entrez ID | Symbol | Category | Interaction Types | Drug Claim Name | Drug Name | PMIDs |
| Page: 1 |

Copyright 2023-Present -The University of Texas Health Science Center at Houston |