
|
|||||
|
 | |
| |
| |
| |
| |
| |
|
Gene: ALG5 |
Gene summary for ALG5 |
| Gene information | Species | Human | Gene symbol | ALG5 | Gene ID | 29880 |
| Gene name | ALG5 dolichyl-phosphate beta-glucosyltransferase | |
| Gene Alias | bA421P11.2 | |
| Cytomap | 13q13.3 | |
| Gene Type | protein-coding | GO ID | GO:0006464 | UniProtAcc | Q9Y673 |
Top |
Malignant transformation analysis |
| Identification of the aberrant gene expression in precancerous and cancerous lesions by comparing the gene expression of stem-like cells in diseased tissues with normal stem cells |
| Entrez ID | Symbol | Replicates | Species | Organ | Tissue | Adj P-value | Log2FC | Malignancy |
| 29880 | ALG5 | LZE4T | Human | Esophagus | ESCC | 4.03e-16 | 2.79e-01 | 0.0811 |
| 29880 | ALG5 | LZE5T | Human | Esophagus | ESCC | 1.30e-06 | 3.20e-01 | 0.0514 |
| 29880 | ALG5 | LZE7T | Human | Esophagus | ESCC | 1.23e-03 | 2.05e-01 | 0.0667 |
| 29880 | ALG5 | LZE8T | Human | Esophagus | ESCC | 3.40e-03 | 1.42e-01 | 0.067 |
| 29880 | ALG5 | LZE20T | Human | Esophagus | ESCC | 3.60e-05 | 1.07e-01 | 0.0662 |
| 29880 | ALG5 | LZE22T | Human | Esophagus | ESCC | 5.82e-03 | 1.41e-01 | 0.068 |
| 29880 | ALG5 | LZE24T | Human | Esophagus | ESCC | 7.81e-18 | 3.67e-01 | 0.0596 |
| 29880 | ALG5 | LZE21T | Human | Esophagus | ESCC | 2.70e-04 | 1.27e-01 | 0.0655 |
| 29880 | ALG5 | LZE6T | Human | Esophagus | ESCC | 8.86e-09 | 1.31e-01 | 0.0845 |
| 29880 | ALG5 | P1T-E | Human | Esophagus | ESCC | 3.00e-09 | 2.37e-01 | 0.0875 |
| 29880 | ALG5 | P2T-E | Human | Esophagus | ESCC | 3.01e-30 | 4.76e-01 | 0.1177 |
| 29880 | ALG5 | P4T-E | Human | Esophagus | ESCC | 2.64e-30 | 5.01e-01 | 0.1323 |
| 29880 | ALG5 | P5T-E | Human | Esophagus | ESCC | 7.97e-16 | 2.51e-01 | 0.1327 |
| 29880 | ALG5 | P8T-E | Human | Esophagus | ESCC | 1.57e-29 | 6.64e-01 | 0.0889 |
| 29880 | ALG5 | P9T-E | Human | Esophagus | ESCC | 5.89e-22 | 4.61e-01 | 0.1131 |
| 29880 | ALG5 | P10T-E | Human | Esophagus | ESCC | 9.76e-34 | 6.18e-01 | 0.116 |
| 29880 | ALG5 | P11T-E | Human | Esophagus | ESCC | 1.36e-17 | 3.56e-01 | 0.1426 |
| 29880 | ALG5 | P12T-E | Human | Esophagus | ESCC | 3.91e-19 | 1.82e-01 | 0.1122 |
| 29880 | ALG5 | P15T-E | Human | Esophagus | ESCC | 8.04e-25 | 3.84e-01 | 0.1149 |
| 29880 | ALG5 | P16T-E | Human | Esophagus | ESCC | 1.94e-25 | 4.24e-01 | 0.1153 |
| Page: 1 2 3 4 5 6 7 |
| Tissue | Expression Dynamics | Abbreviation |
| Esophagus | 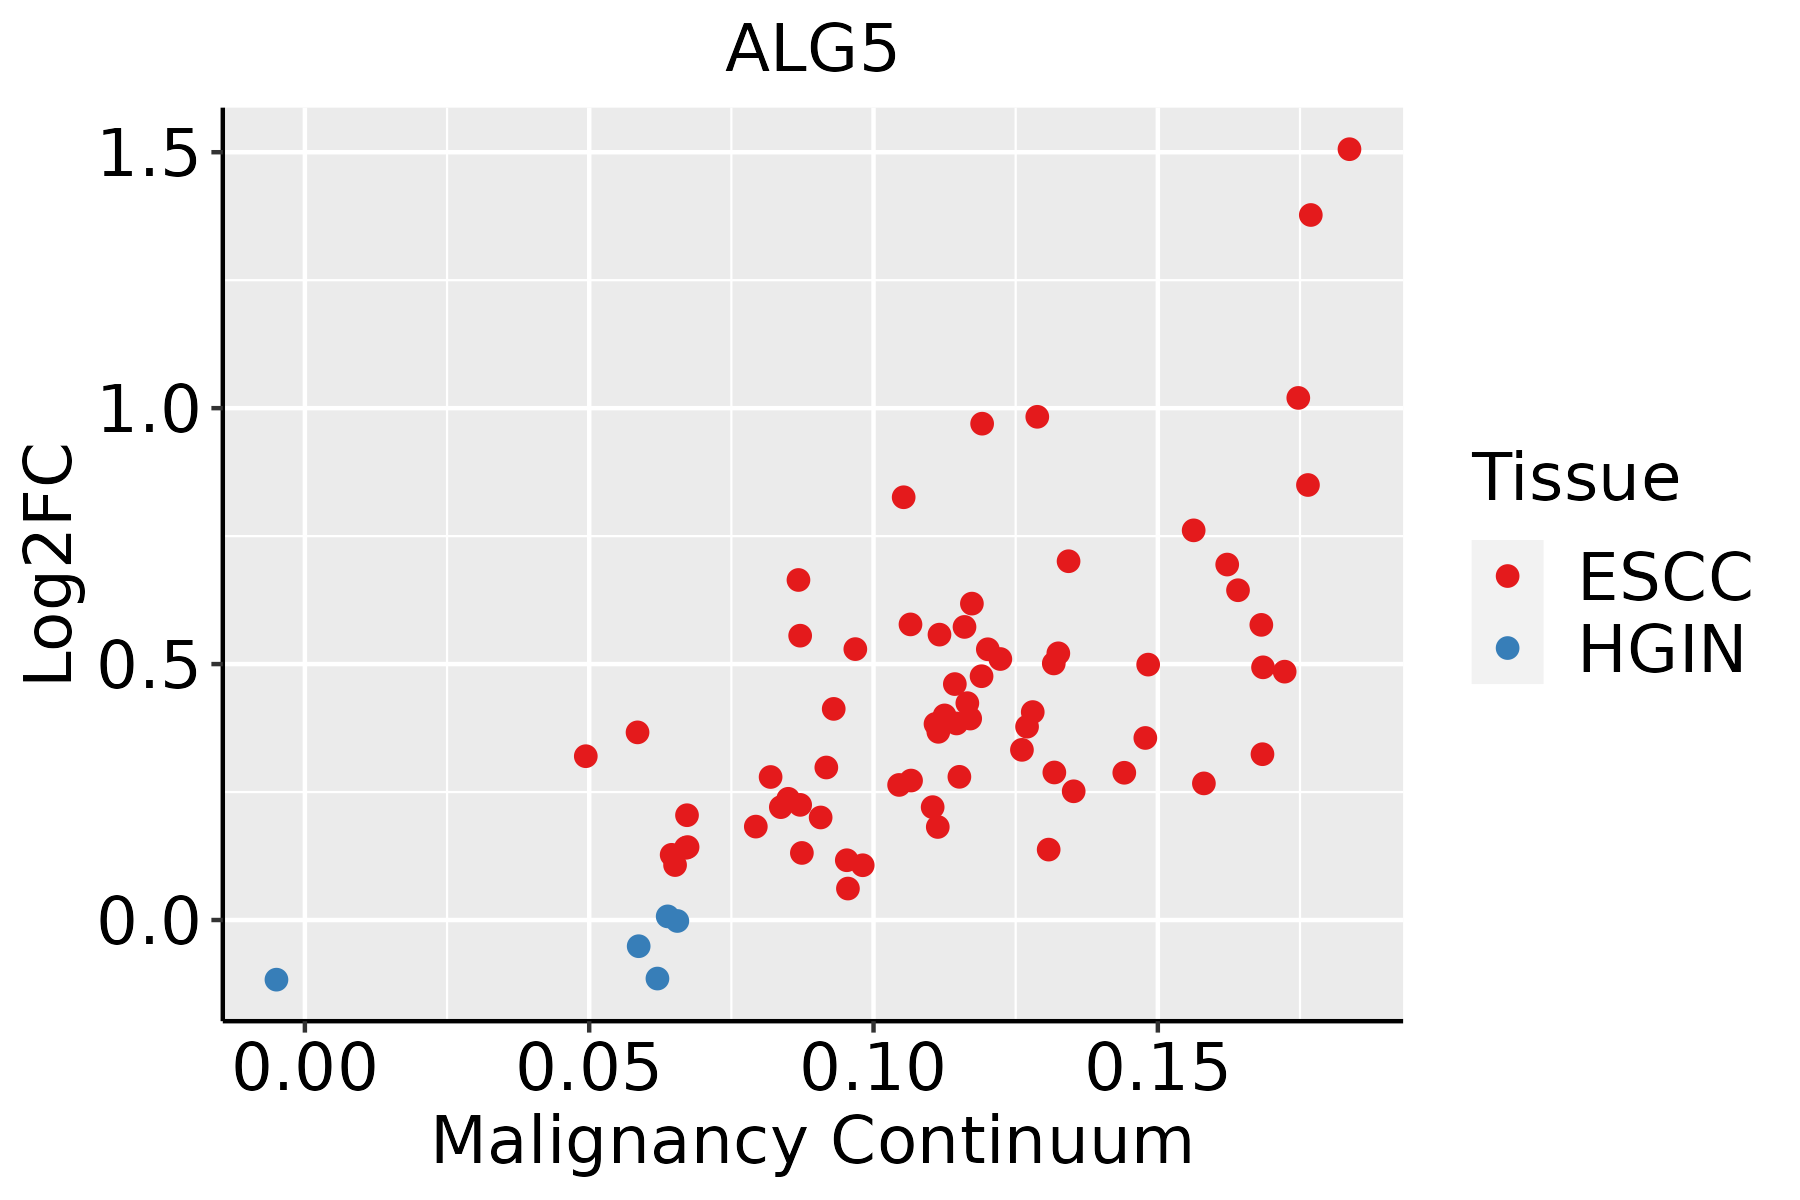 | ESCC: Esophageal squamous cell carcinoma |
| HGIN: High-grade intraepithelial neoplasias | ||
| LGIN: Low-grade intraepithelial neoplasias | ||
| Liver | 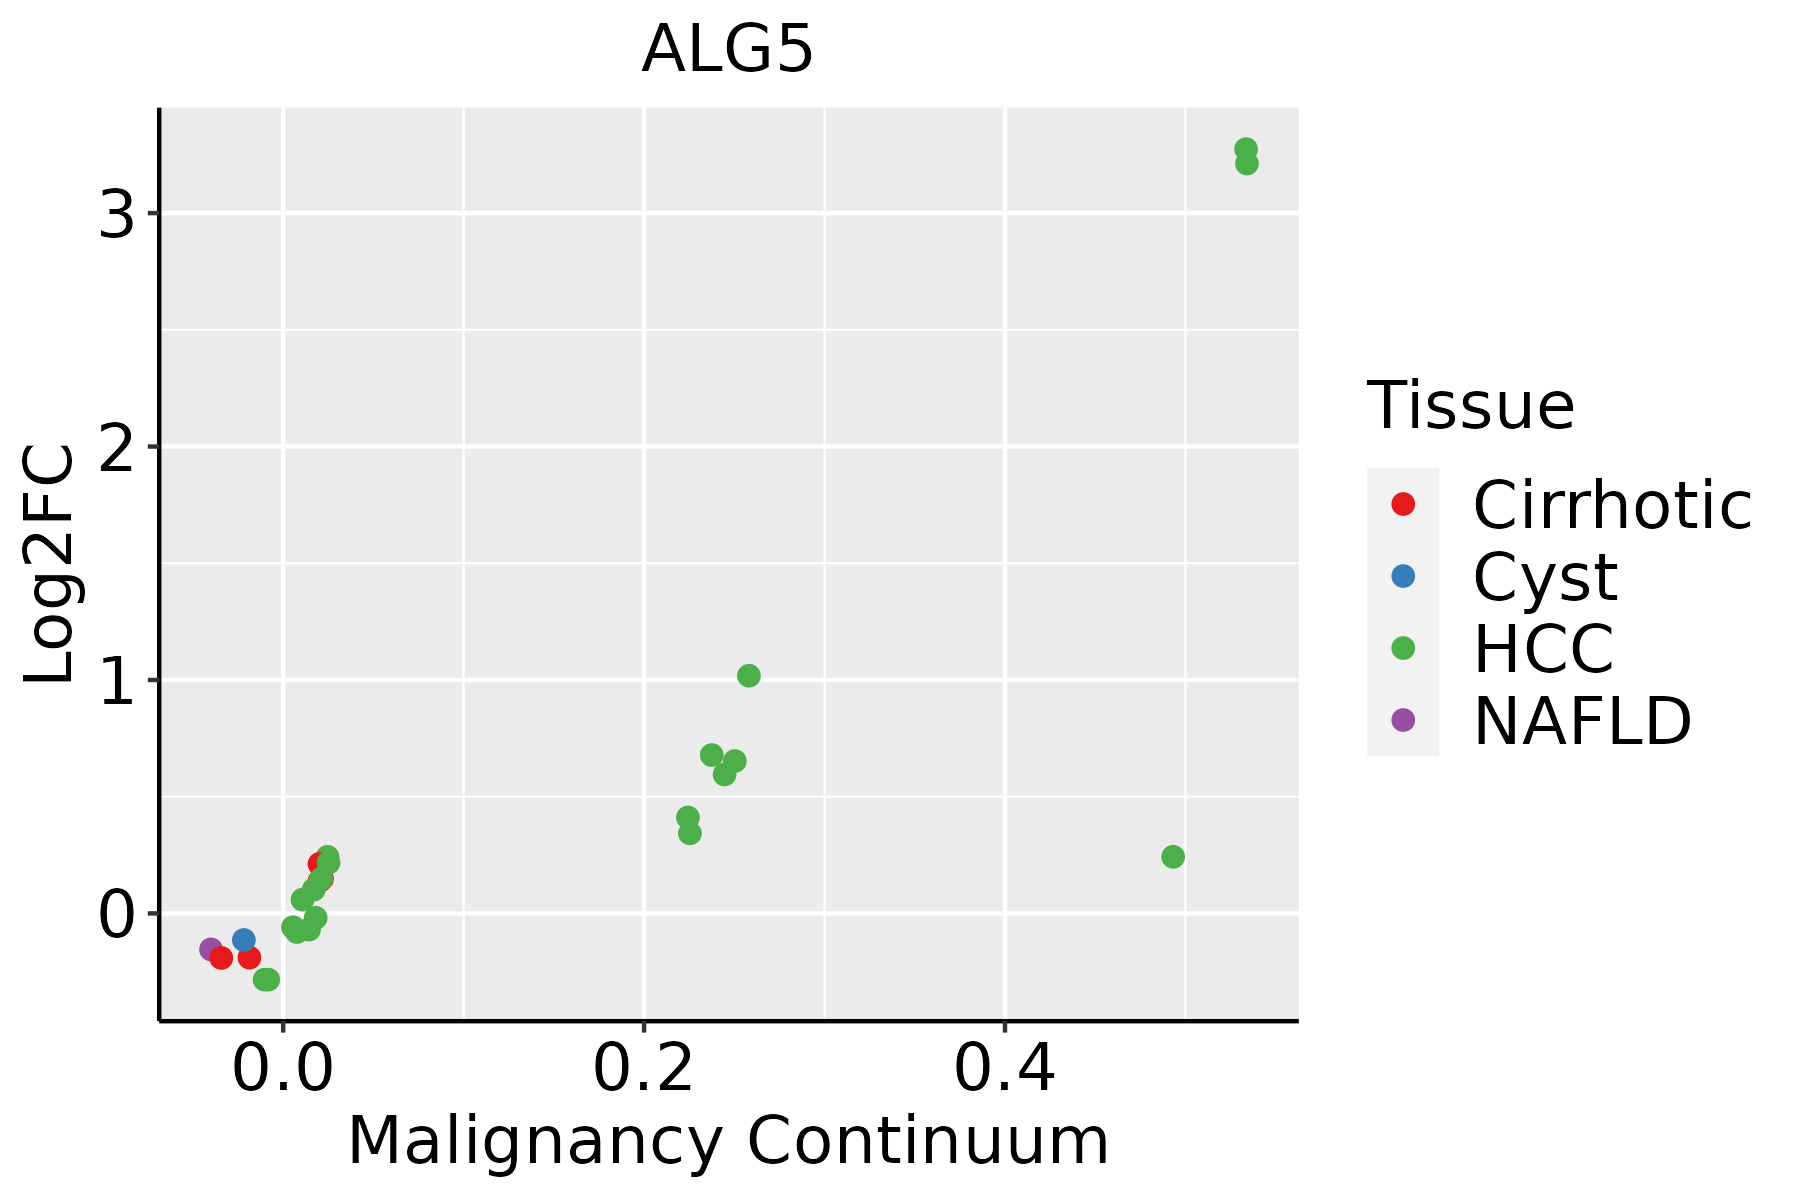 | HCC: Hepatocellular carcinoma |
| NAFLD: Non-alcoholic fatty liver disease | ||
| Oral Cavity | 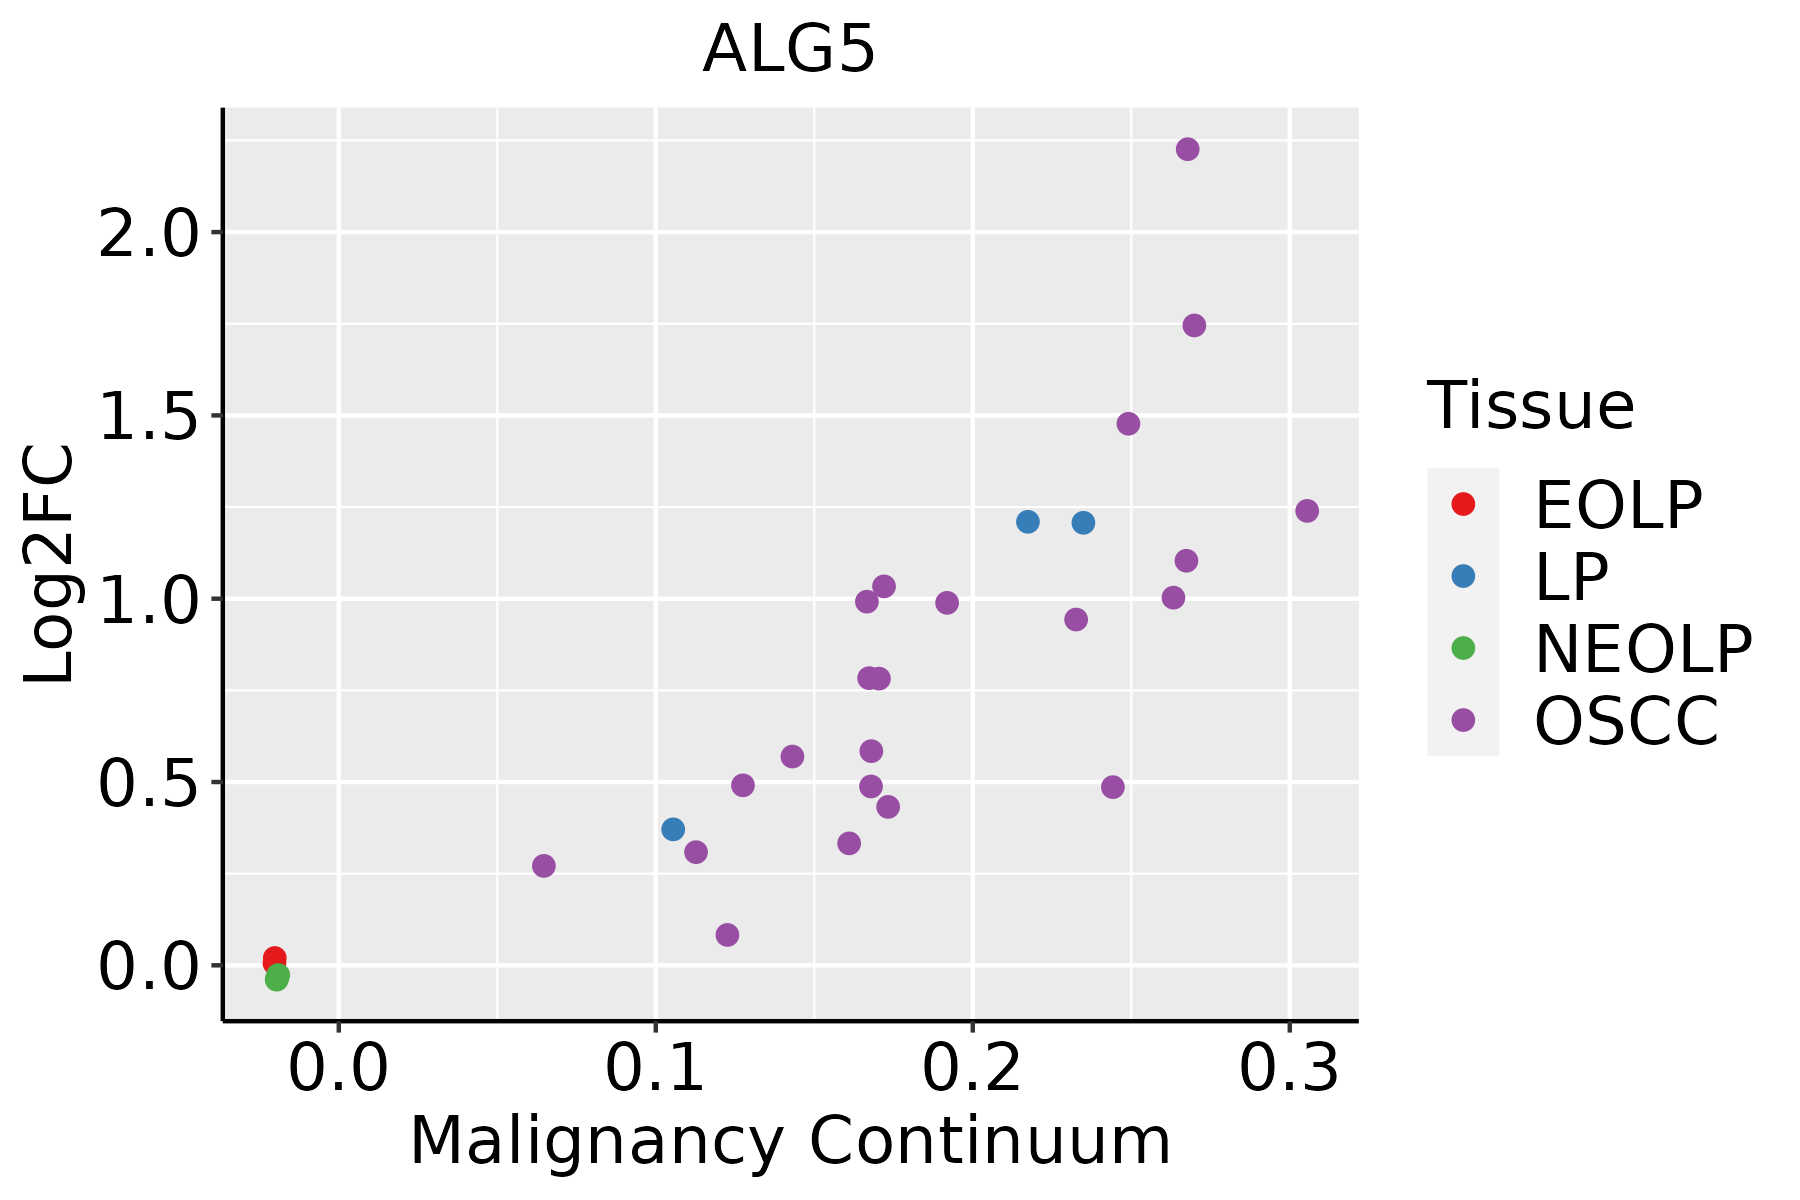 | EOLP: Erosive Oral lichen planus |
| LP: leukoplakia | ||
| NEOLP: Non-erosive oral lichen planus | ||
| OSCC: Oral squamous cell carcinoma | ||
| Skin | 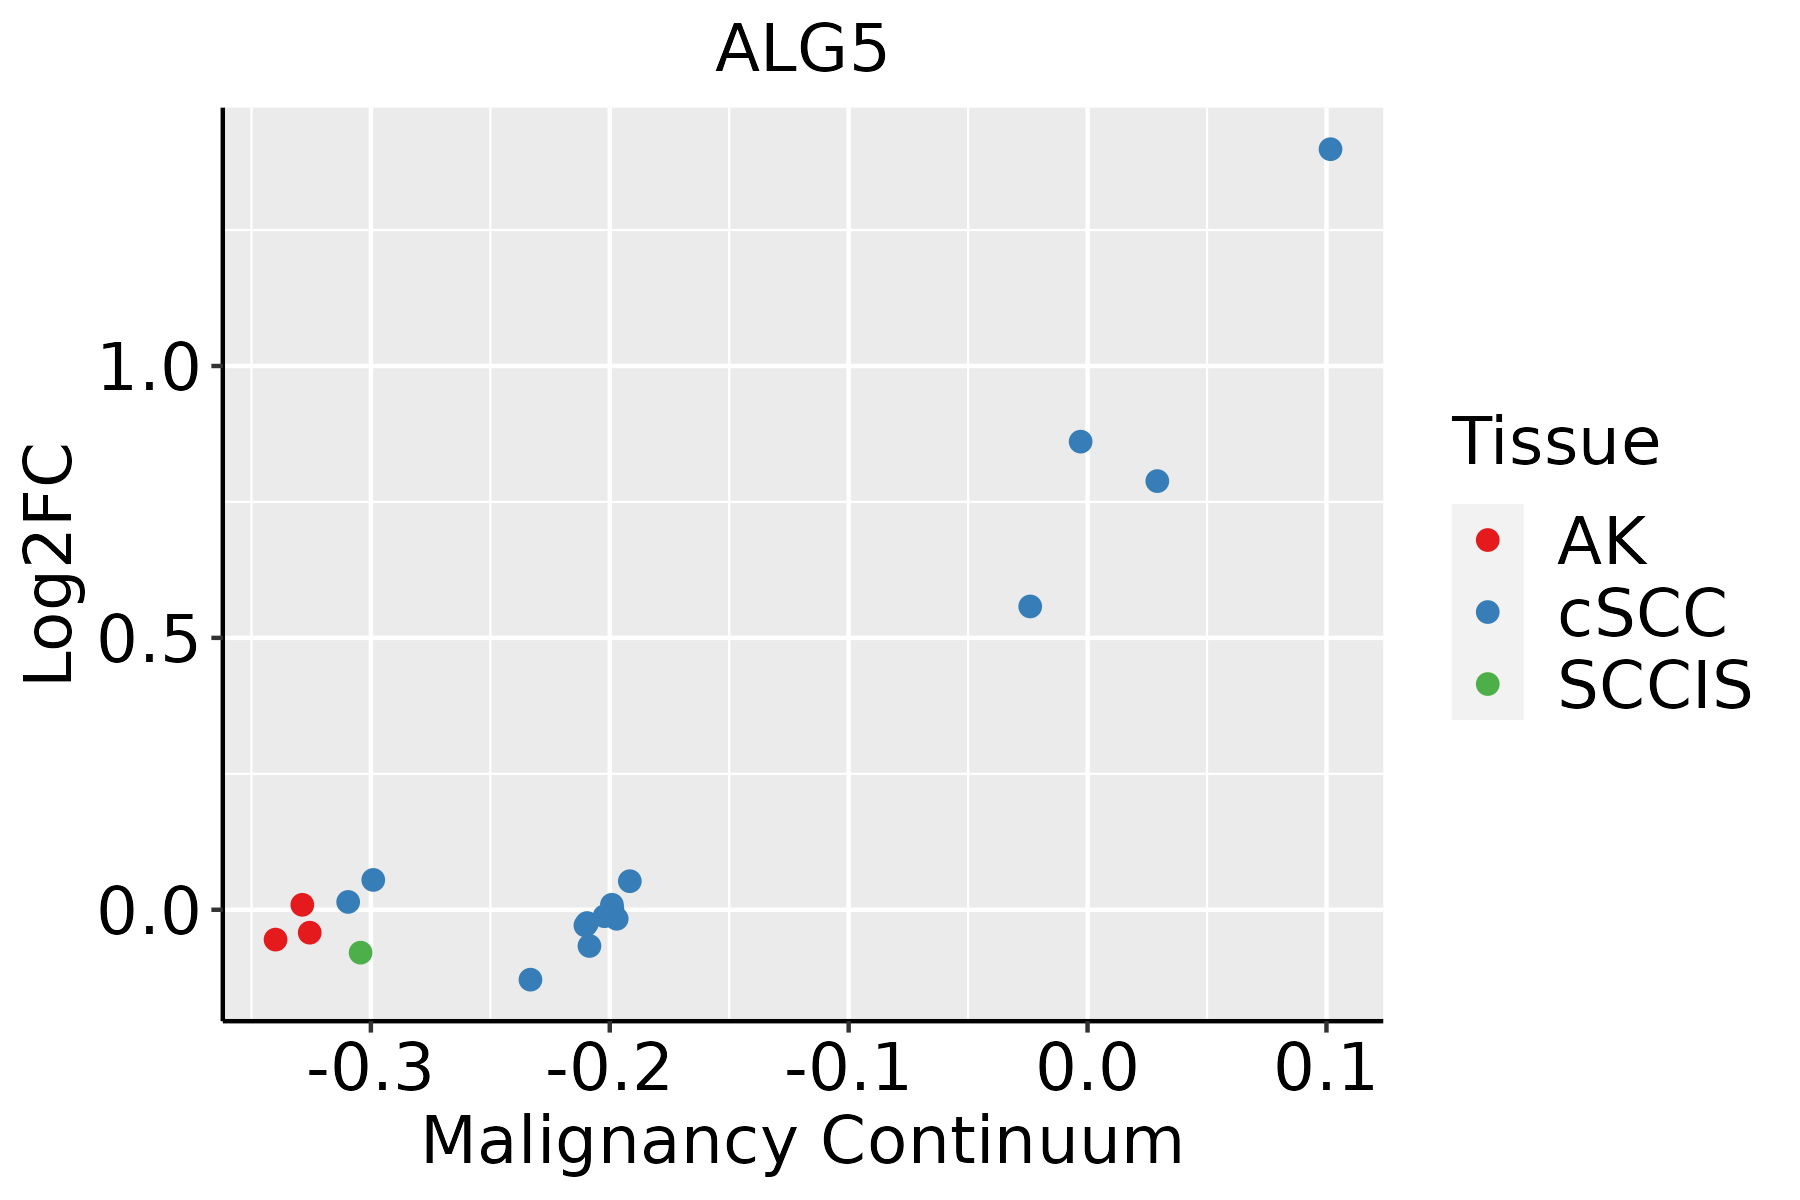 | AK: Actinic keratosis |
| cSCC: Cutaneous squamous cell carcinoma | ||
| SCCIS:squamous cell carcinoma in situ | ||
| Thyroid |  | ATC: Anaplastic thyroid cancer |
| HT: Hashimoto's thyroiditis | ||
| PTC: Papillary thyroid cancer |
| ∗log2FC in expression of this searched gene in stem-like cells from each diseased tissue sample relative to stem-like cells in normal samples in each tissue plotted against the malignancy continuum. Samples are colored based on if they are from different disease stage. |
Top |
Malignant transformation related pathway analysis |
| Find out the enriched GO biological processes and KEGG pathways involved in transition from healthy to precancer to cancer |
| Tissue | Disease Stage | Enriched GO biological Processes |
| Colorectum | AD |  |
| Colorectum | SER |  |
| Colorectum | MSS |  |
| Colorectum | MSI-H |  |
| Colorectum | FAP |  |
| ∗Top 15 enriched GO BP terms are showed in the bar plot of each disease state in each tissue. Each row represents a significant GO biological process which is colored according to the -log10(p.adjust). |
| Page: 1 2 3 4 5 6 7 8 9 |
| GO ID | Tissue | Disease Stage | Description | Gene Ratio | Bg Ratio | pvalue | p.adjust | Count |
| GO:000648714 | Esophagus | ESCC | protein N-linked glycosylation | 51/8552 | 65/18723 | 6.41e-08 | 1.13e-06 | 51 |
| GO:00091002 | Esophagus | ESCC | glycoprotein metabolic process | 226/8552 | 387/18723 | 2.64e-07 | 3.94e-06 | 226 |
| GO:00181969 | Esophagus | ESCC | peptidyl-asparagine modification | 22/8552 | 24/18723 | 2.82e-06 | 3.21e-05 | 22 |
| GO:00700854 | Esophagus | ESCC | glycosylation | 144/8552 | 240/18723 | 5.12e-06 | 5.38e-05 | 144 |
| GO:00182799 | Esophagus | ESCC | protein N-linked glycosylation via asparagine | 21/8552 | 23/18723 | 5.69e-06 | 5.90e-05 | 21 |
| GO:00064865 | Esophagus | ESCC | protein glycosylation | 135/8552 | 226/18723 | 1.36e-05 | 1.24e-04 | 135 |
| GO:00434135 | Esophagus | ESCC | macromolecule glycosylation | 135/8552 | 226/18723 | 1.36e-05 | 1.24e-04 | 135 |
| GO:00091012 | Esophagus | ESCC | glycoprotein biosynthetic process | 181/8552 | 317/18723 | 2.54e-05 | 2.15e-04 | 181 |
| GO:00182795 | Liver | Cirrhotic | protein N-linked glycosylation via asparagine | 16/4634 | 23/18723 | 7.54e-06 | 1.15e-04 | 16 |
| GO:00181965 | Liver | Cirrhotic | peptidyl-asparagine modification | 16/4634 | 24/18723 | 1.74e-05 | 2.37e-04 | 16 |
| GO:00064873 | Liver | Cirrhotic | protein N-linked glycosylation | 30/4634 | 65/18723 | 1.40e-04 | 1.36e-03 | 30 |
| GO:000648711 | Liver | HCC | protein N-linked glycosylation | 48/7958 | 65/18723 | 2.85e-07 | 5.00e-06 | 48 |
| GO:001819611 | Liver | HCC | peptidyl-asparagine modification | 21/7958 | 24/18723 | 6.62e-06 | 7.97e-05 | 21 |
| GO:001827911 | Liver | HCC | protein N-linked glycosylation via asparagine | 20/7958 | 23/18723 | 1.37e-05 | 1.51e-04 | 20 |
| GO:00064862 | Liver | HCC | protein glycosylation | 122/7958 | 226/18723 | 3.11e-04 | 2.21e-03 | 122 |
| GO:00434132 | Liver | HCC | macromolecule glycosylation | 122/7958 | 226/18723 | 3.11e-04 | 2.21e-03 | 122 |
| GO:00700852 | Liver | HCC | glycosylation | 128/7958 | 240/18723 | 4.35e-04 | 2.92e-03 | 128 |
| GO:0009100 | Liver | HCC | glycoprotein metabolic process | 193/7958 | 387/18723 | 1.89e-03 | 9.62e-03 | 193 |
| GO:00064875 | Oral cavity | OSCC | protein N-linked glycosylation | 44/7305 | 65/18723 | 2.63e-06 | 3.26e-05 | 44 |
| GO:00181968 | Oral cavity | OSCC | peptidyl-asparagine modification | 20/7305 | 24/18723 | 1.10e-05 | 1.14e-04 | 20 |
| Page: 1 2 3 |
| Pathway ID | Tissue | Disease Stage | Description | Gene Ratio | Bg Ratio | pvalue | p.adjust | qvalue | Count |
| hsa0051023 | Esophagus | ESCC | N-Glycan biosynthesis | 39/4205 | 53/8465 | 3.26e-04 | 1.15e-03 | 5.89e-04 | 39 |
| hsa0051033 | Esophagus | ESCC | N-Glycan biosynthesis | 39/4205 | 53/8465 | 3.26e-04 | 1.15e-03 | 5.89e-04 | 39 |
| hsa005104 | Liver | Cirrhotic | N-Glycan biosynthesis | 32/2530 | 53/8465 | 3.82e-06 | 4.10e-05 | 2.53e-05 | 32 |
| hsa0051011 | Liver | Cirrhotic | N-Glycan biosynthesis | 32/2530 | 53/8465 | 3.82e-06 | 4.10e-05 | 2.53e-05 | 32 |
| hsa0051021 | Liver | HCC | N-Glycan biosynthesis | 40/4020 | 53/8465 | 2.95e-05 | 1.87e-04 | 1.04e-04 | 40 |
| hsa0051031 | Liver | HCC | N-Glycan biosynthesis | 40/4020 | 53/8465 | 2.95e-05 | 1.87e-04 | 1.04e-04 | 40 |
| hsa005105 | Oral cavity | OSCC | N-Glycan biosynthesis | 39/3704 | 53/8465 | 9.77e-06 | 4.36e-05 | 2.22e-05 | 39 |
| hsa0051012 | Oral cavity | OSCC | N-Glycan biosynthesis | 39/3704 | 53/8465 | 9.77e-06 | 4.36e-05 | 2.22e-05 | 39 |
| hsa0051022 | Oral cavity | LP | N-Glycan biosynthesis | 31/2418 | 53/8465 | 4.86e-06 | 4.14e-05 | 2.67e-05 | 31 |
| hsa0051032 | Oral cavity | LP | N-Glycan biosynthesis | 31/2418 | 53/8465 | 4.86e-06 | 4.14e-05 | 2.67e-05 | 31 |
| Page: 1 |
Top |
Cell-cell communication analysis |
| Identification of potential cell-cell interactions between two cell types and their ligand-receptor pairs for different disease states |
| Ligand | Receptor | LRpair | Pathway | Tissue | Disease Stage |
| Page: 1 |
Top |
Single-cell gene regulatory network inference analysis |
| Find out the significant the regulons (TFs) and the target genes of each regulon across cell types for different disease states |
| TF | Cell Type | Tissue | Disease Stage | Target Gene | RSS | Regulon Activity |
| ∗The dot plots of a searched regulon are shown for all cell subpopulations in each disease state of each tissue based on the regulon specific score inferred using pySCENIC and by calculating the average expression. |
| Page: 1 |
Top |
Somatic mutation of malignant transformation related genes |
| Annotation of somatic variants for genes involved in malignant transformation |
| Hugo Symbol | Variant Class | Variant Classification | dbSNP RS | HGVSc | HGVSp | HGVSp Short | SWISSPROT | BIOTYPE | SIFT | PolyPhen | Tumor Sample Barcode | Tissue | Histology | Sex | Age | Stage | Therapy Types | Drugs | Outcome |
| ALG5 | SNV | Missense_Mutation | c.409C>A | p.Leu137Met | p.L137M | Q9Y673 | protein_coding | deleterious(0.02) | possibly_damaging(0.718) | TCGA-A7-A0DB-01 | Breast | breast invasive carcinoma | Female | <65 | I/II | Hormone Therapy | arimidex | SD | |
| ALG5 | SNV | Missense_Mutation | rs542695178 | c.121N>A | p.Glu41Lys | p.E41K | Q9Y673 | protein_coding | tolerated(0.52) | benign(0.007) | TCGA-AC-A23H-01 | Breast | breast invasive carcinoma | Female | >=65 | I/II | Unknown | Unknown | PD |
| ALG5 | SNV | Missense_Mutation | novel | c.185N>T | p.Ser62Leu | p.S62L | Q9Y673 | protein_coding | tolerated(0.1) | benign(0.001) | TCGA-AC-A2QI-01 | Breast | breast invasive carcinoma | Female | >=65 | III/IV | Chemotherapy | cytoxan | CR |
| ALG5 | SNV | Missense_Mutation | c.650A>G | p.Tyr217Cys | p.Y217C | Q9Y673 | protein_coding | deleterious(0.01) | probably_damaging(0.926) | TCGA-AN-A0AK-01 | Breast | breast invasive carcinoma | Female | >=65 | I/II | Unknown | Unknown | SD | |
| ALG5 | SNV | Missense_Mutation | c.138N>A | p.Phe46Leu | p.F46L | Q9Y673 | protein_coding | deleterious(0.03) | possibly_damaging(0.824) | TCGA-BH-A0C0-01 | Breast | breast invasive carcinoma | Female | <65 | I/II | Chemotherapy | carboplatin | SD | |
| ALG5 | SNV | Missense_Mutation | c.89N>T | p.Thr30Ile | p.T30I | Q9Y673 | protein_coding | tolerated(0.08) | benign(0.027) | TCGA-BH-A0HF-01 | Breast | breast invasive carcinoma | Female | >=65 | I/II | Hormone Therapy | arimidex | SD | |
| ALG5 | deletion | Frame_Shift_Del | novel | c.719delT | p.Leu240TyrfsTer23 | p.L240Yfs*23 | Q9Y673 | protein_coding | TCGA-D8-A27V-01 | Breast | breast invasive carcinoma | Female | <65 | I/II | Hormone Therapy | tamoxiphen | SD | ||
| ALG5 | deletion | Frame_Shift_Del | novel | c.132delN | p.Lys44AsnfsTer4 | p.K44Nfs*4 | Q9Y673 | protein_coding | TCGA-EW-A2FV-01 | Breast | breast invasive carcinoma | Female | <65 | III/IV | Chemotherapy | docetaxel | SD | ||
| ALG5 | SNV | Missense_Mutation | novel | c.947G>A | p.Arg316Lys | p.R316K | Q9Y673 | protein_coding | tolerated(1) | benign(0) | TCGA-C5-A8XH-01 | Cervix | cervical & endocervical cancer | Female | <65 | I/II | Unknown | Unknown | SD |
| ALG5 | SNV | Missense_Mutation | c.635G>A | p.Arg212His | p.R212H | Q9Y673 | protein_coding | deleterious(0) | probably_damaging(0.998) | TCGA-AA-3864-01 | Colorectum | colon adenocarcinoma | Male | >=65 | I/II | Unknown | Unknown | SD |
| Page: 1 2 3 4 |
Top |
Related drugs of malignant transformation related genes |
| Identification of chemicals and drugs interact with genes involved in malignant transfromation |
| (DGIdb 4.0) |
| Entrez ID | Symbol | Category | Interaction Types | Drug Claim Name | Drug Name | PMIDs |
| Page: 1 |

Copyright 2023-Present -The University of Texas Health Science Center at Houston |